Article Text

Abstract
Aims This study aimed to investigate the impact of an ultramarathon (UM) with a distance of 100 miles on heart rate (HR) and heart rate variability (HRV).
Methods 28 runners (25 men and 3 women) underwent 24-hour Holter ECG monitoring 1 week before the UM, immediately after the UM and after a week of recovery. The influence of age, body mass index (BMI), HR and HRV on the run time and recovery was investigated.
Results A rise in the baseline HR (18.98%) immediately after the run accompanied by a significant drop in the SD of all normal RR intervals (7.12%) 1 week after. Except for the runners’ age, BMI, HR and HRV showed no influence on the competition time. Full return of HRV to the athletes’ baseline did not occur within 1 week. There were no significant differences between finishers and non-finishers in the analysed parameters.
Conclusion The present results show that a 100-mile run leads to an increase in sympathetic activity and thus to an increase in HR and a decrease in HRV. Also, HRV might be a suitable parameter to evaluate the state of recovery after a 100-mile run but does not help to quantify the status of recovery, as the damage to the tendomuscular system primarily characterises this after completing a UM.
- endurance
- marathon
- heart
- recovery
Data availability statement
Data may be obtained from a third party and are not publicly available. All results of the study can be viewed at the Institute for Applied Training Sciences Leipzig via coauthor Dr Jan Wuestenfeld. The values are stored on the server under the respective name of the runner and can be accessed via the software 'Custo Diagnostik V.4.6' (custo med, Ottobrun, Germany).
This is an open access article distributed in accordance with the Creative Commons Attribution Non Commercial (CC BY-NC 4.0) license, which permits others to distribute, remix, adapt, build upon this work non-commercially, and license their derivative works on different terms, provided the original work is properly cited, appropriate credit is given, any changes made indicated, and the use is non-commercial. See: http://creativecommons.org/licenses/by-nc/4.0/.
Statistics from Altmetric.com
What is already known
Heart rate variability might be a suitable parameter to evaluate recovery after a 100-mile run.
But until now, there were only a few studies that investigated the impact, particularly in doing an ultramarathon.
What are the new findings
Our findings will allow the athletes to establish new training possibilities for this special kind of endurance sports.
Background
In endurance sports, the heart rate variability (HRV) has been given a high priority in recent years to optimise the timing and intensity of training for optimal preparation for competition highlights.1–3 Studies by Scott et al4 and Nagashima et al5 substantiated extreme endurance sports’ influence on the cardiovascular system. Scott et al4 were able to show a reduced left ventricular function and an increase of biomarkers (especially of N terminal pro-brain natriuretic peptide) after running extreme distances. In principle, all races that are longer than the classic marathon distance of 42.195 km are considered ultramarathons (UMs). The German Ultramarathon Association DUV records races of 45 km or more in its statistics. In another study of UM runners from Japan who participated in and ran the entire 100 km UM at Lake Saroma, Nagashima et al5 showed an enlargement of all ventricles and the aortic root diameter. Further studies showed that regular endurance training leads to an increase in HRV.6–8 However, fatigue and exhaustion also influence HRV and lead to its reduction.9 This explains the frequent use of HRV as a non-invasive parameter that helps determine the current training status and the current regeneration phase.10 This specific examination is necessary to achieve high athletic performance and assess and control the training load and the autonomic effects of physical effort on the athletes.11 12
Nevertheless, the interpretation of HR and HRV in the context of endurance sports is still a controversial topic. Pichot et al demonstrated an increase in HRV indices after 1 week of overtraining in non-athletes,13 another study of two elite triathletes by Plews et al14 reported even a decrease both in HR and HRV following exertion to full physical capacity. The last finding is thought to be due to maximum vagal activity, with the results of a limited modulation capacity of the HRV parameters15 due to already saturated acetylcholine receptors. Also, Schmitt et al showed with the French national skiing team, consisting of 57 elite Nordic skiers who were surveyed over 4 years, that in periods of physical fatigue, a decrease in the HRV parameters is recorded.9
Until now, there were only a few studies that investigated the impact, particularly in doing a UM. Calleja-Romero et al16 showed that HRV monitoring could help assess the relationship between autonomic nervous system activity and performance in a 75 km mountain UM. Fazackerley et al17 determined an increase in HR, accompanied by a decrease in HRV parameters 1 day after completing a 64 km run.
Therefore, we hypothesise that, after completing a UM of about 160.934 km, which is 100 miles, the sympathetic proportion of the autonomic nervous system increases and HRV decreases similarly. Furthermore, a return of the HR and HRV to the baseline might be suspected after a 1-week recovery based on the study by Fazackerley.
Consequently, this study aimed to evaluate the impact of a 100-mile UM on the HR and HRV as parameters of the autonomic effects of physical exertion.
Methods
Subjects and measurement
Several athletes registered for the 100-mile UM ‘Berliner Mauerweglauf’. All participants of the ‘Berliner Mauerweglauf’’ were contacted with the support of the organiser. The aim was to include several participants from Berlin and the surrounding areas, who could travel to Berlin 1 week before the run (U1) and 1 week after the run (U3). The volunteer participants were recruited and examined (age, height, weight) by Charité University of Berlin staff. To participate in our study, the requirements were participation in the UM, written informed consent and an age of over 18 years.
Participants with relevant cardiovascular diseases that limit their fitness for sports or participation in the UM and participants with diabetes mellitus were excluded. It is also worth mentioning that none of the participants took any permanent medication. Overall, 28 athletes (25 men and 3 women) of different age groups with a mean age of 49 years (from 26 to 67) and a mean body mass index (BMI) of 23.97 (from 20.07 to 30.04) were included in the study. All of them received 24-hour Holter ECG at U1, immediately after the run (U2) and at U3.
The ‘Berliner Mauerweglauf’ is a UM with a distance of 100 miles, held annually in August since 2011 and was founded and organised by the ‘Laufgruppe Mauerweg Berlin e.V.’ It is mainly a flat, mostly asphalted route, which runs partly through urban areas and forests. Due to its length and the time limit of 30 hours, the route is not closed to public transport.
Holter ECGs were analysed using the ‘Custo Diagnostik V.4.6’ (custo med, Ottobrun, Germany) software. The resting HR (beats per minute), the HRV values with SDNN (the SD of all normal RR intervals), pNN50 (the percentage of pairs of RR intervals that are more than 50 ms apart), RMSSD (root mean square of successive differences) and the vegetative quotient (as measure of the relationship of slower, sympathetic variability to fast, vagally induced variability) were analysed.
It has to be mentioned that the data sets of the U1 are missing for one finisher. In U2, there are five incomplete data sets, and in U3 there are three incomplete data sets. All missing data were due to technical issues with the recording of the Holter ECG.
Statistics
Data analysis was performed using SPSS statistics V.25 software. Mann-Whitney test was used for continuous variables. Χ2 testing or Fisher’s exact testing was used for dichotomous variables as appropriate. To characterise the influence between continuous variables, a bivariate correlation was used and Spearman’s correlation coefficient (rs) is reported. For this study, α was set at 0.05; thus, p values of <0.05 (two-sided) were required for statistical significance.
Using multiple linear regression, the influence of age, BMI, HR in U1 and the vegetative parameters on the achieved running time, and the influence of these parameters on the recovery value, which the SDNN in U3 characterises, were calculated. The following model was used for this:
Running time=x1×age+x2×BMI+x3×HR U1
Due to the high collinearity, three models were used:
SDNN U3=x1×age+x2×BMI+x3×running time+x4×HR U1+x5×SDNN U1
SDNN U3=x1×age+x2×BMI+x3×running time+x4×HR U1+x5×RMSSD U1
SDNN U3=x1×age+x2×BMI+x3×running time+x4×HR U1+x5×pNN50 U1
The variance inflation factor (VIF) was used to specify the level of correlation between the parameters. Also, to determine the differences in the mean values between the results of U1 and U3, the effect size ‘r’ was calculated with the model: r= . A small effect size was defined as r< 0.1, a medium effect as r<0.3 and a strong effect as r<0.5.18
Patient and public involvement
Patients and/or the public were not involved in the design, or conduct, or reporting, or dissemination plans of this research.
Results
Participant’s characteristics
Participant’s characteristics are shown in table 1.
Participant’s characteristics
The entire 100-mile run was completed by 23 of these athletes with an average run time of 23:09:37 hours. The fastest runner completed the run within 15:25:14 hours. The last one reached the finish after 28:57:45 hours.
The remaining five athletes gave up and did not finish the UM (non-finisher).
Investigation results
Influences on finishing time
No significant correlation could be found between the age (rs=0.388, p=0.067), the BMI (rs=0.309, p=0.151) or baseline resting HR (rs=0.258, p=0.234) and the time needed to complete the marathon. Since the HRV parameters show a high collinearity among each other (VIF: RMSSD=9.09, pNN50=9.02), the influence of all three HRV values of U1 on the running time was calculated individually and only the SDNN value was included in the overall calculation, which is shown in table 2. No correlation between the parameters of the autonomic nervous system and the achieved running time could be determined via the Spearman’s correlation coefficient (RMSSD rs=−0.147, p=0.514, pNN50 rs=−0.102, p=0.650).
Spearman’s rank-order correlation between running time and heart rate (HR), and parameters of the HR variability
Comparison of finishers with non-finishers
A comparison of the finishers (F) with the non-finishers (NF) showed no significant differences in age (F 50.82 years, NF 42.80 years, p=0.115) and BMI (F 23.87 kg/m², NF 24.39 kg/m², p=0.571). Nevertheless, comparing the vegetative diagnostics in U1, higher SDNN averages are seen for non-finishers (F 70.19, NF 100.22) at lower RMSSD averages (F 75.96, NF 60.90). In the U3, higher SDNN averages (F 64.40, NF 76.80) are also evident for non-finishers, but also higher RMSSD averages (F 49.43, NF 77.76) (table 3).
Comparison between finisher and non-finisher in U3
Parameters of autonomic regulation
It could be seen that the higher the measured HR of the athletes (especially in U2), the lower the SDNN value. But the difference between the values of HR in U1 and U2 did not affect the magnitude of the change in the SDNN value (U1: p=0.235; U2: p=0.363).
When comparing the HR, as well as the HRV of the double runners of both years, revealed no relevant differences in all three examinations, the run times were also nearly identical (HR p=0.126, SDNN p=0.763, RMSSD=0.791, pNN50=0.5).
Parameters of post-exertional recovery
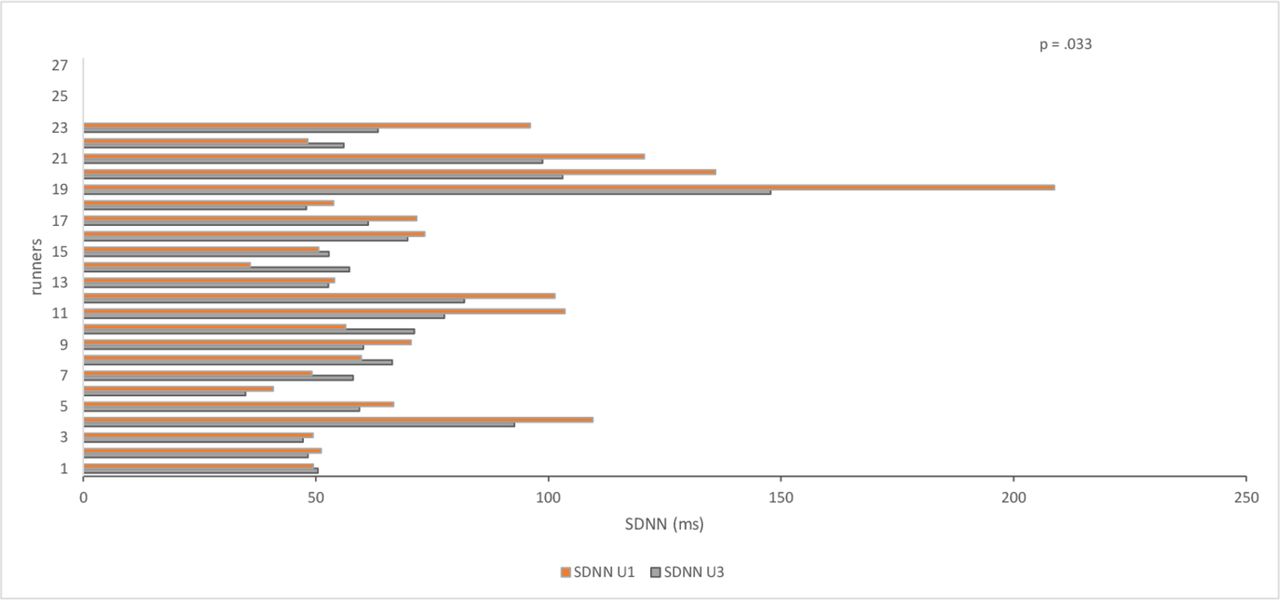
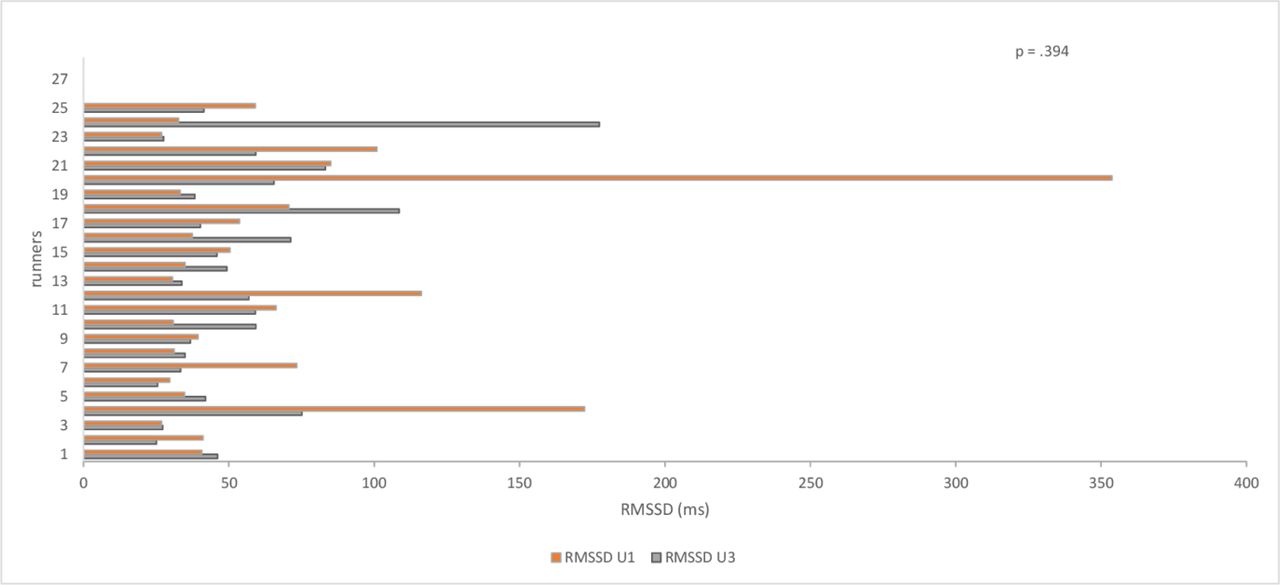
Comparing the values at U1 with the values at U3, no significant difference between the results of the HR could be determined (HR p=0.271, r=0.216). However, based on HRV (SDNN, RMSSD and pNN50), it is noticeable that the average values after 7 days of recovery are still considerably below the baseline values (figures 1–4).

Mean value of the HR in U1 and U3. bpm, beats per minute; HR, heart rate; U1, investigation 7 days before the run; U2, investigation immediately after the run.

Mean value of the SDNN in U1 and U3. SDNN, the SD of all normal RR intervals; U1, investigation 7 days before the run; U3, investigation 7 days after the run.

Mean value of the RMSSD in U1 and U3. RMSSD, root mean square of successive differences; U1, investigation 7 days before the run; U3, investigation 7 days after the run.

Mean value of the pNN50 in U1 and U3. pNN50, the percentage of pairs of RR intervals that are more than 50 ms apart; U1, investigation 7 days before the run; U3, investigation 7 days after the run.
Noticeably in SDNN, the differences were not significant, except for the values of the SDNN (SDNN=0.033, RMSSD=0.394, pNN50=0.087). Comparing the mean values between the HRV values from the U1 and the U3, only a medium effect size is shown for pNN50 (SDNN r=0.437, RMSSD r=0.175, pNN50 r=0.325).
Due to a high correlation between the vegetative parameters and the recovery value, which the SDNN in U3 characterises (VIF: SDNN U1=23.86, RMSSD U1=35.77, pNN50 U1=8.37), these were removed from the regression model and calculated individually in models shown in the Methods section, which have been adjusted for age, BMI, running time and HR U1. Table 4 shows the values from the model with the greatest degree of determination (SDNN U1: R²=0.903, F(5,13)=34.434). The regression model shows that neither age (p=0.846) nor BMI (p=0.488), nor HR (p=0.415) nor the achieved running time (p=0.889) influences the recovery value, but the vegetative parameters’ initial values as part of the regression calculation significantly influenced the recovery value (table 4).
Multiple linear regression—dependent variable SDNN U3
Discussion
Our study aimed to evaluate the influence of running a UM over a distance of 100 miles on the HR and the HRV and the potential use of these parameters to evaluate the recovery status.
Consistent with published data,9 13–17 the present study found an increase in HR during the first hours after the UM (U2). This is commonly accepted to be due to a shift of the autonomic nervous system in favour of sympathetic activity.19 20 This sympathetic dominance leads to a decline of the SDNN value, which describes the cooperation between the sympathetic and parasympathetic nerves21 22 and is consistent with our data. The athlete’s fatigue and impaired performance are often associated with reduced vagal HRV, which is evident when comparing RMSSD values between U1 and U3 (table 1).10 23
The main finding of the current study is shown in the comparison of the parameters of the autonomic nervous system at U1 with the measurements at U3. While the baseline HR at U1 showed no significant differences to the measurements at U3, it can be seen that there is still no full return to baseline of the HRV at U3, shown by lower average values for the SDNN, RMSSD and pNN50 (figures 1–4).
First of all, these results seem to indicate that even 7 days after the 100 miles, the athletes have not yet fully recovered from the effort in terms of vegetative parameters. However, an increase in the vegetative parameters is shown in the comparison between U2 and U3. Comparable with the values of U2 is the result of Valenzano et al, who examined an ultra-endurance swimmer over a distance of 78.1 km, whose HRV was still lower after 16 hours of recovery compared with his initial HRV.24 The study by Chambers et al showed that the HR response to renewed steady-state exercises after a 90 km marathon takes almost a month to return to the same initial values.25 This is due to the damage to the tendomuscular system, which leads to an increase in HR due to the impaired economy of locomotion. Also, Nicolas et al were able to show that stress and recovery values after a 24-hour race (100 km) take 2 weeks to return to baseline level.26 Our data imply that in terms of recovery after a 100-mile run, HRV seems to be more accurate in predicting recovery than the absolute HR. However, these findings stand in contrast to the findings of Fazackerley et al,17 whose runners achieved a return of HRV to baseline within 2 days after a 64 km run. The extremely shorter duration might explain this difference to complete the marathon covered or superior physical fitness of the athletes reported in the Fazackerley study.
Although the HR and HRV seem to be useful to evaluate recovery after such an extreme exertion, none of the physiological parameters, neither the baseline HR nor the baseline HRV, seems to predict the finishing time.
When analysing the data to factors influencing the finishing times, the presented data showed that only the runners’ age had an effect.
The small number of participants in this study allows for speculation. The low pre-race RMSSD mean of non-finishers, which is also referred to as the body’s recovery rate,27 28 might be interpreted as a better ability of the finishers to regenerate in advance. The fact that RMSSD in U3 was higher in the non-finishers than in the finishers is probably justified by the considerably lower running distance covered by the non-finishers (table 3).
The presented data imply that none of the parameters predicting post-exertional recovery can be used to predict finishing times or the ability to finish a UM as such. There are a number of factors that influence the finishing of a UM. These include not only physiological factors, such as the HR and HRV described in this paper, but also tendomuscular and neuromuscular factors that are part of the physiology. Other factors, such as the influence of environmental and psychological factors, can also play a decisive role in completing a UM.
Study limitations
This study’s limitations include the low number of subjects, which could limit the ability to detect statistical significance and the lack of further post-run control to establish an exact time to return to baseline.
A prospective study with more patients, multiple follow-ups, and the capture of multiple predictors such as mental health, exercise status or weather conditions could help quantify the differences between finishers and non-finishers and the impact of other factors on the run time.
There are no potential sources of conflict of interest in our study.
Conclusions
The presented results imply an increase in sympathetic activity reflected by an increase in HR and decreased HRV during the first 24 hours post-race in athletes after a 100-mile run. Furthermore, data suggest possible suitability of the HRV to evaluate the state of recovery after a 100-mile run. Still, they cannot quantify recovery status as the damage to the tendomuscular system characterises this, nor are they intended to predict target times or the probability of completing a UM completely.
Data availability statement
Data may be obtained from a third party and are not publicly available. All results of the study can be viewed at the Institute for Applied Training Sciences Leipzig via coauthor Dr Jan Wuestenfeld. The values are stored on the server under the respective name of the runner and can be accessed via the software 'Custo Diagnostik V.4.6' (custo med, Ottobrun, Germany).
Ethics statements
Ethics approval
The investigation conforms to the principles outlined in the Declaration of Helsinki. The study protocol has been approved by the ethics committee of Charité-Universitätsmedizin (EA2/133/17), and athletes were included after medical assessment by an experienced sports physician. Informed consent was obtained from every participant.
Acknowledgments
The authors would like to thank the athletes for their participation and for giving their consent. We would also like to express our gratitude to the Institute for Applied Training Science in Leipzig, Germany. We also acknowledge support from Leipzig University for Open Access Publishing.
References
Footnotes
CP and SS contributed equally.
Contributors TT and PJS-H carried out the experiment and the measurements and conceived the original idea. SS wrote the manuscript with support from CP and JW. All authors discussed the results and contributed to the final manuscript.
Funding We acknowledge support by the Open Access Publication Fund of the University of Leipzig.
Disclaimer Neither the Open Access Publication Fund of the University of Leipzig nor any of its employees were involved in the study’s design, the collection, analysis and interpretation of data, and in writing the manuscript.
Competing interests None declared.
Provenance and peer review Not commissioned; externally peer reviewed.