Article Text

Abstract
Background/aim The Run Clever trial investigated if there was a difference in injury occurrence across two running schedules, focusing on progression in volume of running intensity (Sch-I) or in total running volume (Sch-V). It was hypothesised that 15% more runners with a focus on progression in volume of running intensity would sustain an injury compared with runners with a focus on progression in total running volume.
Methods Healthy recreational runners were included and randomly allocated to Sch-I or Sch-V. In the first eight weeks of the 24-week follow-up, all participants (n=839) followed the same running schedule (preconditioning). Participants (n=447) not censored during the first eight weeks entered the 16-week training period with a focus on either progression in intensity (Sch-I) or volume (Sch-V). A global positioning system collected all data on running. During running, all participants received real-time, individualised feedback on running intensity and running volume. The primary outcome was running-related injury (RRI).
Results After preconditioning a total of 80 runners sustained an RRI (Sch-I n=36/Sch-V n=44). The cumulative incidence proportion (CIP) in Sch-V (reference group) were CIP2 weeks 4.6%; CIP4 weeks 8.2%; CIP8 weeks 13.2%; CIP16 weeks 28.0%. The risk differences (RD) and 95% CI between the two schedules were RD2 weeks=2.9%(−5.7% to 11.6%); RD4 weeks=1.8%(−9.1% to 12.8%); RD8 weeks=−4.7%(−17.5% to 8.1%); RD16 weeks=−14.0% (−36.9% to 8.9%).
Conclusion A similar proportion of runners sustained injuries in the two running schedules.
- Recreational runners
- Injury
- Running intensity
- Running volume
- injury risk difference
This is an Open Access article distributed in accordance with the Creative Commons Attribution Non Commercial (CC BY-NC 4.0) license, which permits others to distribute, remix, adapt, build upon this work non-commercially, and license their derivative works on different terms, provided the original work is properly cited and the use is non-commercial. See: http://creativecommons.org/licenses/by-nc/4.0/
Statistics from Altmetric.com
Key messages
More recreational runners are not injured by a relative progression in the weekly volume of running at a hard intensity compared with a relative progression in the total weekly volume.
Small absolute changes in the weekly volume of running intensity and the total weekly volume during a 16-week period caused considerable proportion of running-related injuries.
Increased attention towards the complex interaction between training variables in running is warranted before preventive measures based on modification of running participation can be successful.
Introduction
Locally and globally, there is a growing concern about the rise in several non-communicable diseases.1 2 In this light, physical activity as a preventional measure should be taken seriously and be performed regularly.3 Recreational running is a popular form of physical activity in many countries worldwide given its accessibility, low financial cost and association with a positive effect on a range of health benefits.4 5 Consequently, clinicians and health authorities have been advised to promote running and support policies advertising investments in running schedules. Investing in running schedules may be particularly valuable since training variables (eg, running volume and running intensity) are easy modifiable to accommodate individual needs in terms of motivation and risk of injury.6
Running-related injury (RRI) can affect runners at all levels.7–9 Among recreational runners, an injury incidence rate of 7.7 (95% CI 6.9 to 8.7) per 1000 hours of running is reported.8 This is unfortunate since RRIs are costly and are one of the major barriers for continued running in a long-term perspective.7 10 11 Therefore, prevention of these injuries is needed for runners to maintain an active and healthy lifestyle. Across a range of methodological papers, researchers seem to agree that prevention of RRI is possible through an appropriate dose of running.12 If this is true, research examining the association between running schedules and running injury is of utmost importance.
When planning a running schedule, a combination of modifiable training variables needs consideration.13 14 Of these, running volume or running intensity and their association with RRI have been investigated extensively.15 16 However, most previous analyses have considered the isolated association between a single training variable and injury, without considering the complex relationship between them.16 In 1977, Pollock et al17 used study design to control for this complex relationship. The study investigated the association between running frequency and running duration on running injury. The training variables running intensity and progression of running volume were controlled for through the study design since all participants followed prespecified schedules and ran either on a treadmill or on an asphalt track, while observed by the investigators. This study gave valuable understandings into the association between modifiable training variables and RRI. Unfortunately, all included participants were male inmates, which challenges the generalisability to the diverse population of recreational runners. More recently, Buist et al18 conducted a randomised trial with the aim of determining the effect of a graded training programme on RRI incidence. While controlling for frequency and intensity, novice runners followed running schedules which differed in the average weekly progression in running volume. Again, controlling for training-related factors must be considered a strength in their study design. Unfortunately, participants only received verbal instructions on running intensity at baseline and running intensity was not measured during follow-up.
The previous studies by Pollock et al17 and Buist et al18 contributed with valuable insight into the role of different running programmes, while considering a range of modifiable training variables such as volume, intensity and frequency. However, it must be contended that the research surrounding this thematic is in its infancy. Therefore, the Run Clever trial was designed to investigate if there was a difference in injury occurrence across two running schedules, focusing on either progression in running intensity or in running volume, while controlling for periodisation, number of weekly sessions, volume and relative running intensity.19 Because of the increased musculoskeletal load when running at a higher intensity, despite the probably larger cumulative load when running a greater volume,12 20 21 it was hypothesised that 15% more runners with a focus on progression in running intensity would sustain an RRI compared with runners with a focus on running volume.
Methods
Prior to recruitment the trial was registered at Clinicaltrials.gov (23 January 2015) (NCT02349373) and a protocol article was submitted to BMC Musculoskeletal Disorders, including an in-depth description of the methods (14 March 2015).19 The trial was conducted from April 2015 to March 2016. All included participants provided verbal and written consent. The reporting in this article complies with the 2010 Consolidated Standards of Reporting Trials statement, with the exception that a relative measure of association is not reported (item 17b).22
Design
A randomised parallel-group trial with a 24-week follow-up divided into an 8-week preconditioning period and a 16-week specific focus training period. In the preconditioning period, all included runners received similar running schedules. During the specific focus training period, runners received one of two running schedule interventions: (i) schedule intensity (Sch-I) with a focus on progression in running intensity or (ii) schedule volume (Sch-V) with a focus on progression in running volume. The 8-week preconditioning period served as physical preparation for the 16-week focused training period.
Data collection and intervention administration
During the 24-week follow-up, two types of data were collected: (i) questionnaire-based data on injury status, which was distributed automatically via email on a weekly basis, and (ii) data on running performed were collected by global positioning system (GPS) using the Help2Run smartphone application (Help2Run, Denmark) or a commercially available Garmin GPS watch (Garmin International, Olathe, Kansas, USA). When a training session was completed, the session-specific GPS data were automatically uploaded to an internet-based training diary. This allowed the participant to get an overview of completed and upcoming running sessions. In addition, data from the internet-based training diary could be assessed by the research team through a secured back-end system and data could be extracted for statistical analyses.
Participants
Healthy recreational runners, between 18 and 65 years of age, who owned an iOS-based or Android-based phone were eligible for inclusion. Recreational runners were defined as runners with a weekly running frequency of 1–3 sessions during the past six months. Information on eligibility was collected prior to baseline using an internet-based questionnaire. Questionnaires submitted were assessed using the following exclusion criteria: injured within the past six months, pregnant or vigorous physical activity contraindicated.23 Eligible participants received verbal information by telephone and were instructed on the importance of following the running schedule strictly and to quantify their running through GPS.
Interventions
In both schedules, running frequency was three times per week and the periodisation was divided into 4-week blocks with structured progression/regression. In the first week in each 4-week block, weekly running volume would progress 23% and the last week running would regress 10%. In the 8-week preconditioning period, all participants followed the same running schedule. Then, the schedules differed in the following manner during the 16-week intervention period: in Sch-I, participants increased the weekly volume of running at an intensity (minutes per kilometre) equal to or above a VO2max of 88% (hard). In Sch-V, participants increased the total running volume equal to or below a VO2max of 80% (easy). Detailed information on the content of the running schedules is presented in a protocol article.19
Compliance
In an attempt to improve compliance to the interventions, running intensity was determined individually using an estimated VO2max. The VO2max estimation, which was based on an algorithm described by Jack Daniels,24 required each participant to perform an individual running test (each person could choose between 1500 m, Coopers test, or 5000 m), which was administered through the smartphone application at baseline and on a 8-week interval during follow-up. After estimation of the VO2max, the mobile application provided real-time, individualised feedback on the distance covered, the distance remaining and the running intensity (minutes per kilometre) to each runner during running. If a participant ran too fast or too slow, the mobile vibrated and an audio-alarm told him/her to slow down or speed up. If he/she ran according to the scheduled pace, they were told they did fine.
Outcome
The outcome of interest was RRI, using a time-loss definition, ‘An injury sustained on muscles, joints, tendons and/or bones during or after running and attributed to running. The injury must have caused a training reduction (reduced distance, intensity, frequency etc) for at least 7 days’.18 25
Weekly questionnaires administered by automated emails each Sunday were used to collect information on RRI. If a participant had experienced time loss, a preliminary enquiry between the participants and investigators by telephone would determine if the time loss could be related to running. Participants with a time-loss injury possibly related to running were referred to a team of physiotherapists. These examined the runners to determine if the injuries were running-related.
Randomisation
Block randomisation in blocks of 10 were used to randomly allocate participants to either Sch-I or Sch-V. At baseline prior to preconditioning, the random sequence allocation was applied by a secure back-end system. When an investigator registered a participant in the back-end system as included, the back-end system would allocate the participant to one of the running schedules. The allocation was concealed until after inclusion.
Participants received no information on the result of their individual allocation, but could get an overview of the content of their personal running schedule using the smartphone application or internet-based training diary. Physiotherapists assessing outcome were blinded.
Power
Based on a superiority calculation with a minimum absolute difference in injury risk of 5% and a hypothesized effect size of 15%, a sample size of 620 participants was required to reach a power of 80% with a significance level of 5%. To accommodate loss to follow-up, at least 15% more participants than the required 620 was included.
Statistical methods
An instrumental variable (IV) approach, with the randomisation as the instrument, was chosen as the primary analysis to control for confounding due to non-compliance.26 Secondary analysis was intention to treat (ITT) and per protocol (PP). Adherence to the intervention of ≥80%, based on scheduled and registered running sessions, was used to dichotomise compliance into compliant participants (≥80%) and non-compliant participants (<80%). In the IV analysis, non-compliant participants from Sch-I were analysed as part of the reference group (Sch-V). The PP analysis only included compliant participants.
To test the hypothesis that 15% more runners sustained RRI in Sch-I compared with Sch-V (reference), a generalised linear regression (pseudo-observation method)27 28 was used with cumulative injury risk difference as measure of association. Primary time scales were weeks (data analysed at 2, 4, 8 and 16 weeks) and days (data analysed at 14, 28, 56 and 112 days) after the beginning of the specific focus training period. Secondary time scales were running volume in kilometres and minutes of running (see online supplementary material). Participants were right-censored in case of pregnancy, illness, accidents causing a permanent stop of running, lack of motivation, >10% manual upload of performed running or end of follow-up. Non-running-related injuries were analysed as competing risks. Differences are considered statistical significant at P<0.05. All analyses were performed using STATA/SE V.13.
Results
After public announcement of the study in running clubs, at race organisers and by social media, 1535 volunteers answered the online eligibility questionnaire. Eligibility assessment excluded 696 (45%) volunteers. Of these, 173 (25%) refrained from participating after verbal information was provided either due to the rigidity of the running schedule or the requirement of collecting data on running participation using GPS.
In total, 839 volunteers were included in the trial and allocated to one of the two running schedules. During preconditioning, 198 (47% of 419) in Sch-I were censored and 194 (46% of 420) in Sch-V were censored. Finally, a sample of 447 participants entered the intervention period, 221 (49% of 447) in Sch-I and 226 (51% of 447) in Sch-V (figure 1). Baseline characteristics of the two groups are presented in table 1.
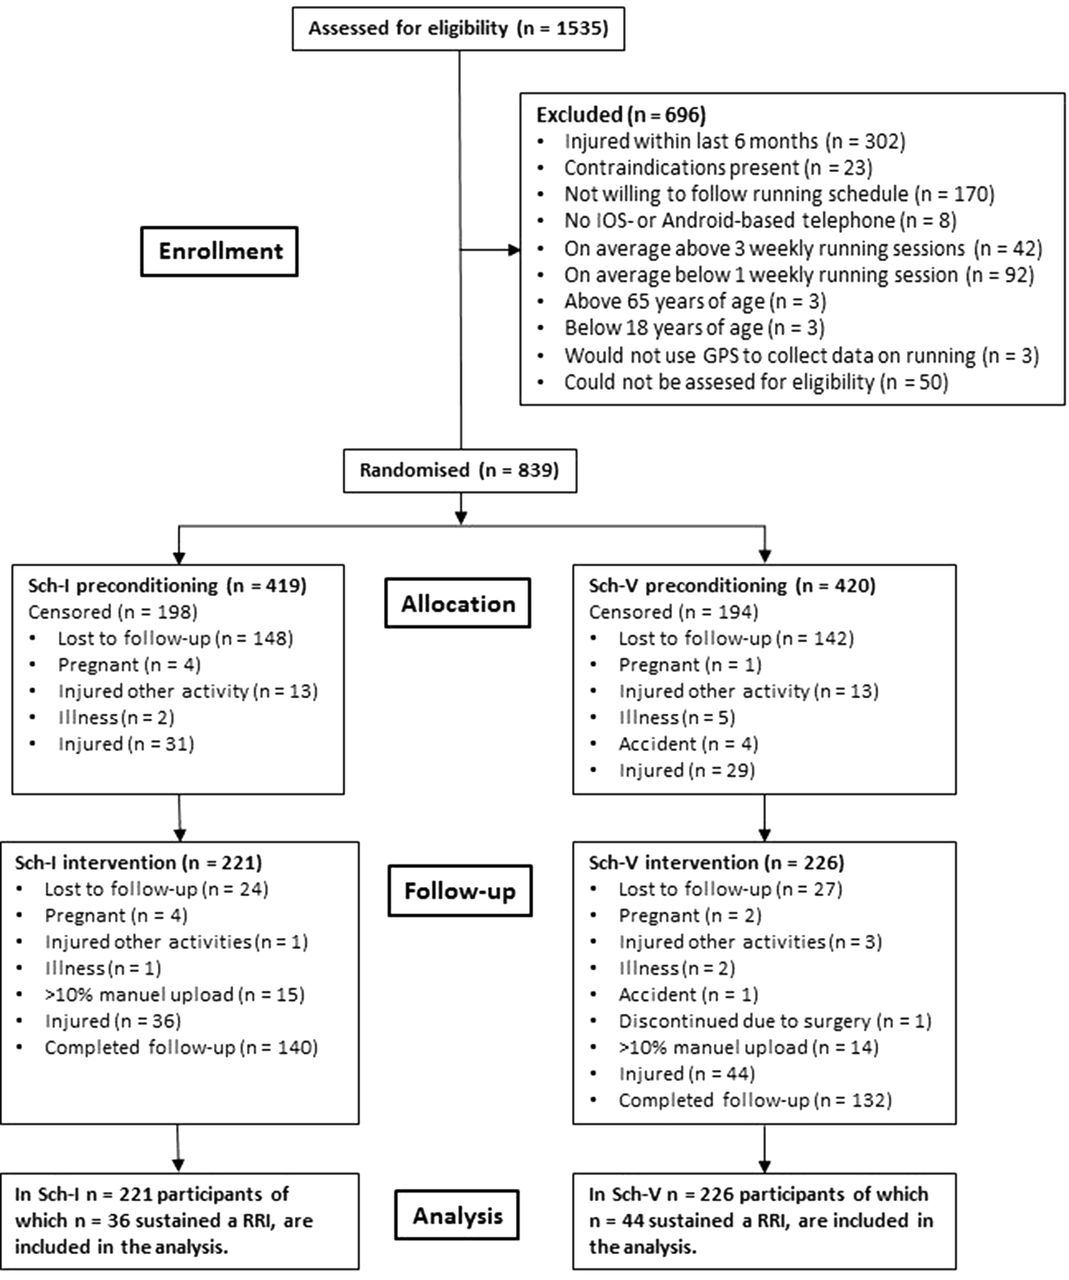
Flow diagram from recruitment to end of follow-up. GPS, global positioning system; iOS, iPhone operating system; RRI, running-related injury; Sch-I, schedule intensity; Sch-V, schedule volume.
Baseline characteristics of the two groups
Injury risk difference
During the specific focus training period, 80 participants sustained an RRI: 36 of 221 runners (16%) in Sch-I and 44 of 226 (19%) in Sch-V. Results on absolute difference in risk between Sch-I and Sch-V as a function of all time scales are presented in table 2. Kaplan-Meier curves of the cumulative incidence proportion are presented in figure 2. Results from secondary analysis on absolute difference in risk as a function of all four time scales are presented in the online supplementary material tables 3–6.
Supplemental material

Kaplan-Meier curve using both weeks and days as the time scale. Labels on x-axis identify time points of analysis. The grey-scaled area is the preconditioning period. Intensity denotes Sch-I, and volume denotes Sch-V.
Risk difference between Sch-I and Sch-V (reference group)
Compliance
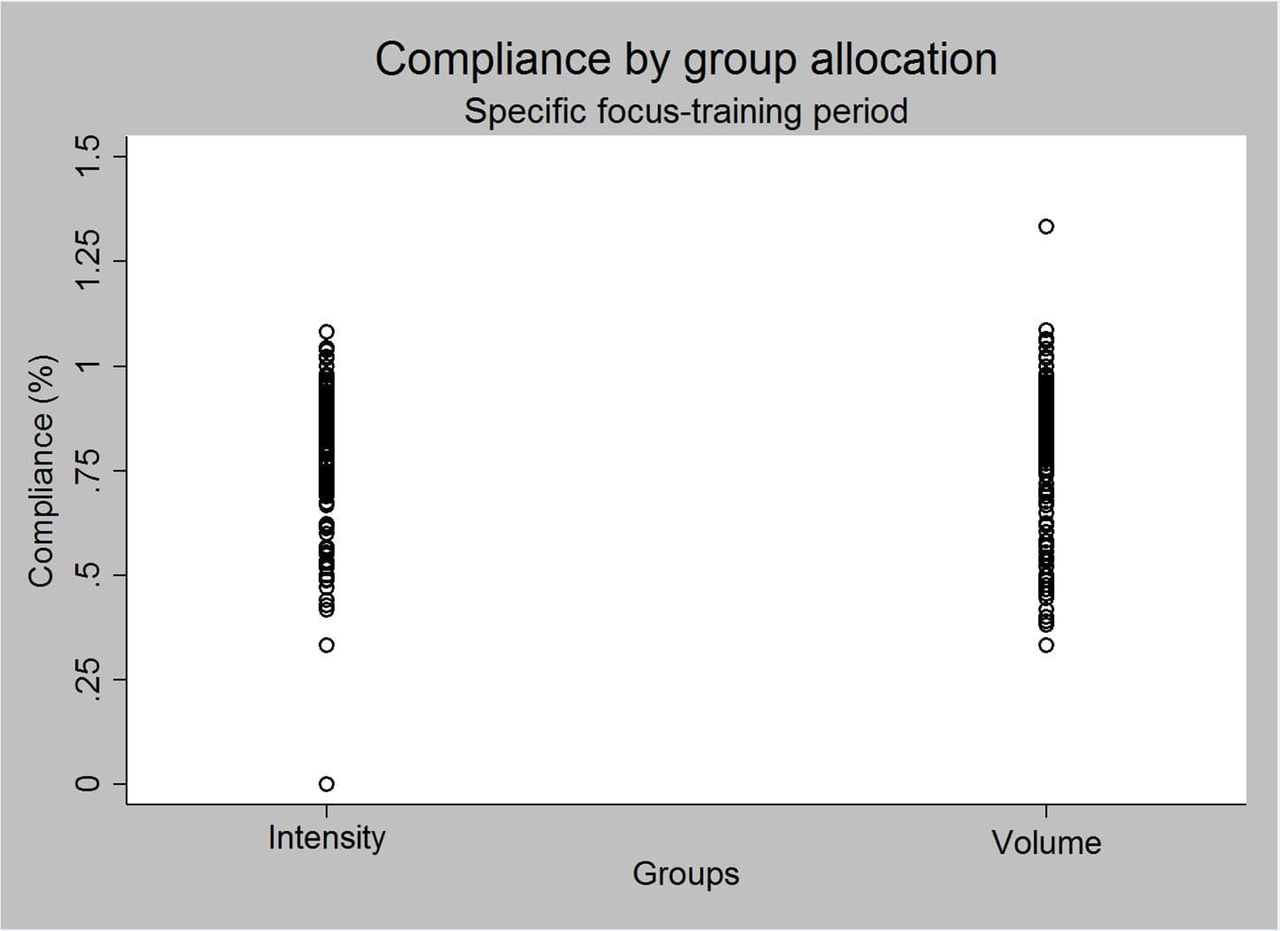
The participants in both groups, who were not censored during the preconditioning period, entered the specific focus training period with a mean compliance of 87% (±16) for Sch-I and 89% (±19) for Sch-V (table 1). The total scheduled number of running sessions during the preconditioning period was 24 sessions. Figure 3 displays compliance by group allocation during the specific focus training period. The mean compliance in Sch-I was 75% (±23) and in Sch-V 76% (±22). During the specific focus training period, the total scheduled running frequency was 48 sessions. An analysis of the risk difference between Sch-I and Sch-V based on different compliance groups is presented in the online supplementary material figure 4.
Distribution of percentage compliance during the intervention period for Sch-I and Sch-V. Compliance is quantified as percentage by calculating the total individual running frequency during the intervention period, divided by the total scheduled running frequency during the intervention period. 1 on the y-axis is equivalent to excellent compliance. Intensity denotes Sch-I, and volume denotes Sch-V.
Discussion
Run Clever is the first trial to compare the effect of two running schedules, specifically focusing on either progression in total volume of running or volume of running at a hard intensity, on injury among recreational runners using a GPS-based mobile application to quantify running and to provide real-time, individualised feedback to each participant during running. The results did not support the hypothesis that 15% more runners in Sch-I than in Sch-V would sustain an RRI. This indicates that despite an increase in the musculoskeletal load when running faster a relative progression in running intensity is not more injurious compared with a relative progression in running volume. Importantly, this should not convince coaches, clinicians and runners to conclude that the risk of injury in diverse intensity-based and volume-based programme always is similar. Changing the structure of one or more training variables (eg, number of sessions, weekly frequency, progression in intensity or volume) would most likely also change the susceptibility to injury across running schedules.
Changing the progression in intensity or volume from a percentage increase relative to the volume of intensity or total volume in the preceding week to a similar absolute increase in both schedules would probably deem another result. The choice of a relative progression might have influenced the stress–frequency relationship in Sch-I positively.12 Despite the higher musculoskeletal load experienced by runners in Sch-I, the relative progression also resulted in more recovery time between running sessions for the runners in Sch-I.12
Running intensity and running volume
Differently from previous cohort studies and randomised trials, Run Clever applied a structured running schedule accounting for all training variables. In both running schedules, an increased cumulative incidence proportion was observed during the 16-week specific focus training period. Because of the structured periodised content of Sch-I and Sch-V, with either a fixed running volume or a fixed volume of running intensity and similar frequency, associating the increased cumulative incidence proportion with the scheduled running intensity or running volume is plausible. Interestingly, the total increase in the volume of running intensity during the 16-week specific focus training period were 0.8 km. Many recreational runners would probably consider this as an increase of rather little importance in the scheduling of running. However, the cumulative incidence proportion in Sch-I of between 12.1% and 18.8% at week 16 should cause awareness. Similarly, the total increase in weekly running volume in Sch-V during the 16-week specific focus training period was 6 km, an increase most freely available online running schedules exceed. The cumulative incidence proportion of 25.5%–30.6% after 16 weeks is however also notable.
Sudden changes
Transitioning from preconditioning to the specific focus training period, more runners in Sch-I did sustain an RRI compared with runners in Sch-V. A conceivable reason for this increased risk in Sch-I could be sudden changes since sudden changes in training load have been associated with an increase in risk of injury.12 29 30 Applying a similar structure to both Sch-I and Sch-V, one of the training variables accounted for were the progression of running. Nevertheless, when transitioning to the specific focus training period, participants in Sch-I increased the relative intensity of all their scheduled weekly volume of running intensity. Specifically, they changed a weekly volume of 3 km at a moderate pace to 3 km at a hard pace, which could be assumed as a 100% progression in running intensity between 2 weeks, far exceeding what is considered reasonable.31
Compliance
The loss to follow-up of 47% in Sch-I and 46% in Sch-V during the preconditioning period was higher than expected and also exceeded losses to follow-up reported in similar trials applying schedules related to running participation.18 32 It was expected that the smartphone application, providing overview of scheduled running and feedback, would decrease the loss to follow-up and increase motivation and thereby compliance.33 34 However, recreational runners might already have experiences with one or more of the many commercially available smartphone applications and probably have preferences negatively influencing their incentive to continue participation.
Compliance during both preconditioning and the specific focus training period was higher compared with the proportionate compliance reported in the Gronorun by Buist et al.18 However, considering the population in Run Clever compared with that of Gronorun, this is not surprising. The runners included in Run Clever were recreational, with running experience and familiarity with regular running.35 Therefore, the relative lower compliance during the specific focus training period should be noticed. Reasons for this difference are speculative, but could be a simple product of the difference in length of follow-up or the increased demands in the scheduled running.
Non-compliance to interventions is not an unfamiliar challenge when conducting randomised trials in a real-world setting.36 Therefore, the IV analysis which considers non-compliance was chosen as the primary analysis and estimates derived from this analysis, provided an interpretational platform for the ITT and PP analyses.26
Limitations and future considerations
A self-administered maximal running test provided the basis for the estimation of VO2max and the derived running intensities (%VO2max). The limitation of using an estimated VO2max based on time and distance from a running test collected under free-living conditions should be recognised.37 Future considerations should include direct measurements of cardiovascular capacity at baseline for running intensity prescription or observation and establish validity of the regression equations developed by Daniels et al.38
Including a preconditioning period in the design is considered a strength in terms of homogeneity related to running performed most recently prior to beginning the scheduled running with a specific focus.13 However, the large proportion of included participants lost to follow-up during this period influenced the statistical power of the trial. Further, the randomisation was introduced prior to preconditioning and not prior to the 16-week intervention period, as stated in the protocol article.19 The loss to follow-up during preconditioning and the time point of randomisation have probably increased the presence of confounding to the random allocation at baseline, by introducing an imbalance in unmeasured covariates.39 40 Future considerations regarding the application of a preconditioning should include performing the randomised allocation of participants after completion of the preconditioning and consider compliance during the preconditioning period as an eligibility criteria.
Prevention of RRI is dependent on knowledge of injury aetiology.41 As concluded by Nielsen et al16 and stated by Hulme et al,15 the role of training variables in the aetiology of RRI is challenged by their complex interaction. Future research investigating specific training variables influence on risk of RRI should (i) organise variables within a causal framework,13 14 (ii) gather objective data on all training variables,42 43 (iii) account for the training variables interaction by either design or analysis14 44 and (iv) consider both absolute and relative measurements of training variables. Appropriate scheduled training load is key to recreational running with a minimum risk of RRI.31 Therefore, training variables need to be easy modifiable, not just in theory but also in practice, for universal prevention of RRI in runners to be successful.6 45
Conclusion
A similar proportion of runners sustained injuries in the two running schedules used in the RUN CLEVER trial
Acknowledgments
The authors wish to thank the team of physiotherapists who contributed to the examination of injured runners, Martin Elkjær from Help2Run for his assistance, all members of RUNSAFE who spend time talking to participants, the Danish Rheumatism Association for its contribution and all the recreational runners who participated.
References
Footnotes
Contributors All authors were involved in the drafting and revision of the manuscript and all authors approved the final version. All authors were involved in the design and conduction of the trial.
Funding DR was funded by Aarhus University, the Graduate School of Health. The Danish Rheumatism Association supported the study with a grant (grant number A3419).
Competing interests None declared.
Patient consent Obtained.
Ethics approval This trial was approved by the ethics committee Northern Denmark Region, and the Danish Data Protection Agency approved the trial (N-20140069).
Provenance and peer review Not commissioned; internally peer reviewed.
Data sharing statement No additional data are available.