Article Text

Abstract
Objective The purpose of this study was to define a new index the Robust Exponential Decreasing Index (REDI), which is capable of an improved analysis of the cumulative workload. This allows for precise control of the decreasing influence of load over time. Additionally, REDI is robust to missing data that are frequently present in sport.
Methods 200 cumulative workloads were simulated in two ways (Gaussian and uniform distributions) to test the robustness and flexibility of the REDI, as compared with classical methods (acute:chronic workload ratio and exponentially weighted moving average). Theoretical properties have been highlighted especially around the decreasing parameter.
Results The REDI allows practitioners to consistently monitor load with missing data as it remains consistent even when a significant portion of the dataset is absent. Adjusting the decreasing parameter allows practitioners to choose the weight given to each daily workload.
Discussion Computation of cumulative workload is not easy due to many factors (weekends, international training sessions, national selections and injuries). Several practical and theoretical drawbacks of the existing indices are discussed in the paper, especially in the context of missing data; the REDI aims to settle some of them. The decreasing parameter may be modified according to the studied sport. Further research should focus on methodology around setting this parameter.
Conclusion The robust and adaptable nature of the REDI is a credible alternative for computing a cumulative workload with decreasing weight over time.
- training load
- cumulated workload
- missing data
- index
- monitoring
Data availability statement
All data relevant to the study are included in the article or uploaded as supplementary information.
This is an open access article distributed in accordance with the Creative Commons Attribution Non Commercial (CC BY-NC 4.0) license, which permits others to distribute, remix, adapt, build upon this work non-commercially, and license their derivative works on different terms, provided the original work is properly cited, appropriate credit is given, any changes made indicated, and the use is non-commercial. See: http://creativecommons.org/licenses/by-nc/4.0/.
Statistics from Altmetric.com
What are the new findings?
It is sometimes difficult to obtain regular long-term monitoring data. Training camps, injuries and time-off periods may prevent close follow-up.
When longitudinal sports data are missing, a new method improves existing indices for monitoring load or fatigue.
The Robust Exponential Decreasing Index takes into account the decreasing effect of the past training; it remains meaningful even in the presence of many missing data points.
It is flexible for all situations by adjusting a specific coefficient for each discipline.
Introduction
Premises of workload analysis
One of the fundamental reasons that athletes are monitored is to measure their progress in response to their training.1 2 Individual responses to training stress may vary,3 4 and an appropriate follow-up method could aid in identifying these.5 The monitoring of training also plays an important role in injury prevention.6 In particular, previous research has often focused on the relationship between training load and injury risk.7–10
Banister11 was one of the first people to introduce the notions of fitness and fatigue that correspond to the positive and negative adaptations from training. The largest difference between these adaptations is obtained when athletes reach their highest performance level, that is, when the negative consequences of their training (injury, illness, fatigue and over-reaching) are limited and the positive ones are optimised.12
Foster proposed the rating of perceived exertion (RPE) session assessment, an index that can be adapted to a large number of activities.12–14 The training load is subjectively measured through the RPE in order to relatively quantify the burden imposed on athletes. This index can be computed by multiplying the perceived intensity of the training session by its duration.15 Correlations between RPE and other intensity measurements, such as heart rate (r=0.89) or plasma lactate concentration (r=0.86), were demonstrated.16 Several other methods have been proposed to quantify workload: the work endurance recovery takes into account objective and subjective parameters17 18 and estimates the level of fatigue induced by exercise using a cumulative work:endurance limit ratio associated with the natural logarithm of the work:recovery ratio.
Acute:chronic workload ratio (ACWR) and its limitations
More recently, Gabbett19 has updated the ratio proposed by Allen and Coggan.20 They suggested comparing the current week of training to the previous four. The aim of their ratio was to ensure that the workload was kept within a ‘high-load, low-risk’ range of values. When the ratio (last week/previous four) was too low (<0.8) or too high (≥1.5), the risk of subsequent muscular and non-contact injury was shown to initially increase.19
The ACWR is based on specific sport and injury data.21–25 However, many criticisms have emerged concerning both the structure of the ratio and its interpretations. Despite some beliefs about training load, injury and performance that ACWR and its derivative have generated, some methodological issues appear.24 The first problem is the requirement to wait 4 weeks before any ratio can be computed. Second, each time missing data appear in the collecting process, it leads to spurious values in the ratio until another 4-week period allows for stabilisation. This type of problem can be addressed with imputation methods,26 but it complicates the procedure.
Menaspà's paper, although presented in an editorial format (ie, the lowest level of evidence), puts forward another limit of the ACWR.27 First, the averaging of the 4 weeks does not allow for variations within a given period and can only show the general trends in the training load while masking potential peaks and troughs in the load. For example, different workload levels (chronic and acute) can lead to identical ratios. Moreover, computing the average load does not take into account stimuli that may occur in the meantime, such as, the effect of a training intensity peak that decreases over time.28 The chronic load calculated with a moving average gives as much weight to a training session performed the day before as to one that took place 4 weeks before.
On top of the aforementioned limitations, Lolli et al 29 highlighted the problem of dependence between acute and chronic loads: when calculating the ACWR, the acute load also constitutes a substantial part of the chronic one. This inadequate mathematical coupling between the two variables,30 also called ‘connecting a part to the whole’,31 raises the possibility that athlete monitoring may be compromised by spurious correlations. The proposed solution has been to exclude acute periods in the calculation of chronic load.29 However, this is an opinion piece, in that the strength of this paper remains limited.
More recently Gabbett et al 32 have shown in elite cricket fast bowlers that the use of coupled and uncoupled ACWRs produces the same injury likelihoods. Although findings do not imply that injuries can be predicted from a single training variable, no evidence was found of the rejection of ACWRs coupled in a real practical context.32
ACWR is a useful method to analyse training load. However, like all tools, it has its limitations, which we have tried to address through our theoretical study.33
Exponentially weighted moving average (EWMA) and its limitation
Williams et al 34 proposed EWMA to calculate a load ratio. Authors shared concerns regarding the use of moving averages to compute ‘acute’ and ‘chronic’ loads in the ACWR as these measurements do not account for the declining nature of fitness and fatigue effects over time, nor do they accurately represent variations about how loads cumulate.
The EWMA35 alleviates some of these problems by assigning a decreasing weight to older load values. Specifically, the EWMA for a given day is calculated by

where  is a value between 0 and 1 that represents the level of workload decrease. It is defined as

where N represents the selected time constant of the decrease, generally 7 and 28 days, respectively, for acute and chronic loads. The time frames of 1 and 4 weeks are frequently used in the periodisation strategies used by many team sports, although other time constants may be more appropriate in different contexts.
A first limitation of the EWMA lies in the complexity of this recursive equation, which may complicate the interpretation, implementation and computation of the coefficients. Moreover, the way each workload is weighted only depends on the number (N) of days considered in the calculation.
In terms of a long-term follow-up, the EWMA weight coefficients of loads tend to be equivalent to the ACWR and very small (eg, with 100 days, the most recent load accounts for just 2/101 of the total average). Thus, in this context, the EWMA value merely approximates the unweighted average load over N days and decreases the importance of recent workloads in favour of historical cumulated ones.
Therefore, EWMA is more consistent and accurate than the ACWR with a small value for N and a rolling average. However, in this context, both the EWMA and ACWR become very sensitive to missing data and need a period of initialisation that cannot be computed.
On the other hand, the impact of acute load differs greatly according to various sports disciplines. Currently, none of the presented methods provide a parameter able to adjust the decreasing influence of load, depending on sport context.
Using what has already been proposed in the literature and taking into account the different limitations outlined earlier, the purpose of this study was to propose a new way to compute cumulative training loads.
Methods
Robust Exponential Decreasing Index (REDI)
We designed the REDI, a new measurement of cumulated workload, adapted to each sport’s specificities, and allows us to address the issue of missing data. It is defined as

where:
 is the workload of the past
day before the current day.
is the workload of the past
day before the current day.N is the total number of previous days before in our dataset.
λ is a parameter that can be adjusted in order to decrease the weighting.


The main concept of this index is to introduce an explicit exponential weight that multiplies each workload. All of the weighted workloads are added together and subsequently divided by the sums of the weights in order to normalise the index. In this sense, the index is defined as a weighted mean of the workloads.
In our model, the values of the weights decrease as one moves away from the current day (as the value of
i
increases). Moreover, this weight equals 0 when the workload value is missing. This allows consideration of all days instead of ignoring some. However, even if the value of  is missing, the coefficient
  continues to decrease each day. Therefore, the weight uniformly depends on the past, and the REDI is not sensitive to missing values. It is important to note that the weight equals 1 for the current day and decreases to values close to 0. Although this decrease remains exponential, the rate can be controlled by changing the value of parameter λ. The index can therefore be adapted to a wide range of sports by adjusting how much the past workloads are considered.
One advantage of this index is that the coefficients are completely explicit and easily computable for each past workload, through the definition of  . Because of its weighted mean structure, the REDI remains meaningful, using the same unit that was used to measure the original workload. Moreover, it can be computed from day 1; it does not need any initialisation period and does not suffer from the problem of missing data. In addition, it can use all past available information. The decreasing weights of the past workloads can be computed on a potentially infinite number of previous days (since the exponential function is defined on the interval
  , +
∞
]).
, +
∞
]).
Method comparison using simulated data
The ACWR, EWMA and REDI were studied and compared in different situations with simulated datasets. These simulated data were monitored, throughout a full season, using the same methods that would be implemented for real data, with features that assess workload over time.
In the first situation, 200 consecutive workload values were drawn from a Gaussian distribution N(500 100). This represents rather stable loads with slight perturbations. The second dataset is composed of 200 consecutive workload values, drawn from a uniform distribution U([0,1000]). This situation depicts unstable loads that potentially change sharply over time. These datasets were used to enlighten several properties and behaviours of the different indices according to the context.
In both cases, a portion of the load values (5%, 30% and 50%) were randomly removed in order to simulate the issue of missing data. In this context, errors exist that differentiate the true values—values that result from the indices computed on complete datasets—from those that result from incomplete ones. In order to compare these errors, numerically as well as graphically, the percentage of relative difference was defined as such:

The three methods (ACWR, EWMA and REDI) were applied on the eight series (0%, 5%, 30%, and 50% missing data for both the N(500 100) and U([0,1000] datasets), providing a fictional follow-up of 200 time instants in the different situations described previously.
Results
Comparison of index of dataset
REDI consistency
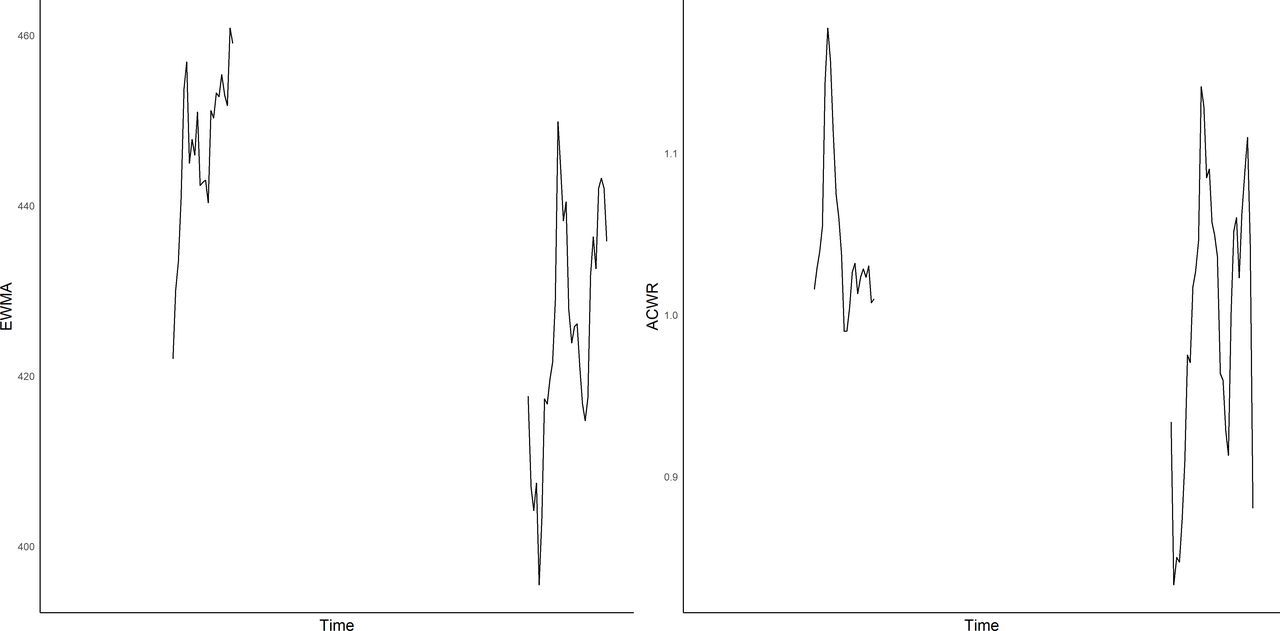
EWMA and ACWR could not be computed with 30% missing data, as it was impossible to build the indices due to the requirement of 28 consecutive days of load to compute an unbiased index (figure 1).

The value of the EWMA (on the left) and ACWR (on the right) over 200 instant time period on a dataset with 5% missing load. ACWR, acute:chronic workload ratio; EWMA, exponentially weighted moving average.
Figure 2 exhibits the robustness of the REDI that can be built even in the presence of missing data. In addition, curves with 5% and 30% missing data fit all data curve quite closely, while the 50% one shows a high variability. The same trend can be observed with both Gaussian data (left) and uniformly distributed data (right). Curves may superimpose when a complete curve of REDI exactly equals the curve of missing data.
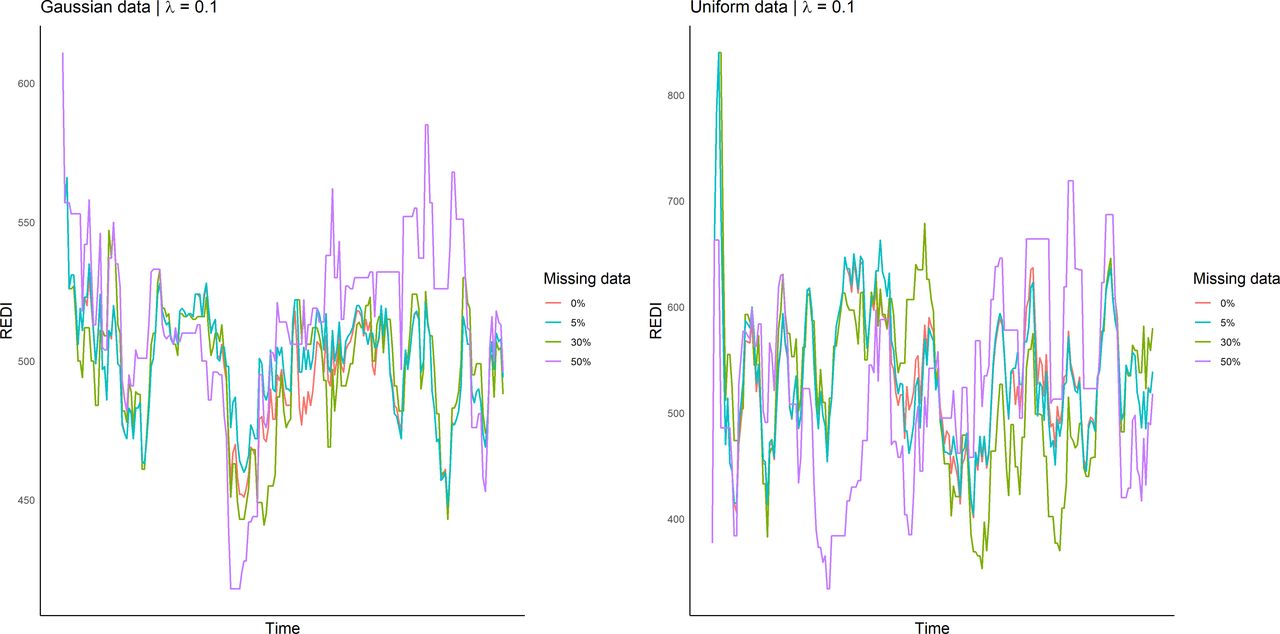
Comparison of REDI on a series of 200 consecutive workload values (simulated data according to a Gaussian distribution) with 0%, 5%, 30% and 50% missing data (left). Same comparison on a series of uniformly distributed loads (right). REDI, Robust Exponential Decreasing Index.
In order to test the consistency of the results in figure 2, comparison between the complete and incomplete datasets was simulated 100 times.
Table 1 shows the average error of REDI between workloads with 5%, 15%, 30% and 50% missing data compared with the complete dataset (all data). The mean and the SD increase with the amount of missing data, both for Gaussian data and for uniform data. In the Gaussian context, workloads are gathered around a central value, remain stable and thus lead to lower error. In the uniform case, values are scattered and yield to larger errors and variability.
Mean relative errors between REDI values from datasets with missing values, as compared with the complete one
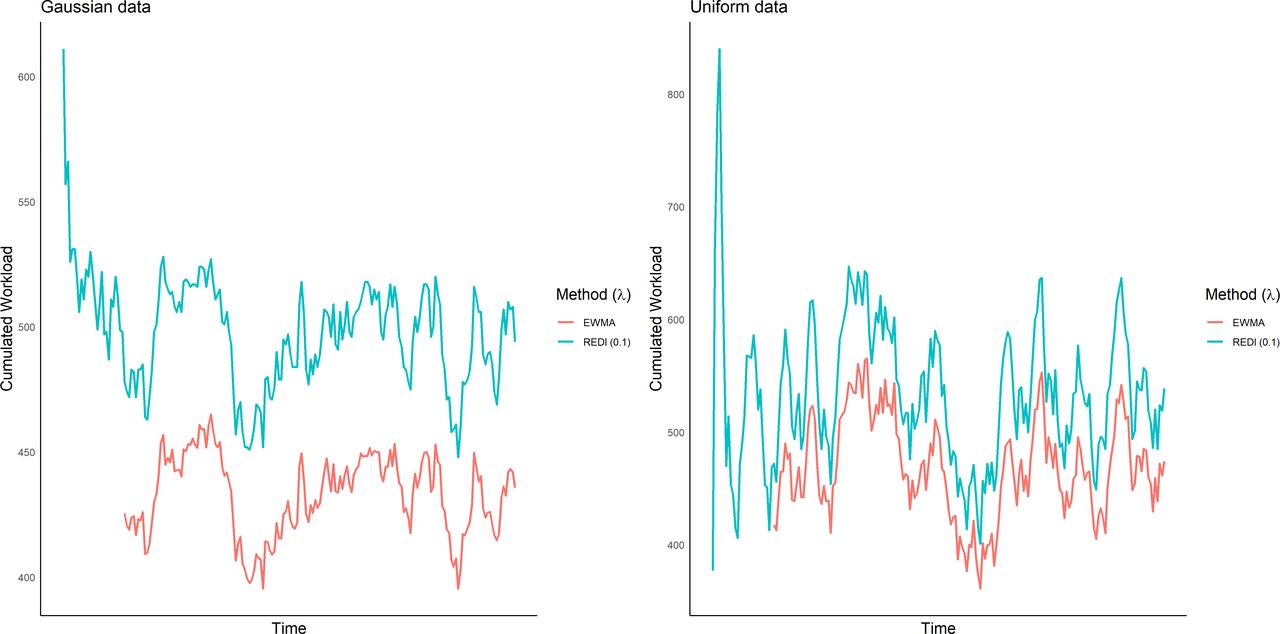
For both distributions, the REDI curve precisely follows the trend of the EWMA curve (with a 0.65% mean error). In addition, REDI starts earlier than EWMA since it does not need the initial follow-up period for the index to be built (figure 3).
Comparison between REDI (λ=0.1) and EWMA on a series of 200 consecutive workload values of simulated Gaussian data (left). Comparison between REDI and EWMA on a series of 200 uniformly distributed loads (right). EWMA, exponentially weighted moving average; REDI, Robust Exponential Decreasing Index.
These simulated data were defined with a mean value of 500. In this case, the REDI better reflects the nature of the data than the EWMA; it dependably produces values around 500, while the EWMA sits slightly lower at about 425 on average. Due to its definition, EWMA consistently underestimates the cumulative load. The REDI behaves similarly to the EWMA, only for the particular case when λ=0.1.
Weighting the past through λ
Table 2 expresses the value of the past workload decay, depending on the number of days, for each value of λ. As the λ value decreases, the weight given to the next day increases. For example, for a λ fixed at 1, at the third day, only 5% of the chronic workload impacts the REDI coefficient, whereas with a λ of 0.05 at 14 days, the impact of the past load weight is 50% in the REDI calculation.
Different values of the λ coefficient in the function of the decreasing impact of chronic workload by time windows
Discussion
This study provides a new training load index including three improvements. First, the REDI is more robust to missing data than either the ACWR or EWMA as it can handle datasets with missing data, preserving the global tendency of the cumulated workload. Second, the REDI allows for better control of the decreasing influence of load over time, through a coefficient that can be computed according to the sport, the disciplines or the event. Third, the REDI can be calculated starting as soon as the second time point within a consecutive series.
Issues in long-term load follow-up
From a sporting point of view, the contributions of this work allow for some flexibility when it comes to the collection of data, which is a well-known difficulty in the monitoring of athletes, especially for those at high level. The REDI can facilitate load monitoring throughout the year, whereas the EWMA and ACWRs (which are usually computed over 28 days) lead to biases when missing workload values are not considered. The REDI is capable of considering periods of limited data, such as career duties, international breaks or the lack of monitoring during the off-season,36 without a major effect on the index computation. Even in the worst-case scenario put forward in Buchheit’s editorial,36 the REDI model is capable of stable monitoring.
The use of the REDI avoids the necessity to simulate or ignore the data that are missing in a monitoring context. This adaptive index stabilises the acute and chronic load variables. It is more robust and usable for contextualising the performance, injuries and readiness of athletes. To determine what percentage of missing data are acceptable, REDI users can refer to table 2 for information about error rates.
Adapting the cumulative load index to the sports field
The choice of an exponential is explained by its flexible nature. Moreover, the exponential reflects the laws of the body. In physiology, the phenomena of fatigue and overcompensation after an effort are exponentially expressed. One can also control the decay intensity of the exponential through a single parameter, λ.
As an example choice for practitioners, we proposed 10 values of λ for five time windows (3, 7, 14, 21 and 28 days) to illustrate the influence of λ on the decreasing weights assigned to each load. This choice was inspired by what was previously documented in the literature,19 37 namely, a weekly cutting of the load. It should be noted that REDI does not aim to offer a new perspective about workload but merely a more appropriate way to compute the cumulative workload.
A λ value close to 0 provides a very slow decay to the weight of the past training load. In other words, the closer the coefficient λ is to 0, the greater the former load impact. The oldest training loads have as much weight as the most recent ones. Conversely, with an increasing λ value, the weight of the oldest loads is neglected. In other words, recent workload have a much higher impact.
The λ values in this work are only proposed as an example. At this point, one cannot state with certainty which λ should be used for each situation since its optimal value probably depends on discipline. Deciding on the appropriate value must take into account the characteristics of the discipline, as well as the specific influence of the load. We emphasise that this parameter should be tuned using experts’ knowledge and/or statistical optimisation from data to suit the context at best.
In order to choose an appropriate and meaningful λ, several objective methods could be used. For example, λ could be optimised according to a criterion (eg, likelihood maximisation) or via cross-validation. It could also be optimised in order to connect workload to several features (injury7 38 and performance14 39–41). The only obstacle that remains, in order to link the workload to the different parameters, will be to find the right λ adapted to the study context.
The REDI offers the possibility to manage the λ coefficient for a specific decreasing weight load according to sport, even by position or athlete physiology.
Limits of the REDI
The present paper offers a theoretical study of a new index that can be implemented with simplicity and adaptability. Although REDI’s properties seem promising, the index must now prove its ability to link variables of interest, such as fatigue or injury, like the ACWR. Moreover, while the λ coefficient provides flexibility by decreasing the importance of the load over time and we are able to provide insights on its influence, it is a new parameter that must be justified with experimental data. Future studies, with real-world data, are needed to test the full potential of REDI and to prove its efficacy in practice.
Conclusion
The REDI is a cumulative load analysis tool. It is both robust to missing data and flexible according to the discipline. The robustness of REDI has been demonstrated by its ability to analyse datasets with missing data while preserving the main trend. It is therefore consistent when periods without data (injury, international duties and off-season) are numerous. Moreover, its single control parameter, λ, allows the practitioner to control for the decreasing impact of past training loads. Finally, the REDI can be computed after only 2 days of monitoring and is adaptable by sport, position or level of performance.
Data availability statement
All data relevant to the study are included in the article or uploaded as supplementary information.
Ethics statements
Acknowledgments
We deeply thank Stephanie Duncombe for her proofreading and advice in English.
References
Footnotes
Contributors IM, AL, GS and AS were involved in the design. AL, JS and IM simulated the data. AL refined the model. IM, AL, JS and GS interpreted the results. IM, AL, JS, JFT and AS contributed to the writing and revision of the manuscript. JFT and AS managed the conduction of the research. All authors read and approved the final manuscript.
Funding The authors have not declared a specific grant for this research from any funding agency in the public, commercial or not-for-profit sectors.
Competing interests None declared.
Provenance and peer review Not commissioned; externally peer reviewed.