Article Text

Abstract
Aim Insufficient research examines the treatment effectiveness of real-world physical activity (PA) interventions.
Purpose We investigated the effects of 3 interventions on directly measured cardiovascular variables. All treatments and measures were administered in community settings by fitness centre staff.
Methods Participants were sedentary individuals receiving no medication to reduce cardiovascular disease (CVD) risk (n=369, age 43 ±5 years). In a semirandomised design, participants were allocated to a structured gym exercise programme (STRUC), unstructured gym exercise (FREE), physical activity counselling (PAC) or a measurement-only control condition (CONT). Measures were: predicted aerobic capacity (VO2: mL kg min), mean arterial blood pressure (MAP: mm Hg) and total cholesterol (TC: mmol/L), and were taken at baseline and 48 weeks.
Results Data analysis indicated a statistically significant deterioration in TC in CONT (0.8%, SD=0.5, p=0.005), and a statistically significant improvement in MAP in STRUC (2.5%, SD=8.3, p=0.004). Following a median split by baseline VO2, paired-sample t tests indicated significant improvements in VO2 among low-fit participants in STRUC (3.5%, SD=4.8, p=0.003), PAC (3.3%, SD=7.7, p=0.050) and FREE (2.6%, SD=4.8, p=0.006), and significant deterioration of VO2 among high-fit participants in FREE (−2.0%, SD=5.6, p=0.037), and PAC (−3.2%, SD=6.4, p=0.031).
Conclusions Several forms of PA may offset increased cholesterol resulting from inactivity. Structured PA (exercise) might be more effective than either unstructured PA or counselling in improving blood pressure, and community-based PA interventions might be more effective in improving VO2 among low-fit than among high-fit participants.
- Aerobic fitness
- Strength isometric isokinetic
- Community
- Risk factor
This is an Open Access article distributed in accordance with the Creative Commons Attribution Non Commercial (CC BY-NC 4.0) license, which permits others to distribute, remix, adapt, build upon this work non-commercially, and license their derivative works on different terms, provided the original work is properly cited and the use is non-commercial. See: http://creativecommons.org/licenses/by-nc/4.0/
Statistics from Altmetric.com
What are the new findings?
Among low-fit individuals, physical activity counselling (PAC) was as effective as both structured and unstructured gym-based exercise in improving VO2 over 48 weeks.
Among high-fit individuals, a significant deterioration in VO2 was observed in response to both unstructured exercise and PAC over 48 weeks.
Structured exercise, unstructured exercise and PAC all offset significant increases in total cholesterol observed in controls over 48 weeks.
Structured exercise was significantly more effective than either unstructured exercise or PAC in reducing mean arterial blood pressure over 48 weeks.
Introduction
Physical activity (PA) has been proposed as a low-cost and highly effective intervention for cardiovascular disease (CVD). A substantial number of controlled studies attest to the mechanisms, safety and efficacy of PA in this context.1–6 Increasing PA has, therefore, become an important public health issue worldwide.7 ,8
However, recent reports have highlighted the lack of evidence for the effectiveness of real-world PA interventions. For example, the 2014 UK Government All Party Commission on Physical Activity9 stated that it is currently almost impossible to tell which interventions have been successful and which have failed. Likewise, the 2014 Public Health England report, Identifying What Works for Local Physical Inactivity Interventions10 identified that, when evaluated against stringent Nesta standards for evidence,11 not one of almost 1000 exercise interventions met level 5 (ie, consistent replication and positive impact), with <1% meeting Nesta level 3 (ie, demonstration of causality).
It is often assumed that the failure of PA interventions to impact in the real world is the result of low adoption and adherence. A substantial body of research has, therefore, investigated the behavioural or implementation effectiveness of PA or exercise interventions. For example, a meta-analysis of exercise referral programmes in the UK reported mean adherence of 49% in randomised controlled trials (n=6), and of 43% in observational studies (n=16).12 Such apparently low adherence rates contrast starkly with data from laboratory research, for example, 97%,13 94%14 and 84%,15 and controlled community studies of exercise, for example 94%,16 93%17 and 84%.18 This supports the idea that, in relation to PA and exercise, the main difference between laboratory and field settings is adherence rates.
However, low adherence to PA is not necessarily problematic. An intervention with adherence below 50% can be effective if a sufficient percentage of those adherers benefit from participation. WHO estimates long-term compliance to drugs as around 50%,19 with many of those drugs concerned considered effective. However, while drug effects are routinely monitored, policymakers are often unable to evaluate the outcomes of PA interventions on directly measured health variables, their clinical or treatment effectiveness. Even among the studies that have reported the outcomes of PA intervention, there are methodological issues. Such studies are often characterised by non-clinical metrics, poor external validity, and by laboratory-style interventions that are not viable in real-world settings.20
The translation of laboratory findings into practice is a great challenge.21 ,22 Further community-based intervention studies conducted on relevant participant groups are warranted. Arguably, to inform policy and practice, such trials should replicate real-world delivery, first, in terms of how they are communicated, delivered and managed by exercise professionals, and second, in terms of how they are accessed and experienced by patients.23 Data to emerge from studies adopting such designs has substantial relevance to public health policy and practice.24
We report the findings of a 48-week study across multiple community fitness centres in the UK. Importantly, in the translation of laboratory findings into real-world settings, all interventions and measures were conducted by staff of the fitness centres involved within existing operational protocols and budgets, and not by researchers. A subgoal of the study was to encourage community centres to embrace routine measurement of health-related variables and to better understand the role of evidence in the design and delivery of PA services. Given the evidence presented in the Public Health England ‘What works for local physical inactivity interventions’ report,10 and the extremely poor classification of interventions via Nesta standards for evidence,11 we consider this to be a potentially significant method by which to promote best practice in the delivery and reporting of PA and exercise interventions.
Method
Recruitment
Operators of community health centres in the UK were invited to apply to participate in the study. Two exercise professionals per centre (n=54) were trained in a 2-day project-specific course delivered by the first author. Each centre was tasked with recruiting 80 sedentary participants. To maintain the external validity of the study, the centres were informed that no recruitment incentives were to be offered.25
Participants
Participants (n=369, age 43±5 years) were currently not regularly exercising or meeting the PA recommendations of the UK Chief Medical Officer, and were taking no medication that might impact cardiovascular risk. Participants received a detailed explanation of the study and provided written informed consent. The study design was approved by the Research Ethics Committee of the lead author's institution.
Procedure
In a semirandomised design, participants were offered one of two intervention pathways. Those choosing the fitness centre pathway were randomised to a structured exercise programme (STRUC) or free/unstructured exercise (FREE). Those choosing a non-fitness centre pathway were randomised to physical activity counselling (PAC), or to a measurement-only control condition (CONT). Interventions were delivered over 48 weeks with measures at 0 (baseline) and 48 weeks.
Interventions: STRUC had access to all fitness centre facilities and received individualised cardiovascular and resistance exercise programme (tables 1 and 2). This programme was based on guidelines published by the American College of Sports Medicine.26 The intensity of cardiorespiratory training was based on baseline VO2 values.27 Resistance training intensity was based on calculations of one-repetition maximum, again derived from baseline data. Exercise professionals met STRUC participants once a month to discuss their progress.
Aerobic training programme for structured gym exercise programme participants
Resistance training programme for structured gym exercise programme participants
FREE participants had access to all fitness centre facilities but received no structured programme. Exercise professionals met with FREE participants once each month to discuss progress.
PAC participants met exercise professionals once each month for counselling sessions structured around the model proposed by Haase et al,28 and delivered within the fitness centre. PAC participants did not, however, have access to any fitness centre exercise facilities.
CONT participants did not receive an intervention and did not have access to any fitness centre exercise facilities. Exercise professionals were instructed to have no contact with CONT participants other than to arrange data collection at 0 and 48 weeks. While CONT did not receive an exercise intervention, they did receive two free health screens over the duration of the study.
Measures
The primary outcome measure was predicted maximal aerobic capacity (VO2max), which correlates highly with risk of CVD.29 VO2max was predicted using the Modified Balke Protocol.30 ,31 Participants walked on a treadmill at between 3.6 and 5.6 kph, depending on ability, for 3 min. Following this, the gradient was increased by 1% each minute. Ratings of perceived exertions were recorded at 1 min intervals using the OMNI1–10 scale.30 Oxygen consumption and heart rate were continuously monitored via direct gaseous analysis (Fitmate Pro, COSMED, Italy).32 ,33 Predicted VO2max was automatically extrapolated using the relationship with heart rate.34 The test was terminated when participants indicated perceived exertion above six (hard) and/or their heart rate reached 150 bpm.
We also measured mean arterial pressure (MAP), which describes the average arterial pressure during a single cardiac cycle, incorporating both systolic and diastolic phases, but weighted towards the diastolic. Systolic (SBP) and diastolic (DBP) blood pressures (mm Hg) were measured using a commercially available blood pressure monitor (Omron Healthcare, Japan). Three readings were collected and the mean value reported. MAP was estimated via the calculation MAP=DBP+0.33(SBP−DBP).
Last, we measured total cholesterol (TC: the sum of low-density lipoprotein (LDL) and high-density lipoprotein (HDL) cholesterol). We measured TC (mmol/L) via finger-prick blood analysis (Cholestech LDX, Alere, UK).
All data were analysed in accordance with intention-to-treat analysis. Therefore, no consideration was given to the volume of activity completed or counselling sessions attended, and no participants were excluded.
Data analysis
Percentage change in dependent variables between baseline and 48 weeks in each treatment were compared using one-way analysis of variance (ANOVA). Changes in each dependent variable between baseline and 48 weeks were analysed using paired-sample t tests. Following a median split by baseline VO2, further paired-samples t tests assessed changes in dependent variables for both low and high VO2 groups, and two-way ANOVA assessed interaction between treatment and baseline VO2.
Results
Adoption and retention to study
A total of 1146 participants were recruited against a target of 2080, an adoption rate of 55%. At 48 weeks, a total of 369 participants reported for data collection, a retention rate of 32%. No significant differences in retention were observed between intervention groups (p=0.31).
Directly measured cardiovascular variables
Descriptive statistics for VO2, MAP and TC pretreatment and post-treatment across all four treatments are presented in table 3.
Descriptive statistics for VO2, MAP and TC at baseline
Results of a one-way ANOVA, assessing differences in percentage change from baseline to 48 weeks between treatments for all three measures are presented in table 4. No statistically significant between-treatment differences were observed.
One-way ANOVA comparing prepercentage and postpercentage change in VO2, MAP and TC
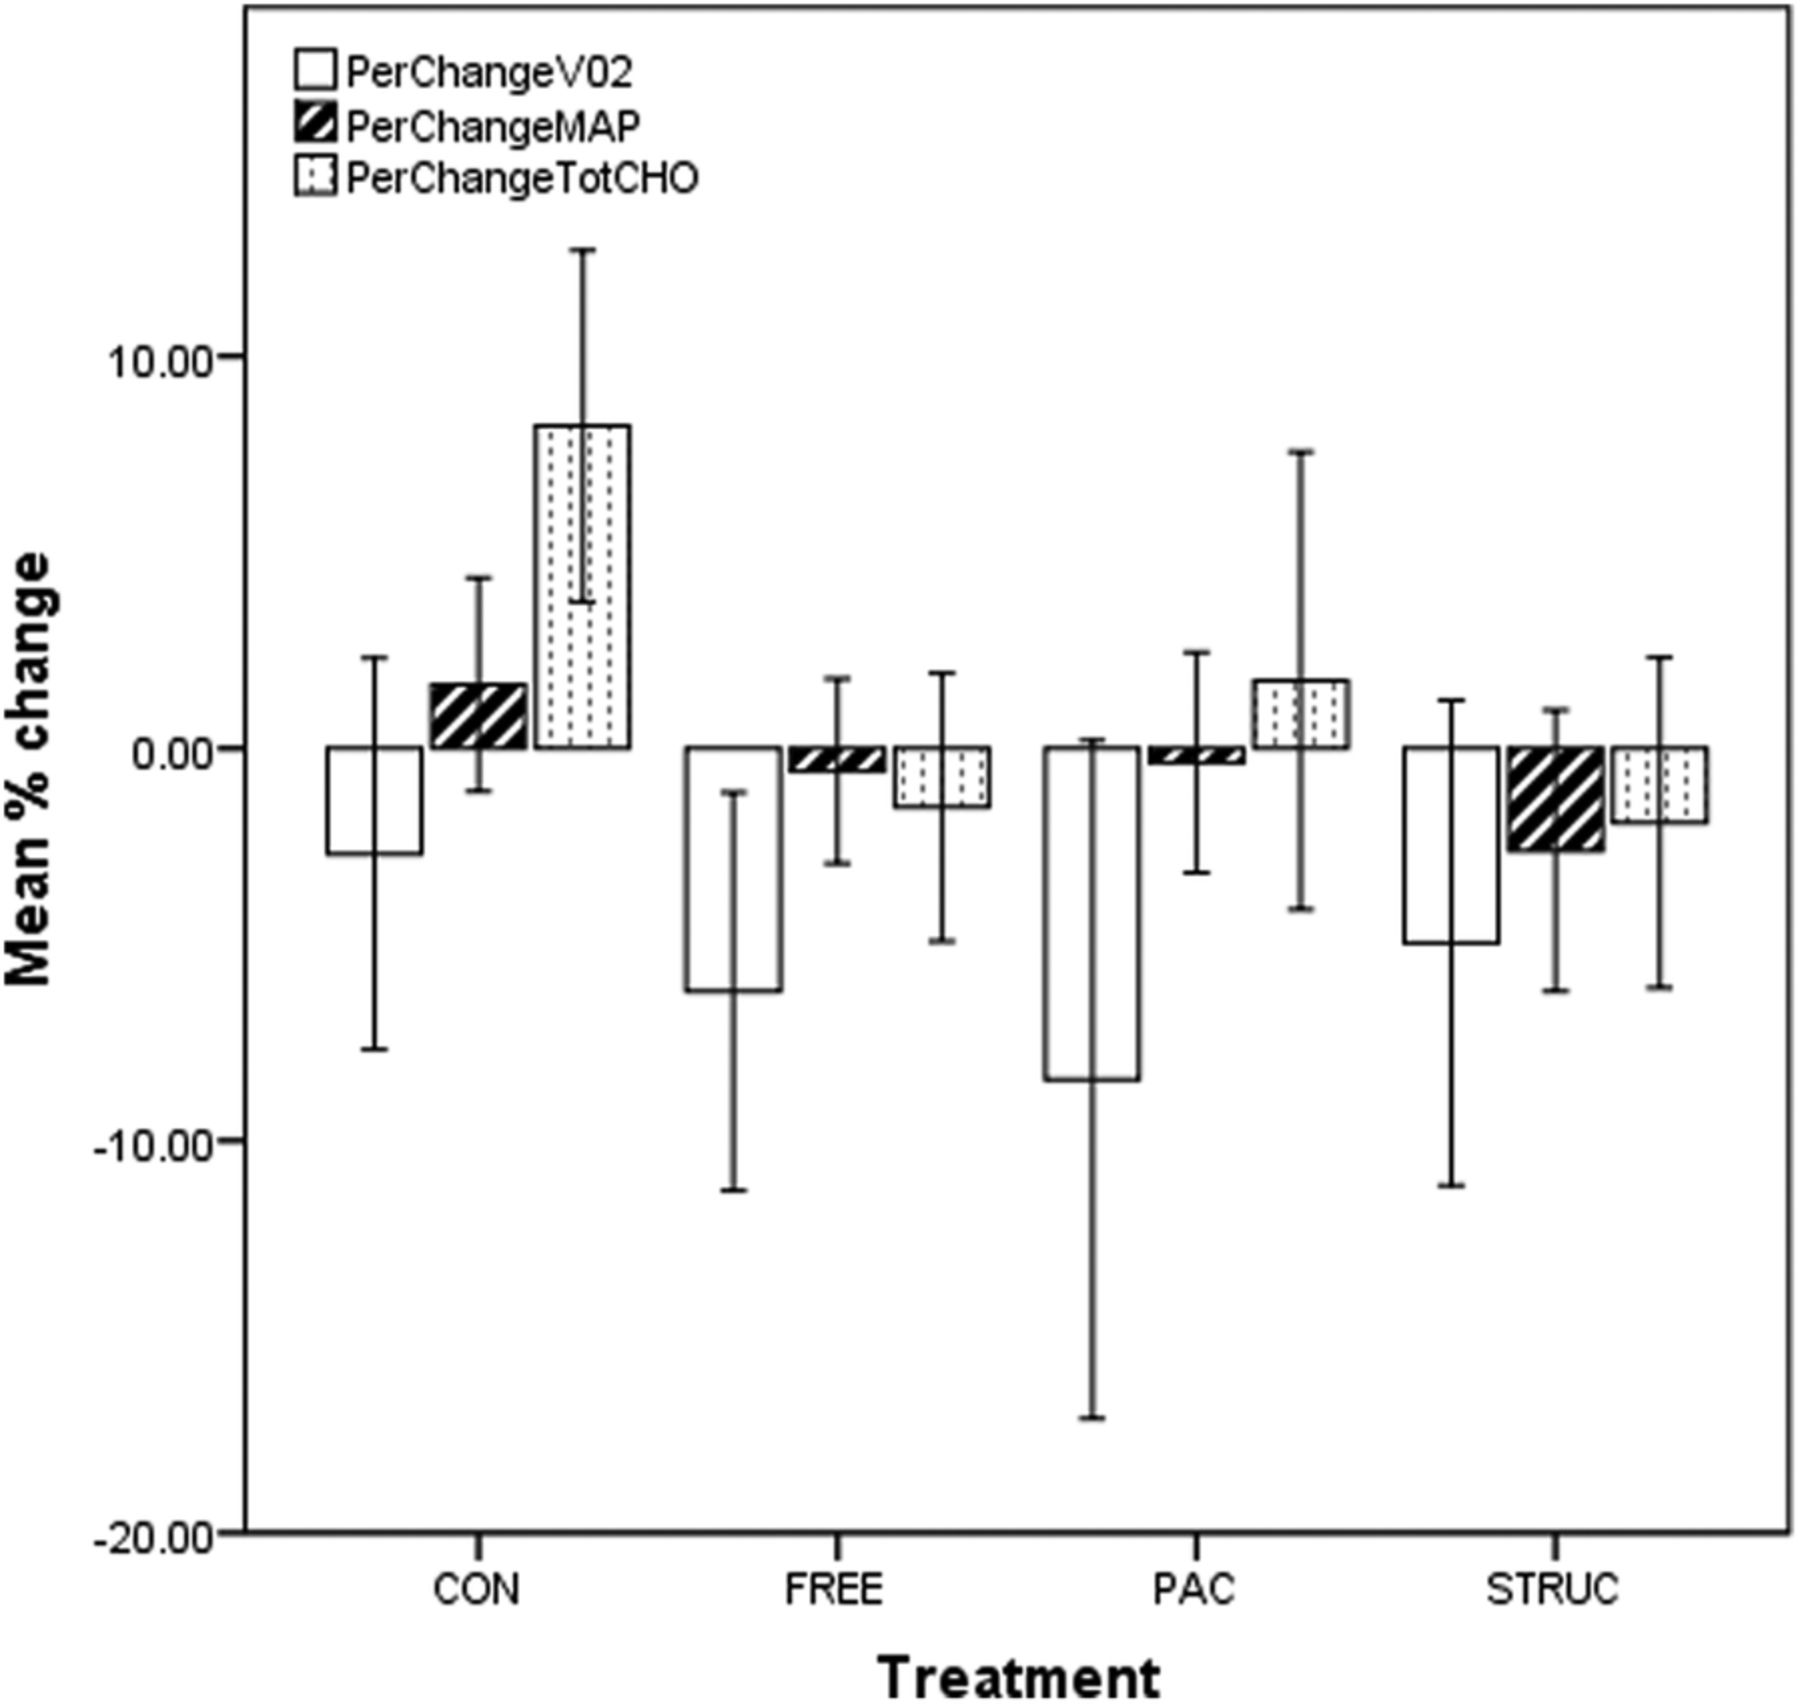
Results of paired-samples t tests comparing absolute change in measures from baseline to 48 weeks are presented in table 5. The SD around effects was often substantial. No significant effects were observed in VO2. A small but statistically significant increase in TC was observed in CONT (m=0.8%, SD=0.5, p=0.005), while TC was marginally increased, compared to baseline, in PAC and FREE, and reduced, albeit not significantly, in STRUC. A statistically significant decrease in MAP was observed in STRUC (m=2.5%, SD=8.3, p=0.004), while MAP was also reduced, although not significantly, in all other treatments including CONT. Figure 1 presents findings for all treatment groups and measures.
Paired-samples t test comparing absolute values for VO2, MAP and TC at baseline, and 48 weeks for each treatment

Prepercentage and postpercentage change in VO2, MAP and TC for all treatment groups. CONT, control condition; FREE, unstructured gym exercise; MAP, mean arterial pressure; PAC, physical activity counseling; STRUC, structured gym exercise programme; TC, total cholesterol.
Analysis by baseline fitness
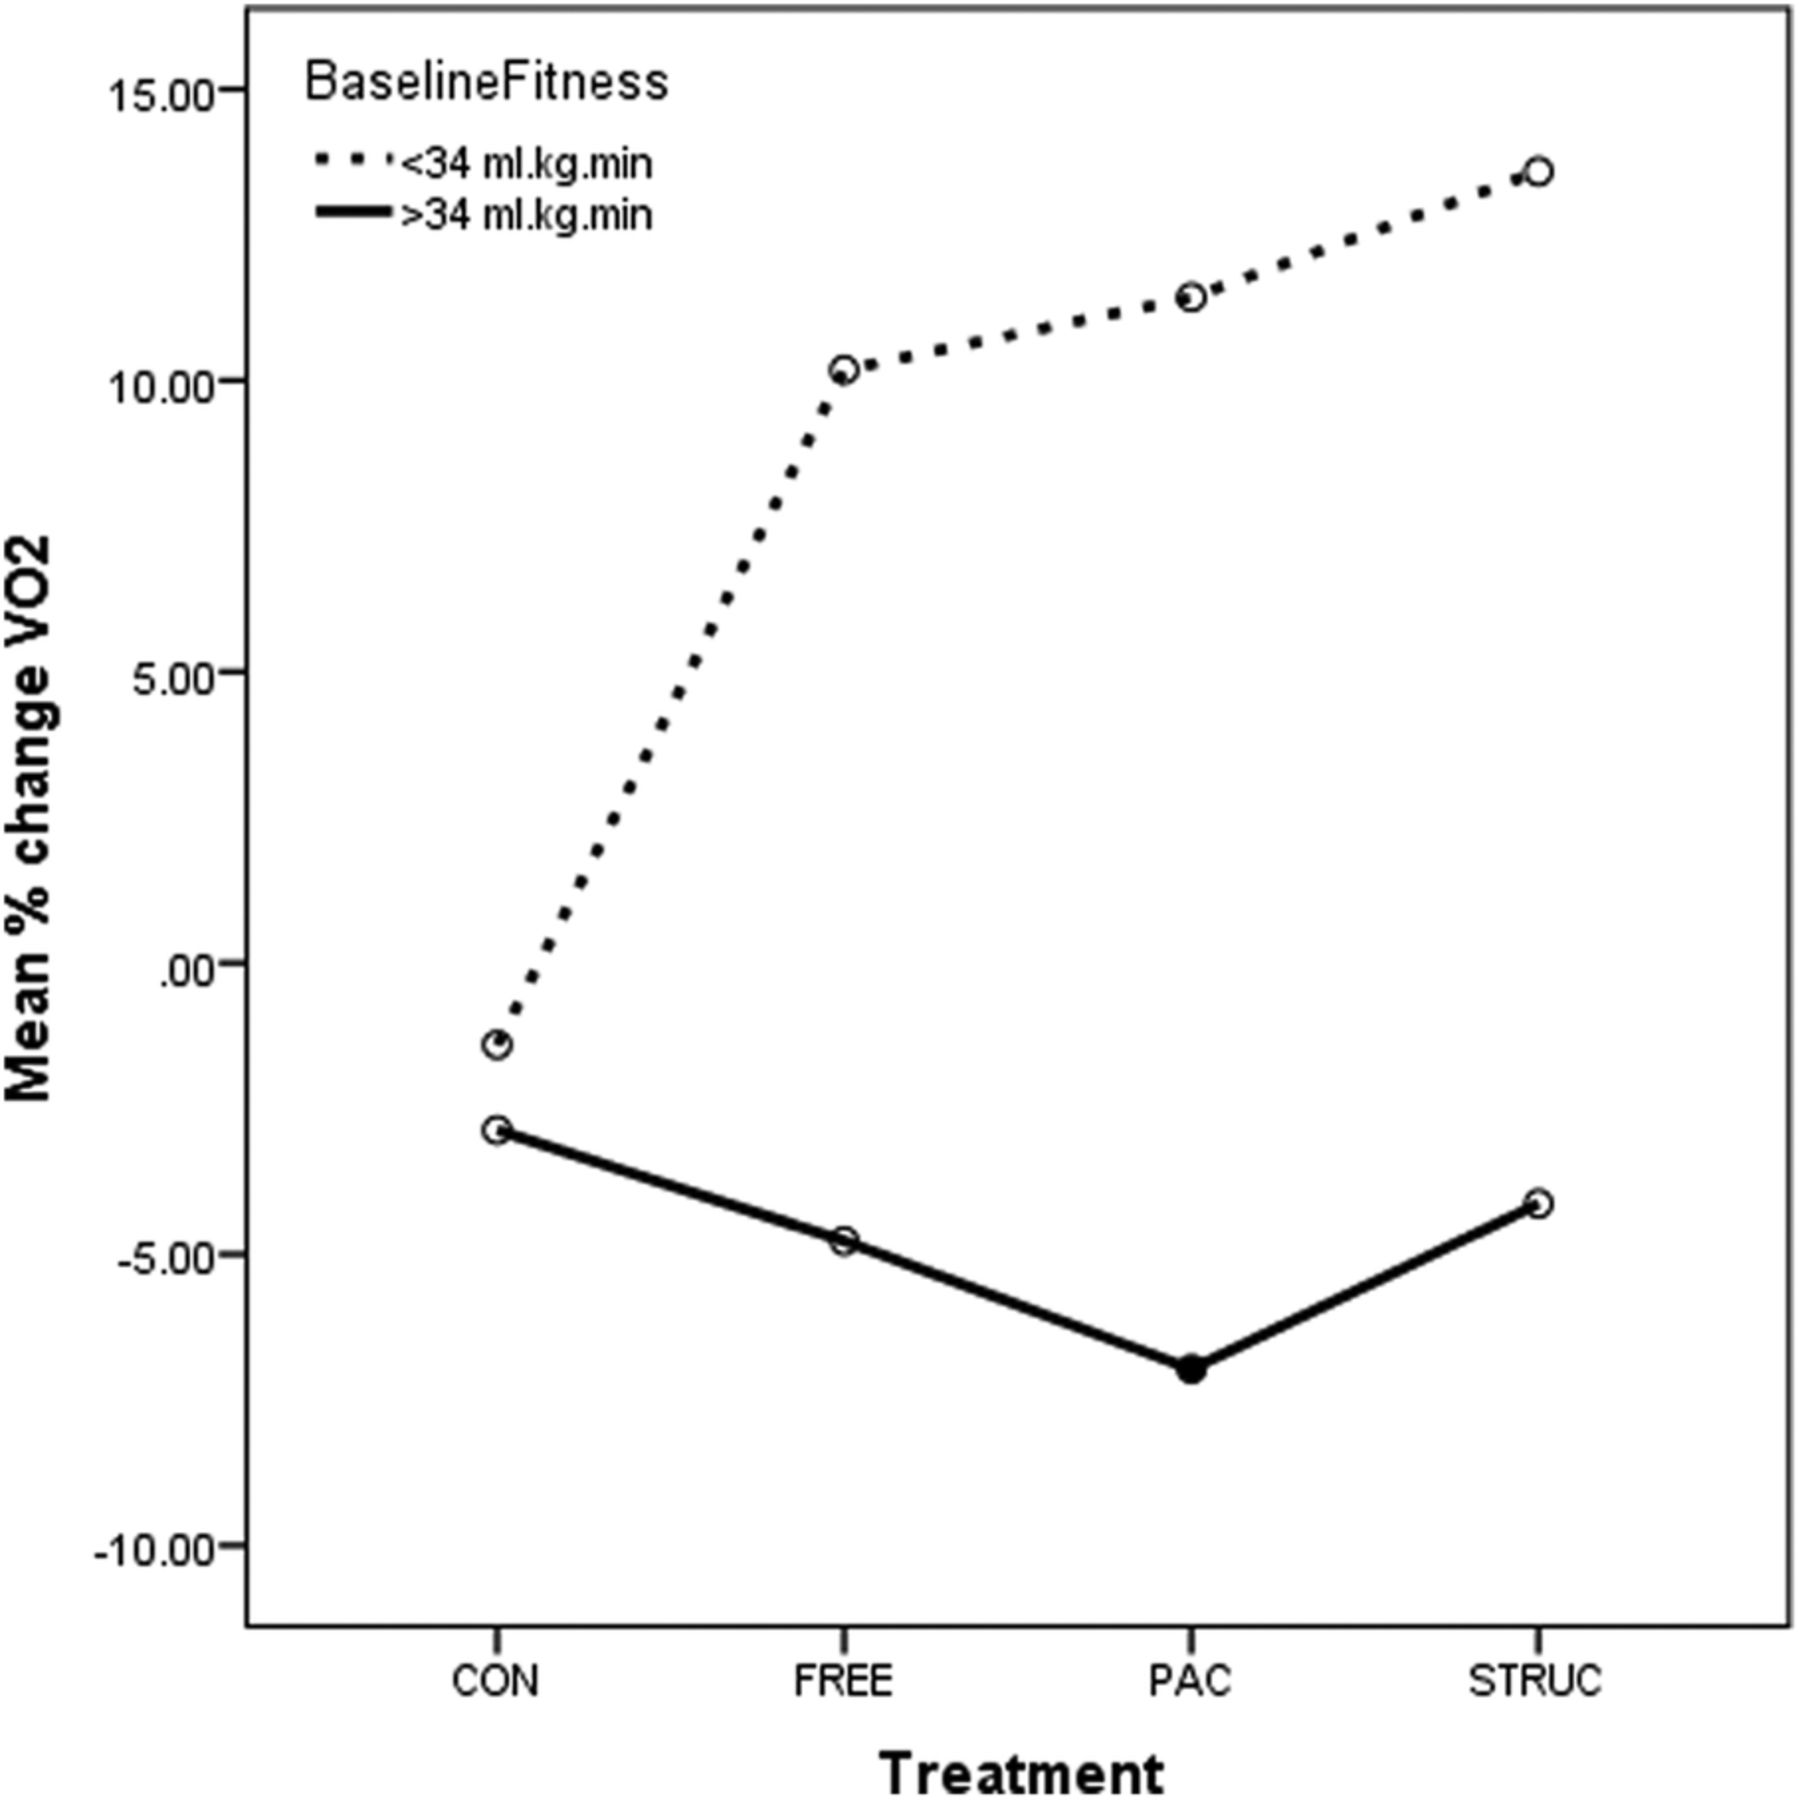
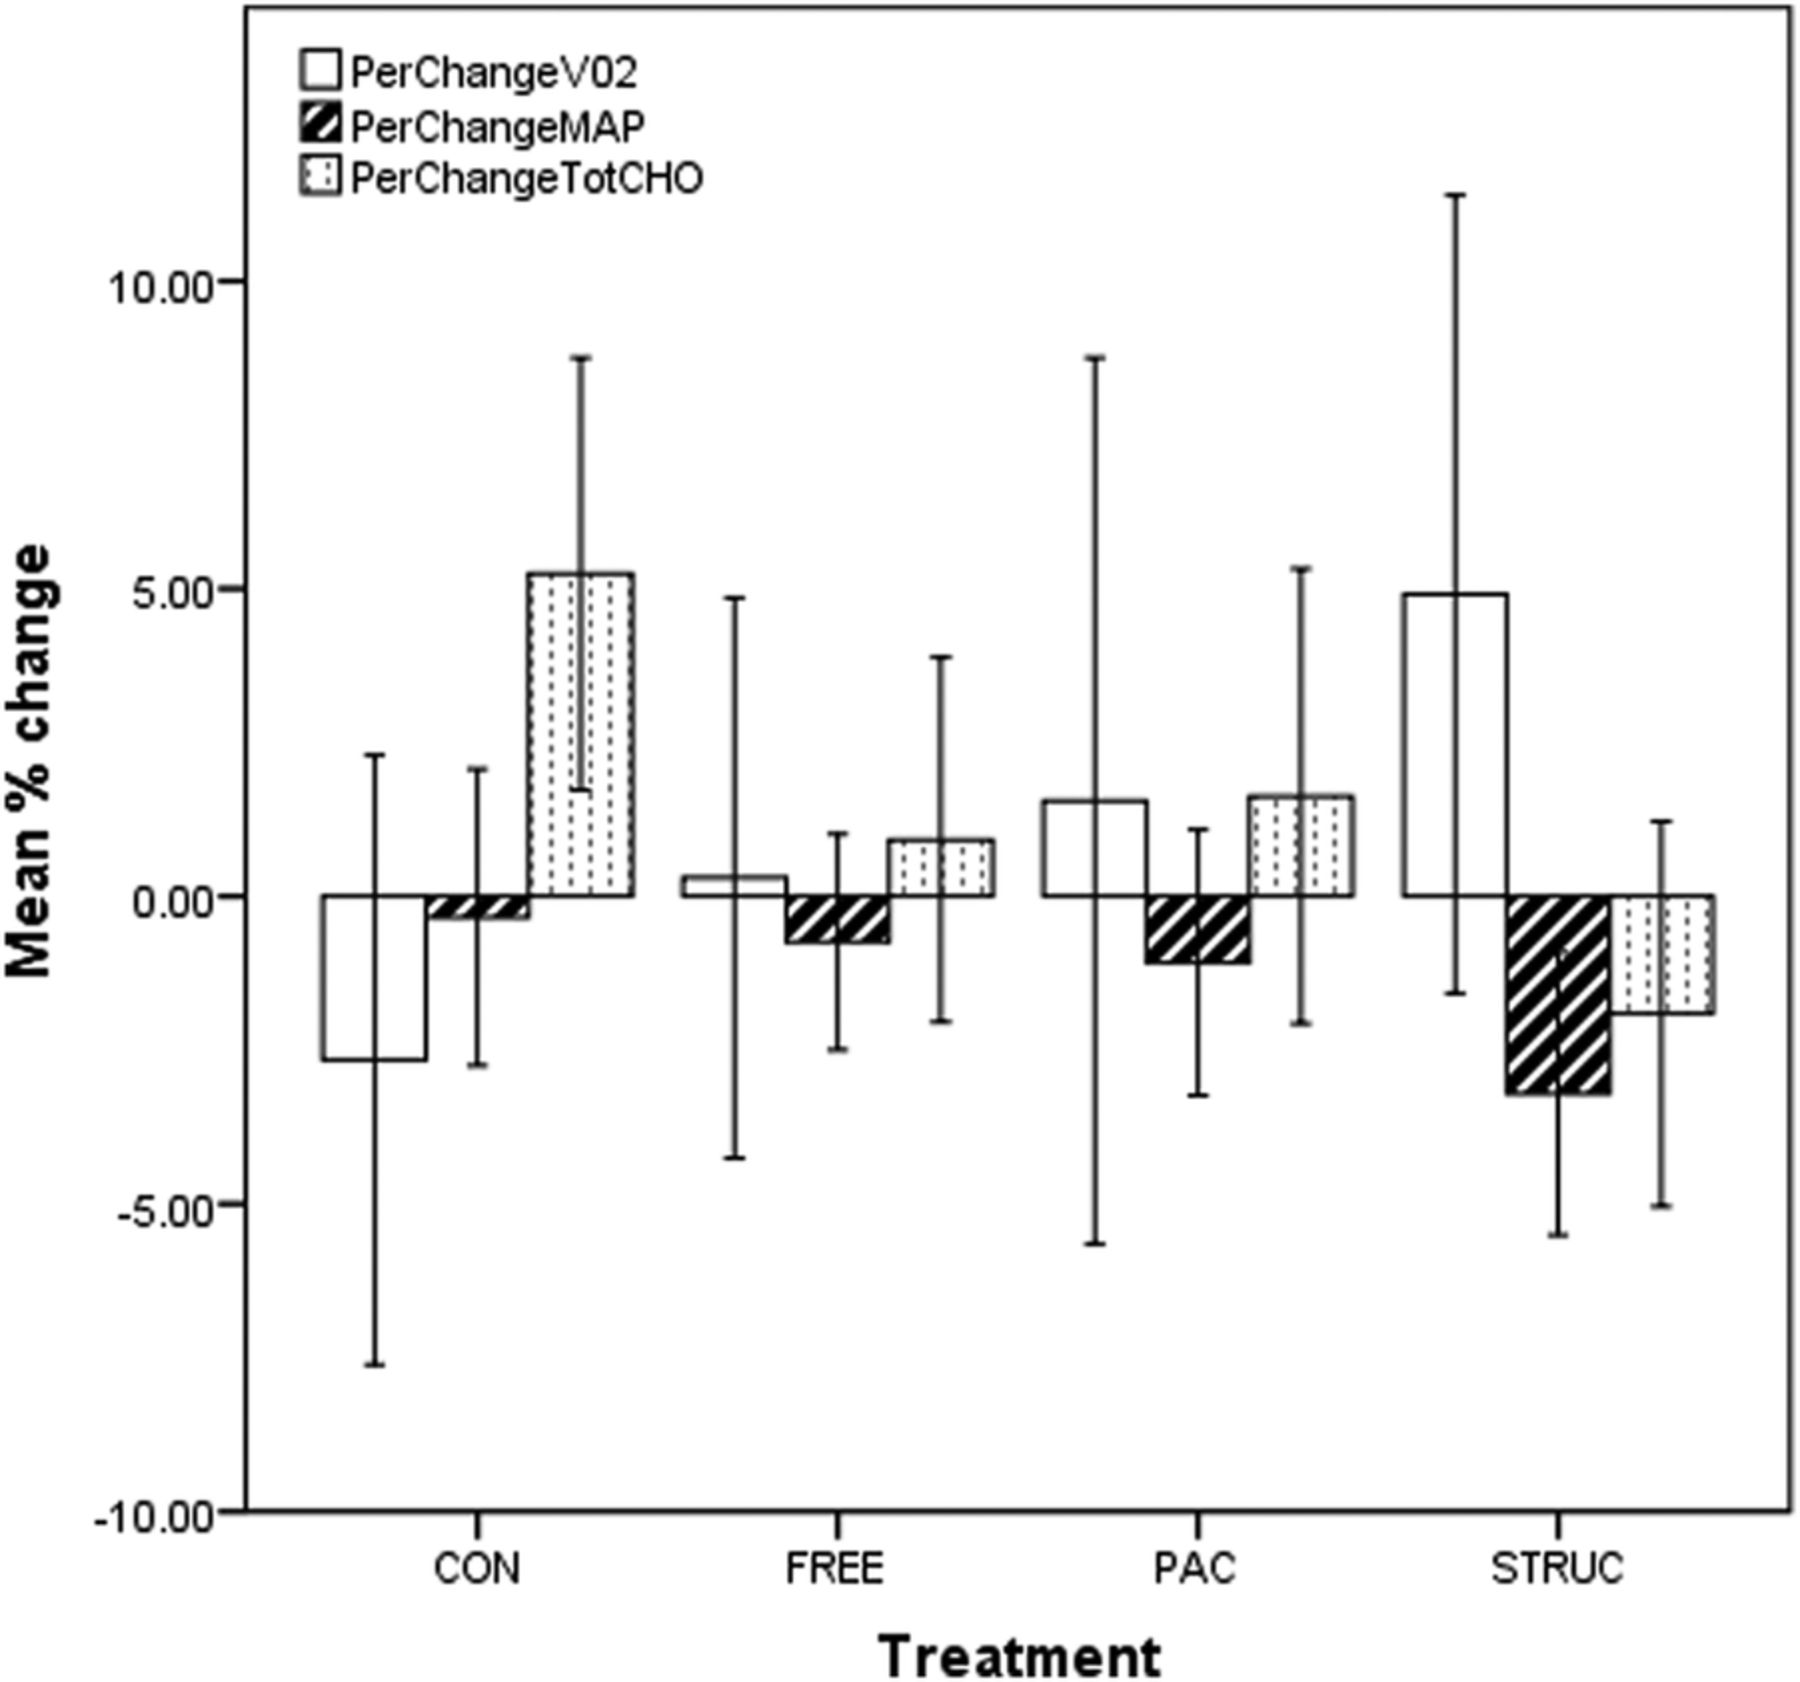
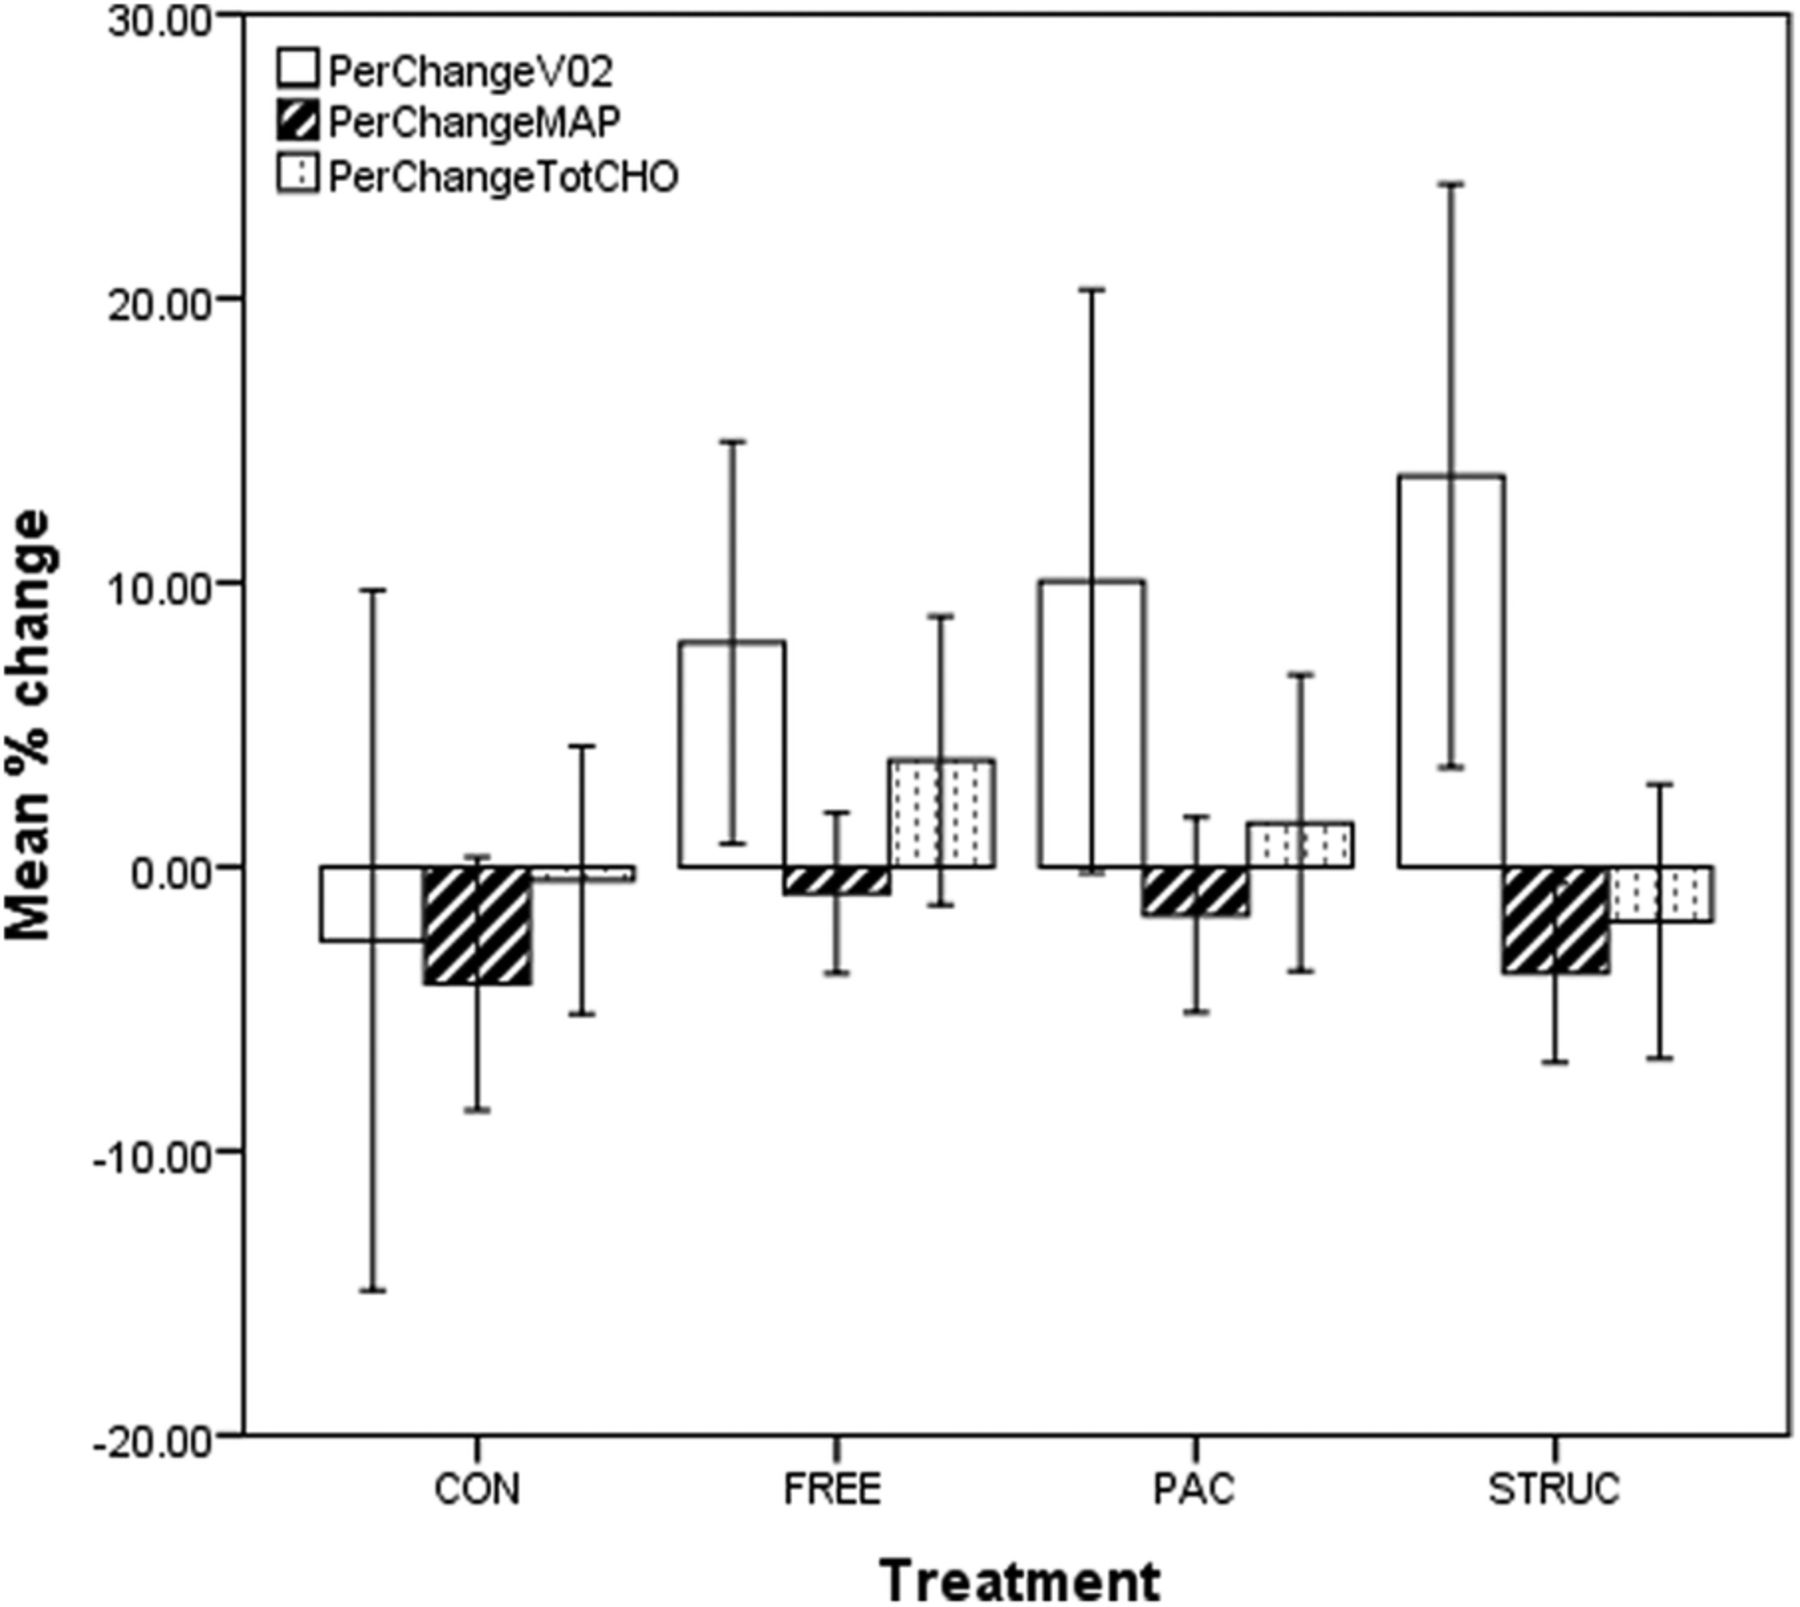
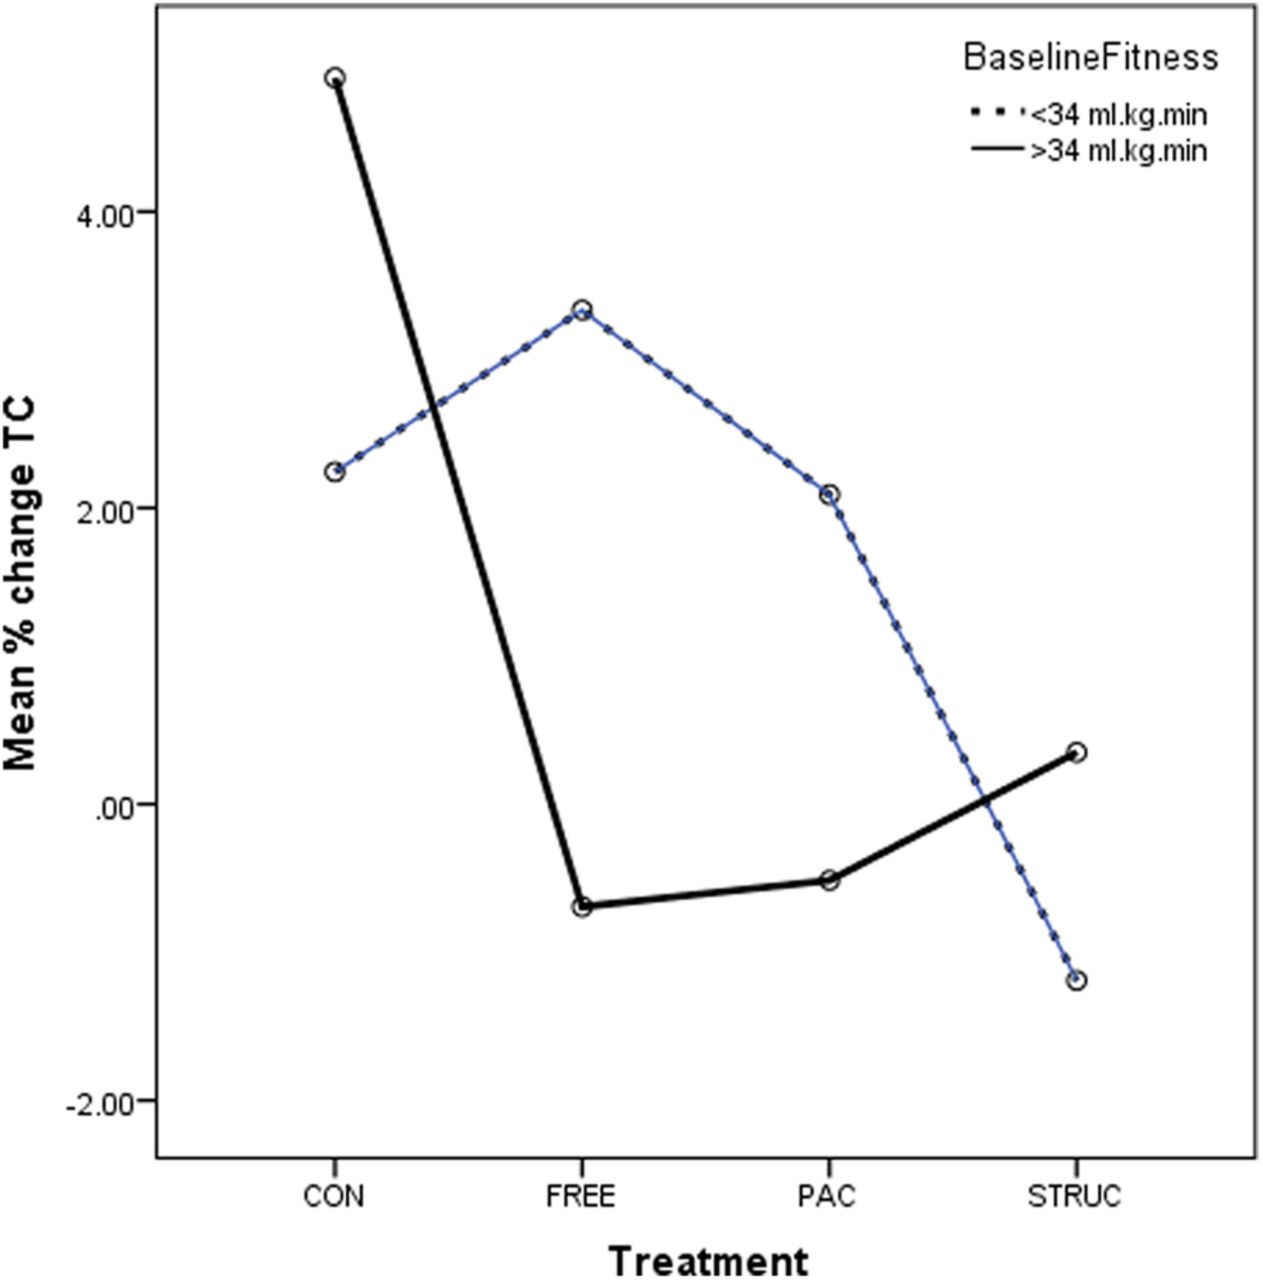
Fitness is a physiological marker of the PA levels of the individual, with those with high VO2 levels generally being more active than those with low values.29 While the study proactively recruited participants who self-reported as ‘currently sedentary’, it was clear from baseline VO2 data that many were, in cardiorespiratory terms, relatively fit, with 102 participants producing VO2 measurements above 40.0 mL/kg/min at baseline. We therefore implemented a median split of the sample by baseline VO2, resulting in low-fit and high-fit groups (m=27.5, SD=4.8 and m=43.5, SD=7.6 mL/kg/min, respectively). Data for all measures among low-fit participants are presented in figure 2, and for high-fit participants in figure 3.

Prepercentage and postpercentage change in VO2, MAP and TC for all treatments in low-fit participants. CONT, control condition; FREE, unstructured gym exercise; MAP, mean arterial pressure; PAC, physical activity counseling; STRUC, structured gym exercise programme; TC, total cholesterol.

Prepercentage and postpercentage change in VO2, MAP and TC for all treatments in high-fit participants. CONT, control condition; FREE, unstructured gym exercise; MAP, mean arterial pressure; PAC, physical activity counseling; STRUC, structured gym exercise programme; TC, total cholesterol.
Paired-sample t tests were conducted for pre–post values for all treatments for both low-fit and high-fit groups by baseline VO2. These are presented in tables 6 and 7.
Paired-samples t test comparing absolute values for VO2, MAP and TC at baseline, and 48 weeks for each treatment in low-fit participants
Paired-samples t test comparing absolute values for VO2, MAP and TC at baseline, and 48 weeks for each treatment in high-fit participants
Arguably, the primary findings of the study were that in low-fit participants, VO2 was significantly improved in all three PA conditions, and MAP was significantly improved in STRUC only. However, in high-fit participants, VO2 was significantly worsened in FREE and PAC, while TC was significantly worsened in CONT.
Supporting the paired-sample t tests above, results of an independent-sample t test conducted to assess differences in percentage change between low-fit and high-fit groups for each variable in each treatment are presented in table 8. These indicated that while effects for MAP and TC did not differ significantly as a function of baseline VO2, and while effects for VO2 were not significantly different between low-fit and high-fit participants in CONT, all three PA interventions were significantly more effective at improving VO2 among low-fit participants than among high-fit participants.
Independent-samples t test comparing percentage change between high-fit and low-fit participants for VO2, MAP and TC for all treatments
While the data analyses above implied an interaction between treatment and baseline fitness, results of a two-way ANOVA indicated no significant interactions. However, the numbers of participants in each subgroup was low which limited our power to detect an effect. These perhaps warrant some brief discussion, and these are presented in figures 4⇓–6.
Prepercentage and postpercentage change in VO2 for all treatments in low-fit and high-fit participants. CONT, control condition; FREE, unstructured gym exercise; MAP, mean arterial pressure; PAC, physical activity counseling; STRUC, structured gym exercise programme; TC, total cholesterol.

Prepercentage and postpercentage change in MAP for all treatments in low-fit and high-fit participants. CONT, control condition; FREE, unstructured gym exercise; MAP, mean arterial pressure; PAC, physical activity counseling; STRUC, structured gym exercise programme; TC, total cholesterol.

Prepercentage and postpercentage change in TC for all treatments in low-fit and high-fit participants. CONT, control condition; FREE, unstructured gym exercise; MAP, mean arterial pressure; PAC, physical activity counseling; STRUC, structured gym exercise programme; TC, total cholesterol.
In relation to VO2, a significant main effect for baseline fitness was evident (p<0.001). This is presented in figure 6, where it is clear that higher VO2 was associated with lower improvement over 48 weeks. In fact, the high-fit group in each treatment was associated with mean declines in VO2. No significant interaction between treatment and baseline fitness was observed (p=0.134). However, a clear trend evident in figure 4 indicates that all three PA treatments were considerably more effective than CONT with STRUC associated with highest percentage improvements over baseline.
In relation to MAP, there was no significant main effect for either treatment or baseline fitness (p=0.352 and 0.410, respectively). No significant interaction between treatment and baseline fitness was observed (p=0.100), and MAP appeared to improve for all participants including CONT. However, a clear trend evident in figure 5 indicates in low-fit participants, that STRUC was associated with the highest percentage improvements (ie, reductions) in MAP compared with baseline.
In relation to TC, no significant main effect for either treatment or baseline fitness was evident (p=0.203 and 0.649, respectively). No significant interaction between treatment and baseline fitness was observed (p=0.206). However, it is evident from figure 6 that while TC rose substantially for both low-fit and high-fit participants in CONT, rose moderately for low-fit participants in FREE and PAC, remained largely unchanged for high-fit participants in FREE, PAC and STRUC, it was slightly reduced in low-fit participants in STRUC.
Discussion
We examined the effects of three 48-week PA interventions on aerobic capacity, blood pressure and cholesterol levels. Importantly, in the translation of laboratory findings into real-world settings, all interventions and measures were conducted by staff of the fitness centres involved within existing operational protocols and budgets, and not by researchers.
Adoption and retention
Rates of adoption and retention in the present study were low, but these were not unexpected. Key to our approach was that we would not use any strategy to increase either behaviour unless it was consistent with those of the facilities hosting the study. That is, the research team did not try to maintain participant numbers through any form of incentives, motivational prompts, communications, etc. While we expected high attrition, the important question for us related to what level of clinical benefit would be observed among those participants who were retained to the study over 48 weeks.
Directly measured cardiorespiratory variables
While not all effects were statistically significant, it is reasonable to propose that all three PA treatments offset the significant increase in TC observed in CONT, and that this effect was most evident in STRUC.
In relation to MAP, while reductions were observed in all treatments including CONT, only in STRUC did this positive effect—which was also the largest in magnitude across all treatments—reach statistical significance. Once again, structured exercise appeared to be the most beneficial of the three treatments.
Reanalysis by baseline VO2
In low-fit participants, VO2 was significantly improved in all three PA conditions, and MAP was significantly improved in STRUC only. In high-fit participants, VO2 was significantly worsened in FREE and PAC, while TC was significantly worsened in CONT. While the analyses implied an interaction between treatment and baseline fitness, results of a two-way ANOVA indicated no significant interactions. However, numbers in each subgroup were low, likely impacting on power to detect an effect, and we therefore argue that these findings are worthy of some interrogation.
While it should not come as a surprise that among low-fit participants, each form of PA intervention would be effective in enhancing VO2 when maintained for 48 weeks, it is perhaps slightly alarming that among high-fit participants in FREE and PAC, VO2 worsened during the same period. This likely indicates that these individuals required a greater PA stimulus to maintain initial levels of VO227 than was associated with all three treatments (while high-fit participants in STRUC did not experience deterioration in VO2, neither did they experience an improvement).
Summary and implications
Our data provide evidence for the treatment effectiveness of three PA interventions among those who undertake the intervention for 48 weeks. The magnitudes of some of the effects observed are clinically relevant. For example, reductions in serum cholesterol of around 0.6 mmol/L can reduce the incidence of ischaemic heart disease by 54%,35 and a reduction of as little as 3 mmHg will reduce the risk of coronary heart disease by 5–9%, strokes by 8–14%, and all-cause mortality by 4%.36 Likewise, individuals with low cardiorespiratory fitness are at greater risk of developing coronary heart disease than physically active and fit individuals.29
Limitations
We recognise several limitations. First, we employed neither direct nor indirect measures of PA in the current study, so cannot state with any confidence whether, for example, STRUC participants experienced more positive effects due to the characteristics of the programme or due to higher overall levels of PA (notwithstanding the fact that, in the real world, higher levels of activity might be a characteristic of a structured programme). However, given that we randomised between STRUC and FREE, it is reasonable to propose that even if STRUC participants did complete greater levels of PA, this might have had a motivational effect of the STRUC intervention and, therefore, a potentially useful finding.
Second, community fitness centre staff recruited participants, administered interventions and conducted data collection. While the research team ran spot checks and audits, there remained considerable potential for experimenter effects and even fabrication of data. However, no significant difference in effects were observed for sites, and—with perhaps the exception of the deterioration VO2 in high-fit participants—data appear largely consistent with the expectations of the research team, all of whom have considerable experience in both research and applied PA and health. We are therefore confident that the data represent a legitimate account of the interventions.
Acknowledgments
The authors would like to thank the numerous fitness centres and staff who took part. They would also like to thank COSMED, Alere and Bodystat for their support of this study.
References
Footnotes
Contributors SM collected all data. AJ and CB managed the project. SM, SD and CB analysed the data. CB, SM, AJ and SD wrote the manuscript.
Funding This project was funded by the University of Greenwich, and ukactive.
Competing interests None declared.
Ethics approval University of Greenwich.
Provenance and peer review Not commissioned; internally peer reviewed.
Data sharing statement No additional data are available.