Article Text

Abstract
There is evidence from human twin and family studies as well as mouse and rat selection experiments that there are considerable interindividual differences in the response of cardiorespiratory fitness (CRF) and other cardiometabolic traits to a given exercise programme dose. We developed this consensus statement on exercise response variability following a symposium dedicated to this topic. There is strong evidence from both animal and human studies that exercise training doses lead to variable responses. A genetic component contributes to exercise training response variability.
In this consensus statement, we (1) briefly review the literature on exercise response variability and the various sources of variations in CRF response to an exercise programme, (2) introduce the key research designs and corresponding statistical models with an emphasis on randomised controlled designs with or without multiple pretests and post-tests, crossover designs and repeated measures designs, (3) discuss advantages and disadvantages of multiple methods of categorising exercise response levels—a topic that is of particular interest for personalised exercise medicine and (4) outline approaches that may identify determinants and modifiers of CRF exercise response. We also summarise gaps in knowledge and recommend future research to better understand exercise response variability.
- exercise testing
This is an open access article distributed in accordance with the Creative Commons Attribution Non Commercial (CC BY-NC 4.0) license, which permits others to distribute, remix, adapt, build upon this work non-commercially, and license their derivative works on different terms, provided the original work is properly cited, appropriate credit is given, any changes made indicated, and the use is non-commercial. See: http://creativecommons.org/licenses/by-nc/4.0/.
Statistics from Altmetric.com
Introduction
Physical inactivity and low levels of cardiorespiratory fitness (CRF) are major threats to public health. In response, leading health authorities worldwide recommend that all adults accumulate 150 min/week of physical activity/exercise.1–3 However, the findings from numerous investigations demonstrate an extraordinary interindividual variability in response to a standard dose of exercise wherein a substantial number of adults do not improve CRF beyond the day-to-day variability in response to physical activity consistent with current recommendations.4–6 The issue of individual response to treatment is, therefore, one of the most important in exercise medicine, yet attempts to quantify individual response are rare and not optimal from a design and analytical perspective.7
The underlying premise of this report is that the topic of individual response to standardised exercise has been neglected. However, quantifying individual response to exercise is complex. Here, we describe special designs and analytic considerations required for studies aimed at assessing individual response. Our objective is to provide the reader with a variety of options that may be used to address individual variability to exercise training.
For the purpose of illustration, the emphasis of the consensus is on CRF because this is the phenotype for which we arguably have the most extensive body of data, and it is an established marker of cardiovascular disease risk and mortality. CRF is an equally powerful predictor of mortality risk as traditional risk factors like hypertension, smoking, obesity, hyperlipidaemia and type 2 diabetes.8 Low CRF is a well-established risk factor for all-cause and disease-specific mortality9 in blacks and whites,10 both sexes,11 various body mass index groups,12 different age groups,13 14 apparently healthy people10 and in patients with diabetes,15 16 cardiovascular disease10 or hypertension.17 Improving CRF reduces cardiovascular disease morbidity and mortality.8
It is essential to distinguish between intrinsic and acquired CRF. Intrinsic CRF is the level that people have when they are sedentary and non-trained. In contrast, acquired CRF is the new level achieved as a result of regular exercise.18 Our consensus focuses exclusively on ‘acquired CRF’. Although increasing physical activity is a primary determinant of improvement in CRF at the group level, there is a growing body of evidence that the response to regular exercise varies substantially among individuals.
Not all people respond the same way to a given dose of exercise
Studies in the 1980s documented increases in CRF from 0 up to about 50% in response to a standardised dose of exercise.19–21 Some participants were considered CRF non-responders, as their CRF improvement did not exceed the measurement error. A genetic basis for varied CRF response to a given exercise was shown in pairs of monozygotic twins and nuclear families and studies involving selective breeding in rodents.22
However, concerns have been raised about the true magnitude of response variability as well as maximal trainability.22–24 Randomised controlled trials (RCTs) are frequently considered the most appropriate study design to quantify exercise training response variability.25 26 However, even with this classical design, there are multiple analytical challenges before conclusive evidence on response variability is achieved.23 27 Sports and exercise medicine is not the only field facing this challenge of individual treatment responses. Treatment response is one of the most important issues in many areas of clinical medicine. A more personalised approach to exercise would have to be based on rigorously performed trials and panels of biomarkers serving as a foundation for developing appropriate exercise response diagnostics.
In this context, an international group of researchers with experience in characterising individual response to exercise convened in Baton Rouge, Louisiana, at the Pennington Biomedical Research Center on 12 and 13 October 2017 to discuss the topic of individual variability in response to physical activity and exercise training. The purpose of this document is to summarise the consensus reached among the symposium participants on key topics. It is presented as a narrative review. Ample time was set aside for discussion of the critical topics during the symposium, and dissensions were largely resolved at that time. The remaining divergent views were further addressed during the manuscript development phase of the consensus document. The manuscript was reviewed and approved by all participants and coauthors. Current knowledge on individual variability of CRF response to exercise programmes in humans and rodents is reviewed. We present a brief summary of the evidence for a genetic contribution of exercise response variability in rodents and humans. We describe our consensus on research designs most appropriate for investigating exercise response variability questions followed by a summary of analytical strategies that seemed to be appropriate. Finally, the statement outlines gaps in knowledge and future research needs along with a number of recommendations.
Review of human and animal exercise studies
Human studies
Genetic studies were the first to document a varied CRF response to exercise training in sedentary volunteers. Several human studies, where the funding bodies did not finance the use of control groups, addressed genetic questions. These experimental studies were based on pairs of monozygotic twins and nuclear families.21 28–31 They found considerable interindividual responses to single-dose exercise programmes for maximal oxygen uptake (VO2max), other indicators of endurance fitness and multiple cardiometabolic risk factors.
There are many possible reasons why the response to exercise may be varied: non-genetic biological and behavioural factors, measurement error and day-to-day fluctuation. If these were the only causes, there would be no significance within monozygotic pair resemblance or no familial aggregation for exercise response. In fact, the data showed the opposite, that is, that response variance is not randomly distributed. This is evidence of a familial/genetic component, accounting for 30%–60% of the variance adjusted for age, sex, ethnicity and other concomitants, depending on the nature of the response trait.21 28 30–32 Additional support regarding CRF response being partly explained by genetics, along with cardiometabolic or morphological phenotypes, can be found in publications based on the HERITAGE Family Study.22 33–47
In aggregate, these human studies show that heritability, after adjusting for baseline CRF, age, sex and body mass, accounts for about 50% of the CRF response variance. To date, no studies have examined the heritability of CRF responses to maximal or near-maximal exercise doses.
Animal studies
Animal model experiments provide strong support for genetic contribution to variation in CRF trainability. Just as in human studies, experiments conducted in mice and rats confirm large interindividual differences in response to a given exercise regimen, and second, the response variance entails a strong genetic component. Two experimental strategies have been employed to study the pattern of CRF exercise response variability in rodents: comparing differences in training response among panels of inbred strains and among animals selectively bred for low or high trainability for several generations. An inbred strain is one that has been brother–sister mated for at least 20 generations and thus is more genetically uniform, much like monozygotic twins. Selection experiments, however, use genetically diverse populations.
Inbred rodent strain comparisons
Among a panel of 10 of the most commonly used inbred rat strains, there was a fourfold change in maximal treadmill running distance (∆DIST), a surrogate of CRF trainability, between the strains that ranked the lowest and highest for exercise response (ranging from −80 m to +239 m, respectively). The variance components for ∆DIST show that sex and initial body weight had no significant influence when compared with the effect of strain (ie, genotype) on trainability.48 Supportive evidence for the presence of a strong genetic component to CRF trainability has also been generated using inbred mouse strains.49 50 For example, comparing CRF response (calculated as change in time run to exhaustion) of 24 inbred mouse strains to a 4-week exercise training programme, a fourfold difference was observed between the lowest and highest performing strains, ranging from a decrease of 2.2 min to an increase of 8.7 min.49 The extent to which CRF trainability is determined by genotypes (heritability in the broad sense) reached 0.58 for the change in time run and 0.54 for the gain in total work performed.
Selective breeding for trainability
The most convincing observations for a genetic hypothesis come from selection experiments performed in rats.51 Maximal running distance was measured before and after an 8-week standardised absolute exercise programme on the treadmill. The ∆DIST was used as a measure of exercise response. The study showed that, on average, a population of genetically heterogeneous rats (N:NIH) exhibited a 140 m gain in running capacity in response to training, with wide interindividual differences that ranged from −339 m to +627 m. After 15 generations of two-way selection, rats bred as ‘low response trainers’ (LRT) on average experienced a decline of 65 m in maximal running distance with training, while ‘high response trainers’ (HRT) improved on average by 223 m (figure 1).
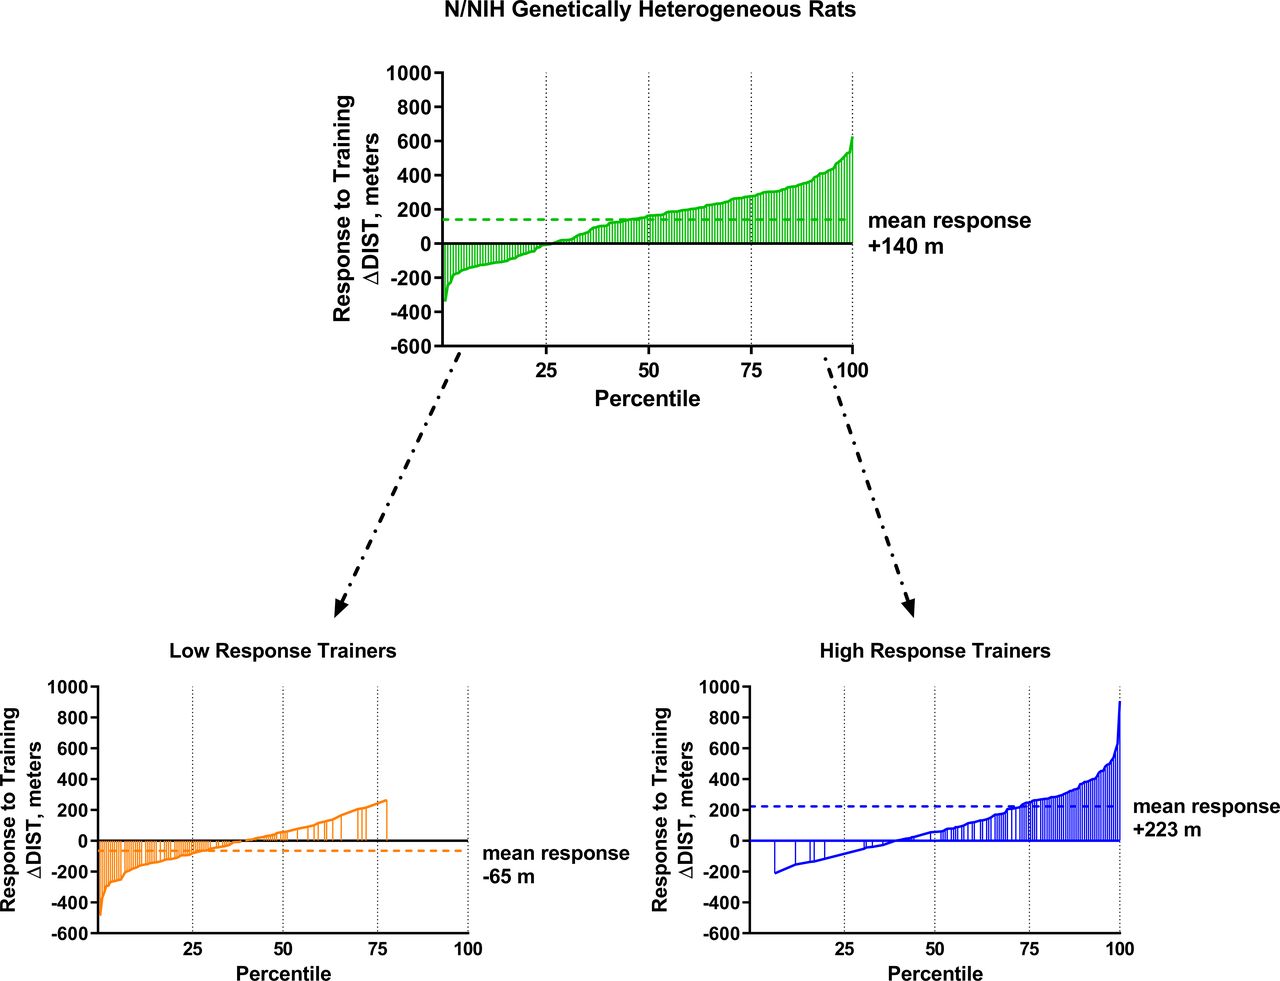
Preclinical animal model evidence for variation in training response: (A) frequency distribution for the change in running capacity (ΔDIST) for 152 genetically heterogeneous N/NIH rats shown in ascending order (males and females combined). The lowest and highest 10th percentile animals were used as founders to start low response trainer (LRT) and high response trainer (HRT) selected lines. Dotted line indicates the population mean change in running capacity with training. (B) Percentile rank score for the change in running capacity (ΔDIST) for LRT rats from generation 15 of selection arranged from lowest to highest. (C) Percentile rank score for the ΔDIST for HRT rats from generation 15 of selection arranged from lowest to highest. Dotted lines indicate the mean change in running capacity for the LRT and HRT selected lines. Adapted from Koch et al.48
Interestingly, in N:NIH outbred rats that are genetically heterogeneous and more likely to resemble diversity among humans, the female animals responded to training better than males, and the animals that were heavier after training had a lower training response. Across 15 generations of selection for low and high exercise response, the initial CRF before training was phenotypically similar for the LRT and HRT selected lines. Overall, the LRT and HRT models of Koch and Britton provide strong evidence that selection for the gain in CRF as assessed by ∆DIST is independent of initial exercise capacity and body weight but highly related to the underlying genetic selection, just as was suggested by human twin and family studies.
As further evidence of variability in exercise training responsiveness, several studies show LRT and HRT respond differentially to other types of exercise training. For instance, HRT respond to high-intensity aerobic interval training with a 40% increase in VO2max and accompanying gains in cardiac function, whereas LRT fail to improve VO2max.52 Compared with the HRT, LRT rats exhibit impaired skeletal muscle angiogenesis53 and mitochondrial biogenesis54 in response to chronic endurance training (absolute or relative) and diminished expression in genes regulating skeletal muscle remodelling response to a single acute bout of exercise.53 This impressive response to selection reveals that there is extensive covariation between the trait selected for and underlying biological mechanisms impacting trainability (CRF in this case).
Human studies designed to investigate CRF response variability
The vast majority of studies on the effects of chronic exercise on CRF focus on main effects and group differences and ignore interindividual CRF response variability. Studies specifically designed to determine the variability of response to exercise report an extraordinary heterogeneity in CRF response. There is variability in improvement to a standardised dose of exercise ranging from no gain in VO2max to about 1 L improvement of O2 uptake.
Here we summarise the findings of selected studies that examined individual variability in CRF (VO2max) response to endurance-type exercise training. The selection criteria used to identify suitable trials included: (1) recruitment of previously sedentary adults, (2) exercise interventions were standardised and supervised, (3) intervention duration was 12 weeks or greater, (4) study examined variability in CRF response and (5) included aerobic/endurance-type exercise. Combination (endurance and resistance) and resistance-only exercise were not considered. Eight studies met the inclusion criteria, with all but two having sample sizes of at least 30 participants (range 18–720). Table 1 provides a description of the study designs, exercise programmes, study population and mean change in CRF.
Overview of the exercise training programmes of studies that have examined individual variability in exercise response
The data summarised in table 1 support two important observations. First, in response to a standardised exercise programme, the heterogeneity of response for CRF is substantial: a finding consistent with the human and animal exercise genetic studies summarised in the previous section. Second, there are a number of important methodological issues that need to be considered when interpreting the variability in CRF response attributed to exercise.
Standardisation of exercise dose
When comparing the variability of CRF response across individuals within a given study, one assumes that the exercise dose was ‘standardised’. In other words, was the workload performed between individuals calculated to ensure that the absolute and/or relative workloads were similar across all participants? Exercise dose (amount) may be standardised by establishing time limits for exercise duration and/or using caloric expenditure targets per session. Among the studies described in table 1, the methods used to standardise the exercise prescription varied widely. For example, four of the studies standardised exercise by prescribing the same relative intensity, duration and frequency of exercise,4 20 55–57 whereas three trials used weekly caloric expenditure targets to standardise the exercise dose. For example, DREW study participants were randomised into a control group or one of three treatment groups of increasing exercise dose, 4, 8 or 12 kcal per kilogram of body weight per week (KKW), at a fixed intensity of 50% of CRF.6 Since exercise intensity was fixed in DREW, exercise frequency and duration could vary to meet the weekly energy expenditure goals. Ross and de Lannoy5 randomised participants into a control group or one of three exercise groups that differed in amount and/or intensity, with each intervention group prescribed a caloric target (energy expenditure) for each exercise session. Although the absolute amount and/or intensity of exercise was fixed (ie, high or low amount), the relative amount of time required to achieve the prescribed exercise amount varied across individuals. Conversely, the aerobic training group of the HART-D study was assigned an exercise dose of 12 KKW, but frequency, intensity and duration were not fixed.58
Within fully supervised and RCTs, the method used to standardise the exercise programme varies substantially. A concern is whether the variability in the method used allows for a proper quantification of the true variability in exercise response for a given, quantifiable exercise dose.
Exercise adherence
In its simplest form, adherence is defined as the number of sessions attended compared with the number prescribed. However, in addition to simply attending a session, to compare individual CRF response to exercise, it is imperative that the participants exercise at the prescribed dose each session. For instance, adherence may be defined as the kilocalories expended during exercise divided by the kilocalories prescribed. The studies described in table 1 monitored heart rate to ensure participants maintained the prescribed power output or exercise heart rate for each exercise session. One potential limitation of using heart rate to monitor exercise intensity is the potential for cardiovascular drift, or a gradual increase in heart rate during prolonged moderate-to-vigorous exercise despite maintenance of a constant work rate. Thus, in this scenario, work rate would decrease to keep heart rate constant, as was done in HERITAGE, which could result in the participant exercising at the proper heart rate but a lower power output. However, this drift is seldom observed at exercise intensities and durations commonly used in the studies reported to date. For instance, in the DREW clinical exercise trial of three different exercise doses (4, 8 and 12 KKW) performed for 6 months, little evidence of cardiovascular drift was found, with less than 1% of all exercise sessions showing evidence of drift.59
All eight studies reported high adherence rates (table 1). However, not all studies accounted for adherence in their reports regarding variability in CRF responsiveness. For example, in the Lortie et al,20 HERITAGE,4 HART-D,58 and Ross et al 5 studies, only participants with adherence >95%, ≥95%, ≥70% and ≥90%, respectively, were used for the analyses. In the remaining four studies, despite the mean adherence of each exercise group being greater than 85%, it is unclear how or whether the authors accounted for individuals with lower adherence levels. Hence, even though adherence is not a major issue in the studies reviewed in table 1, the extent to which differences in adherence variability contribute to variation in CRF responsiveness across studies cannot be determined.
Distinguishing CRF response from non-response
Distinguishing those who ‘respond’ to exercise from those who do not respond (so called non-responders) remains a source of considerable confusion. Common to all studies in table 1, investigators did not use a control group to account for the variability in CRF response that is not due to exercise. Thus, it is not possible to account for the portion of the individual response due to day-to-day or biological variability (see next section for detail). Apart from this limitation, multiple definitions were used to distinguish CRF response from non-response (table 1). For example, two studies defined CRF non-response as a change ≤0 L/min,6 57 whereas one analysis of the HART-D study defined non-response as a change less than 5%, which the authors deemed as a clinically significant change.60 Other studies have used a day-to-day variability, within-subject coefficient of variation (CV) of 5.6% from the literature to define VO2max response.56 61 Few studies have used technical error (TE), a combination of measurement error plus day-to-day variability, to define CRF response. When the latter was used in HERITAGE, the threshold suggested for the definition of a ‘true response’ was much higher than what is typically used based on CVs.22 Ross et al 5 defined non-response as a change in VO2max less than 1 TE, which was calculated as 204 mL/min in their study.
In summary, large individual differences in CRF response (range: −33% to +118%) have been observed across the eight exercise training studies independent of exercise duration (20 weeks to 12 months), amount, intensity and study population. These studies provide evidence that CRF non-response for a given exercise dose occurs even in fully supervised exercise interventions. At present, there is no consensus regarding how best to quantify individual variability and define classes of responders to exercise training. The inherent strengths and limitations associated with various approaches to quantifying individual response to exercise that accounts for the variability not attributable to exercise (measurement errors plus day-to-day variability) are discussed in the next section. One central question that has not been addressed until now is whether the CRF response pattern to a given exercise dose is reproducible. The only evidence that the CRF training response is reproducible comes from a small study reported more than three decades ago conducted with six subjects who agreed to retrain with the same 15-week exercise programme after a detraining period of 7 weeks.62 This is clearly an area in need of more research.
Research designs and analytical strategies
Conceptual understanding of individual response to exercise
Best practices for the design, conduct and analysis of studies comparing mean effects between groups are well established, and the implication of various design and analytic choices are widely understood. However, the special design and analytic considerations required for studies aimed at assessing individual response are less widely appreciated.23 25–27 63 Several recent articles have addressed statistical issues related to individual response to exercise training, and several tools have been made available to help design and analyse such studies.27
The central statistical challenge in assessing individual response is that, unlike with group means, the random error in observed individual responses is not diminished with increasing group size. The variance of observed response (sometimes called gross response variability) will always overestimate the true interindividual response variance because it includes variance due to random error, which can account for most or all of the observed interindividual variability.
We clarify that by individual response to an exercise programme, we mean the error-free change in an individual that is caused by the exercise intervention under study. The observed change is the sum of the change caused by the intervention, plus the change that would have occurred in the absence of intervention (eg, with a control treatment), plus various sources of error such as measurement error and day-to-day biological variability. Separating the true interindividual response variance from other sources of variance is essential to any analysis of individual response and to the investigation of its underlying biology.
We focus our discussion to studies that measure CRF, under similar conditions and using the same methods in each study participant before and after (and perhaps during) an exercise intervention.
Sources of variation of the dependent variable
When measuring CRF before and after an intervention, the observed change for individual i from intervention group j (denoted ΔCRFij) is the sum of the following three components:
True group j population mean change denoted μj (this is an unknown constant).
True individual i deviation from the group j population mean change denoted αij (this is the sum of B.1 and B.2).
B.1. Deviation due to permanent traits (sex and genetics).
B.2. Deviation due to changing traits (acquired or environmental such as age, diet, lifestyle and other transient traits). Note that since we are considering this component part of the true individual change, we are implying that an individual’s true response could vary over time. However, we consider short-term day-to-day variability in response to be part of the random error rather than B.2.
All sources of random error denoted e ij (includes measurement error and day-to-day variability, which are accumulated from the pre and post assessments. The variance of e ij is the sum of the variance of the random error at the preassessment and postassessments).
We make the usual statistical assumption that the three main aforementioned components are independent and that for each intervention j, components B and C have a population mean of 0 and a variance of V(αij) and V(e ij), respectively (component A has a population mean of μj and a variance of 0). Since ΔCRFij=μj+αij+e ij, the total observed within group variance of ΔCRFij is V(αij)+V(e ij), where the variance is measured across individuals within group j. As sample size increases, the sample average of ΔCRFij for treatment j will converge to μj with variance [V(αij)+V(e ij)]/nj, where nj is the number of subjects measured before and after treatment j. However, the variance of the individual observed change (ΔCRFij) remains V(αij)+V(e ij) regardless of the group sample size. It is important to point out that while the variance of the observed individual responses (ΔCRFij) is V(αij)+V(e ij), the true interindividual response variability is only V(αij). Thus, figures depicting the range of the observed individual responses will tend to inflate the true interindividual response variability.
If all sources of V(e ij) are adequately sampled (eg, adequate time interval and random sampling of assessors), then the observed between individual variance of ΔCRFij could be reduced to V(αij)+V(e ij)/m by taking m premeasurement and m postmeasurement on each individual. For individual i undergoing intervention j, ΔCRFij provides an unbiased estimate of the individual’s true change (μj+αij) with a variance of V(e ij), which again could be reduced to V(e ij)/m taking m preassessment and postassessment within the individual.
It is important to note that using the group average, ΔCRFj, to estimate the effect of exercise intervention j makes the strong and unrealistic assumption that on average ΔCRFj would equal zero in the absence of exercise. For this reason, the average causal effect of treatment j is usually estimated by ΔCRFj−ΔCRF0, where ΔCRF0 is the average change after a control condition of the same duration as the intervention. As mentioned in the prior paragraph, with increasing group sample sizes, ΔCRFj−ΔCRF0 will converge to μj−μ0, which is the true average treatment effect of intervention j compared with control. However, the true individual treatment effect for individual i under treatment j is (μj+αij)−(μ0+αi0), which may not be feasible to obtain.
If we are willing to assume that V(e ij)=V(e i0), then the observed variance of ΔCRFij minus the observed variance of ΔCRFi0 is equal to V(αij)−V(αi0). This additional variance due to exercise is often used as an estimate of interindividual response variance, or more commonly its square root is taken to obtain the SD of inter-individual response (SDIR). However, a highly standardised exercise programme may be expected to reduce both V(αij) and V(e ij) so that even in the presence of true interindividual variability in exercise response, the variance of ΔCRFij may not exceed the variance of ΔCRFi0. In fact, there are many examples in the literature where the variance of ΔCRFi0 is less than variance ΔCRFij, and as pointed out by Hecksteden et al,23 ‘difference in variation between the training and control groups is neither necessary nor sufficient for subject-by-training interaction to be present’.23 Thus, specialised study designs supported by appropriate analyses may be required to estimate the true individual response to exercise and interindividual variability.
Overview of designs and analytic strategies
Every approach relies on assumptions that are less robust and plausible than typical assumptions required for comparing group means. Even the logistically challenging crossover study with multiple intervention and control periods relies on the assumption that exercise training from an earlier period would not affect the treatment response in a subsequent period (some advanced analytic strategies attempt to account for potential carry-over effects, but they too rely on further assumptions).
Table 2 describes the assumptions, limitations and measures of interindividual response provided by several study designs that have been used to estimate interindividual response variability.27 Designs without a control group (or control condition) (ie, designs 1, 2 and 3) cannot isolate changes due to treatment (eg, exercise training) from changes that would have occurred in the absence of treatment. Designs without multiple assessments before and after (or during) treatment (ie, designs 1 and 4) cannot isolate random error from interindividual response variability without assuming that all components of random error, including day-to-day variability, have the same variance under the control condition as the intervention condition. An added advantage of having multiple assessments before and after (or during) treatment is that the error can be reduced by using the average of multiple assessments to estimate the observed change.
Overview of research designs to assess individual differences in the response to exercise training for a given trait*
The relative strength of each study design and corresponding analytic strategy depends on the plausibility of its statistical assumptions as well as the practicality of its implementation. The ‘optimal’ design and timing of assessments is a topic for future research. However, in brief, we recommend that studies aimed at measuring interindividual response variability should have a control group (or control condition for crossover studies) as well as extra assessments in addition to the single preassessment and postassessment. Furthermore, we recommend that assignment to the control group (or ordering of conditions in a crossover study) should be by random assignment to ensure no systematic differences exist in participants undergoing a control versus intervention condition. For the aforementioned reasons, designs 5, 6 and 7 (table 2) are preferable designs for studies aimed at assessing interindividual response variability.
For samples obtained through designs 5, 6 and 7, the linear mixed effects model can be used to provide group level and individual level estimates of treatment response and its variance.64 The exact model specifications will depend on the specifics of the study design, the objectives of the analysis and the software used. However, in general, the model would include terms for treatment group, period and treatment by period interaction with the intercept, and possibly additional terms, being modelled as random effects varying across individuals. It is important to note that correctly modelling the correlation between repeated measures within an individual will usually require more than simply adding a random effect for the individual.
Estimating interindividual treatment response variability
Uncontrolled group designs
The single pre–post measurement uncontrolled design (table 2, design 1) can only provide a valid estimate of interindividual treatment response if there is no random error [V(e ij)=0], and there would be no difference between any individual’s pre–post change in the absence of treatment. Both of these assumptions are highly implausible.
With multiple premeasures and postmeasures (design 2), or multiple measurements spread over time (design 3), the random error, V(e ij), can be estimated so that the true error free variability of the pre–post change, V(αij), can be isolated. However, in order to use V(αij) to estimate interindividual variability in response to treatment, we must make the strong assumption that there would be no interindividual variance in pre–post change without intervention.
Control group designs
By far the most commonly reported measure of inter-individual response variability is SDIR. The SDIR can be estimated using a sample collected from a control group design with single premeasures and postmeasures (design 4) by taking the square root of the difference of the variance of the observed pre–post change in the control arm, V(ΔCRFi0), from the variance of the observed change in the intervention arm, V(ΔCRFij). The simplicity of this approach is appealing, but as mentioned above, this estimate requires the assumption that the variance of the observed change not attributable to treatment is similar in the control and intervention arm. This estimate can be represented by the following equation:

Control group: multiple measures
With multiple premeasures and postmeasures (design 5), we can directly estimate V(e ij) and V(e i0). These error terms can also be estimated indirectly from a sample obtained from a longitudinal control group design with measures spread over time (see table 2, design 6). So, by rearranging the above equation, we obtain the following equation:

Repeated measures designs
As an alternative to control group designs to determine individual variability in response to exercise, Hecksteden et al 27 describe an approach using a repeated measurements design (table 2, design 3) with multiple treatment phases. These designs bear the advantage that, because there is no control group, there is no interindividual variability between the control and the experimental group, which is inevitably confounded with the intraindividual variance attributable to the treatment.
To control for secondary variance, the repeated measures design has an advantage compared with classic control group designs. A control group is used to account for known as well as unknown factors influencing the main effect in a study as well as its variance, such as sex, age, genetic predispositions, social, educational, athletic antecedents and so on. By using control techniques like matched pairs or randomisation, the investigator aims to achieve a similar distribution of these effects over the control and the experimental groups. Nevertheless, one can never be sure that all these potential sources of variance are in fact equally distributed. With repeated measurements designs, where every subject is tested under every level of the independent variable, the distributions of confounding factors that arise from the individual biology or antecedents are extremely close to equal (if not in fact equal) under the various levels of the independent variable. This holds particularly well if the time span of the experiment is not extremely long (eg, years). With such a design, the total variance is reduced by the fact that there is no intergroup variance between a control group and an experimental group. As this reduces substantially the statistical error, these designs are typically more economical than control group designs.
Estimating individual exercise response
Since the observed individual response is the sum of true individual response to exercise and random error, the observed response will be positively correlated to the random error. In fact, this correlation is simply the square root of V(e ij)/[V(αij)+V(e ij)]. This correlation implies that the larger (smaller) the observed value, the more it will tend to be overestimated (underestimated). We noted above that the observed individual response (ΔCRFij=μj+αij+e ij) is an unbiased estimator of the true individual response (μj+αij) since the mean of e ij is 0. However, an improved estimator of an individual’s response can be obtained by shrinking the observed estimate towards the group mean with the degree of shrinkage directly proportional to V(e ij)/[V(αij)+V(e ij)]. Intuitively, this makes sense since V(e ij)/[V(αij)+V(e ij)]=1 implies that all of the observed variance is due to random error rather than any true differences between individuals, while V(e ij)/[V(αij)+V(e ij)]=0 implies that all of the observed variance is true interindividual response variability. These shrinkage estimates are often estimated by best linear unbiased predictors, which can be directly obtained from the linear mixed effect model.
Categorising individual exercise response
It is widely recognised that individual CRF responsiveness to exercise training at a given dose translates into a change score distribution from which classes of responders could be potentially identified. One could, for instance, envisage a classification scheme that would distinguish among super responders, average responders, low responders, non-responders or even adverse responders to the same exercise dose. Alternately, one could recognise positive, negative and trivial responders. Defining classes of responders to exercise programmes and developing guidelines aimed at some uniformity in approach requires a proper understanding of the underlying biology of the trait of interest as well as valid statistical models.
There are two fundamental and unavoidable challenges to categorising individual response. The first is that the true individual response must be estimated from an observed response, which contains random error such that the lowest observed responses tend to be underestimated and the highest observed responses tend to be overestimated. This problem can be reduced by using the best linear unbiased predictors to estimate an individual’s true response, but classification error will still be a problem when within-subject error is considerable. The second challenge in categorising response is the arbitrariness of choosing the response category thresholds. The arbitrary selection of response category thresholds results in inconsistent classification of individuals rendering between-study comparisons meaningless.27
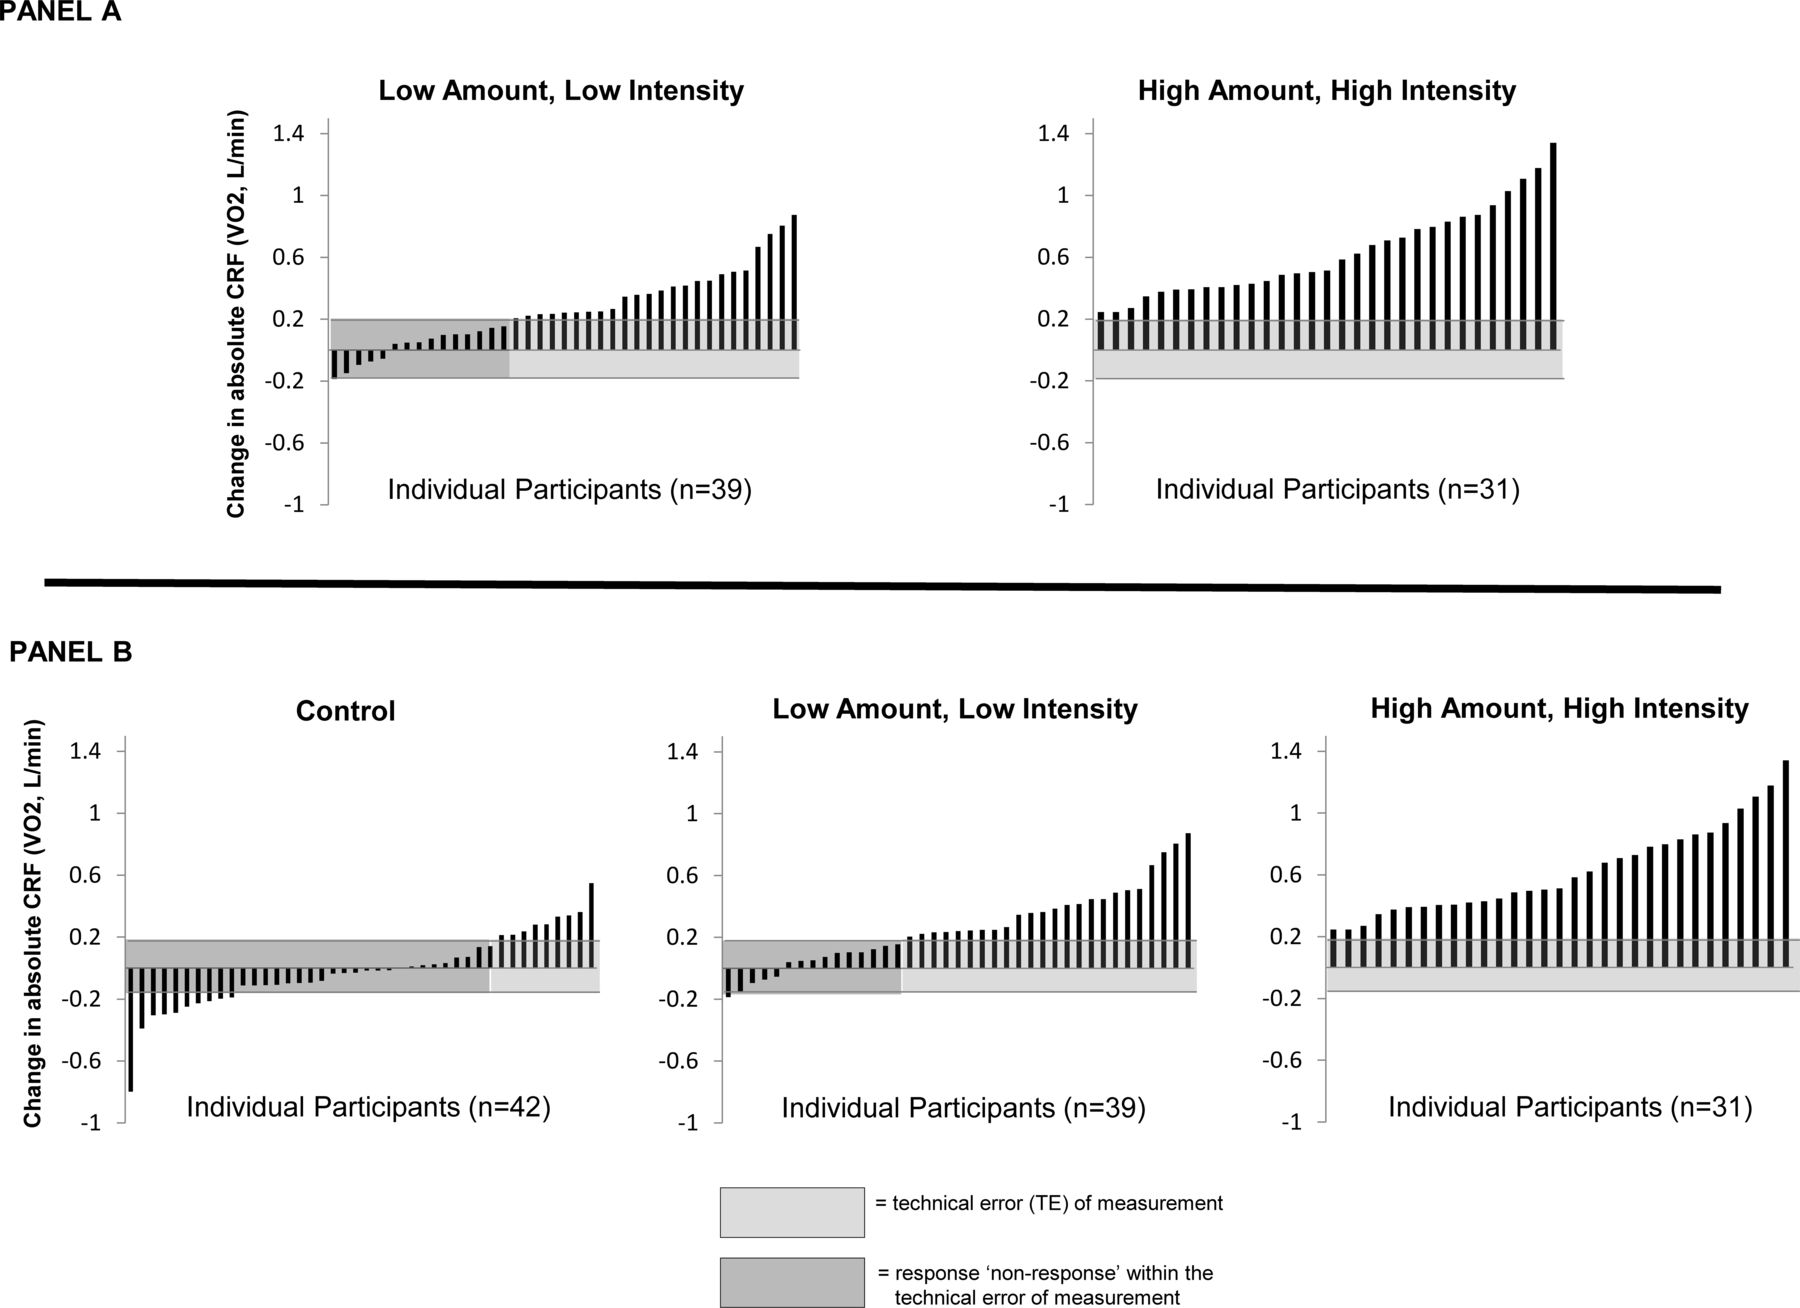
Early approaches to the classification of individual response categorised positive responders directly from the individual change scores, by assuming that any positive change score or any change score greater than or less than some threshold represents a positive or negative response. The thresholds chosen in the past have usually been derived from either the coefficient of variation obtained from CRF test–retest data (eg, CV of 5%), or the within-subject SD obtained from two or more CRF tests (eg, the TE) representing the error of measurement plus the day-to-day CRF variability or some multiple of it, such as 1.5 or 2.0 (eg, refs 5 22 65). The rationale for this approach is that sufficiently large positive or negative changes are unlikely to be due simply to error of measurement and day-to-day variability and can therefore be considered ‘real’ changes. Figure 2, panel A, provides an illustration of the approach used to segment ‘responders’ from ‘non-responders’ using the TE derived from duplicate measures of CRF for each participant derived within the same week.5 This approach has limitations because the day-to-day variability in CRF measurement determined over several days (eg, duplicate measures in same week) fails to consider the biological variability that may exist over the duration of the treatment period (eg, 24 weeks in this case).26 Figure 2, panel B, provides an illustration of the approach used to segment ‘responders’ from ‘non-responders’ using the TE derived using a time-matched control group.

Change in CRF (VO2, L/min) at 24 weeks for each participant per exercise group. The technical error (TE) for CRF measurement is illustrated by the lighter shaded area. Values within the darker shaded area represent the individual CRF response within the TE range. Panel A: TE was derived from duplicate measures of CRF that were obtained within the same week. Panel B: TE was derived from the control group using their baseline and follow-up CRF measures. See table 1 for detailed descriptions of exercise amounts and intensity. Adapted from Ross et al.5 CRF, cardiorespiratory fitness.
Individual responses as proportions of responders
An alternative approach to a binary classification of individuals as responders or non-responders has been developed by Hopkins66 as a way to estimate the probability of an individual change score to be a surrogate for a true response. Based on these calculations, individual change scores can be classified, for example, as unlikely, probably, likely or very likely to represent a true change in the dependent variable (see figure 3). With this approach, the focus shifts from classifying individuals based on their measured change scores to classifying the change scores themselves. Additionally, the resulting statement is a probabilistic one, namely, the probability that it represents a true change. Both issues provide valuable enhancements to the responder classification issue. However, this approach also requires several arbitrary decisions such as assigning certain probability range labels such as ‘very likely’ as well as assigning a value for the smallest important change or minimal clinically important difference. Also, the method makes an implicit use of Bayesian statistics to estimate the probability of an observed change value being a true response.67 68 It is possible that this approach could be improved by using an empirical Bayes approach where the prior distribution is based on patients in the same treatment group as the individual patient rather than assuming a flat prior distribution as implicitly assumed by the current approach. However, experts in statistics have raised concerns regarding the validity of this approach and made a number of suggestions relevant to the topic of quantifying individual differences in response to an intervention.69 70 The colour coding in figure 3 depicts the classification of response probability for individuals from an RCT5 based on Hopkins’ approach. The figure also provides unadjusted 90% CIs of the change score for each individual, where the within individual SD is assumed to be equal to the TE used for the individual response probability categorisation.

Distribution of the likelihood (colour coded) that the individual response was greater than the minimally clinically important difference for CRF. The 90% CIs are calculated as the observed response ±1.6 (technical error). Dashed line represents the minimal clinically important difference (1 multiple of the resting metabolic rate (MET). See table 1 for detailed descriptions of exercise amounts and intensity. Adapted from Ross et al.5 CRF, cardiorespiratory fitness.
Identifying determinants of interindividual response variability
Innate and acquired characteristics can be determinants of interindividual response variability as revealed when groups of patients having a different presentation (or value) of the given characteristics have a different average response to treatment. For example, if men and women have a different average response to an exercise programme, then sex is a determinant of interindividual response variability. The interaction term from a linear regression model with an indicator for treatment group, the characteristic and their product (ie, the interaction term), can be used to estimate the magnitude and statistical significance of the interindividual response variability due to the characteristic.
In theory, the establishment that interindividual response variability exists before setting out to identify its determinants (also known as effect modifiers) is sensible. However, due to the limitations in reliably estimating the interindividual response variability, testing determinants of interindividual response variability (selected based on a priori considerations) even when the latter continues to be investigated is acceptable. Furthermore, if a clear determinant of interindividual response is identified, then that would provide supportive evidence for the presence of response variability in spite of current limitations on the global estimate of interindividual response variability.
The issue of multiplicity of testing (ie, inflated type I error) must be considered if multiple potential determinants of response are considered. Conversely, the issue of power (ie, type II error) must also be considered when using formal hypothesis testing to identify determinants of interindividual response variability. Unfortunately, studies designed to compare group means are usually underpowered to identify effect modifiers. For example, with a binary effect modifier, under the best case scenario where the effect modifier is balanced within arms (eg, equal number of men and women in both the intervention and control arms), the total sample size required to detect a difference in treatment response of δ (the intervention minus control arm difference is δ larger for women than men) would require four times the total sample size compared with a study designed to detect an overall difference between the control and intervention arm.71 However, if it can be assumed that the effect modifier acts only on the intervention group, the required sample size would be reduced, since we would now be testing for a difference within the intervention group rather than a difference of the differences.
Finally, it is important to be aware that statistics such as multiple R2 or the absolute value of the difference between groups are biased upward, although this bias decreases with overall sample size. Accumulating measures such as R2 over multiple variables can result in substantial overestimation of the amount of interindividual response variability attributed to these variables; use of bias corrected measures such as R2 adj can reduce but may not eliminate this problem.
Summary and research recommendations
Animal and human studies confirm large interindividual differences in response to standardised exercise and the existence of a genetic component contributing to exercise training response variability. Thus far, the evidence for human variability in responsiveness to exercise training comes from participants exposed to a single dose of exercise. Thus, whether the individual CRF response to a given exercise dose is a permanent feature or may be improved by altering the exercise dose is unknown. Because the standardisation of exercise programmes varies substantially, there is a need to improve the reporting of the trial methods used to standardise the exercise prescribed across participants and of the monitoring methods. This includes reporting the adherence and compliance rates for all participants to the exercise programme during the intervention.
A cornerstone of exercise studies designed to investigate the magnitude of interindividual differences in CRF trainability is the reduction of the random error component (error in CRF assessment and day-to-day CRF variability) of the response variance. We have summarised the assumptions, limitations and analytic approaches of several designs reported in the literature for the assessment of individual variability in CRF response after exposure to exercise.
We recommend study designs that include a randomly assigned control group (or condition) and have multiple assessments of CRF before and after (or during) intervention. Specialised statistical methods such as linear mixed effects models may be required to analyse data captured from these studies. Subtracting the observed variance of a control group from an exercise intervention group provides a simple estimate of the variance of the interindividual response to treatment but makes the strong assumption that all other sources of variance are identical in the intervention and control groups. As there are divergent views on analytical approaches, one needs to rely on strong statistical support before embarking on these kinds of studies.
It is important to be aware that, due to random error, the variance caused by the heterogeneity in observed responses will always overestimate the true interindividual response variance. Therefore, the observed responses will tend to be higher (or lower) than the true response in individuals with the highest (or lowest) observed responses, thus likely inflating the spread in response. Moreover, standardisation or transformation of CRF data can have an impact on the assessment of individual variability, and the issue must be dealt with cautiously.
In the presence of even a moderate error variance component, the observed raw change may not provide the best estimate of the true change of an individual. Methods that ‘shrink’ the observed change towards the mean group change, such as best linear unbiased predictors, may be considered in such cases. A challenging problem is that of classification schemes of individual response; in the current state of our science, it is based on subjective choices (and cut-offs) and potentially dubious assumptions.
Determinants and mediators of interindividual response variability can be identified by assessing the interaction (ie, product term) between treatment and the potential determinant or mediator. However, if many potential determinants or mediators are considered, then falsely identifying some determinants (type I error) is likely. Such studies can only be undertaken successfully with much larger sample sizes than what is required for studies comparing mean response between groups.
The symposium and subsequent discussions and exchanges among participants have revealed that there are multiple gaps in our knowledge base. Some of these deficiencies are clearly attributable to the limited level of funding devoted to exercise biology research, which prevents investigators to think in terms of larger and more comprehensive studies. Nevertheless, gaps exist in study designs and analytical tools that should be addressed if we are to be able to conduct powerful and highly reproducible studies. Unknown is whether the CRF response pattern to a given exercise dose is reproducible when the programme is repeated following an appropriate detraining period. Likewise, it is essential that we design research to investigate whether the response to a given exercise dose is a valid predictor to the response pattern to other exercise doses. It would also be helpful if innovative experimental approaches could be developed to investigate CRF trainability at doses that are as close to maximal as possible.
It is also apparent that ongoing dialogue between those who base their science on animal models and those working exclusively with human participants is lacking. To understand the true magnitude of human variability following exposure to regular exercise and the profile of the molecular transducers triggering improvement in CRF, as well as changes in cardiometabolic traits, it will be important to close this divide. Finally, as is the case in most of biomedical research, collaborative research should be high on our agenda so that more comprehensive projects with larger sample sizes and wider range of expertise become the norm in this area of exercise biology research.
Even though the focus of the symposium and of this consensus document is entirely on variability in CRF responsiveness to exercise programmes, the questions raised, the study designs and analytical approaches discussed and the research areas identified apply equally well to other exercise phenotypes, including health benefits and risks associated with regular exercise.

Participants at the Symposium on Exercise Variability Pennington Biomedical Research Center, Baton Rouge, LA October 2017. Left to right: Andrew G Day, Julie Van Scotter (PBRC Assistant Director of Educational Programs), Guillaume Spielmann, Bret H Goodpaster, Brian A Irving, Wendy M Kohrt, William G Hopkins, Werner Pitsch, Mark A Sarzynski, Claude Bouchard, Robert C Noland, James S Skinner, Neil M Johannsen, Lauren G Koch, Alex Castro, Phillip Brantley (PBRC Associate Executive Director for Education), Lauren M Sparks, Robert Ross.
Acknowledgments
Gratitude is expressed to Melanie Peterson for her support in the organisation of the meeting and the preparation of the manuscript. We would also like to thank Dr Phillip Brantley, Pennington Biomedical Research Center Associate Executive Director of Scientific Education as well as Julie van Scotter, Assistant Director of Scientific Education for their contributions to the planning and management of the Symposium.
References
Footnotes
Contributors RR and CB were responsible for the development of the scientific content of the symposium and for writing the first draft of the manuscript. The original draft was circulated to all coauthors for critical revision of intellectual content. Final approval of the revised manuscript as edited by RR and CB was obtained from all coauthors.
Funding The consensus meeting that led to the writing of this manuscript was held with the financial support of the Pennington Biomedical Research Foundation, the Pennington Biomedical Research Center Division of Education, the LSU Boyd Professorship and the John W. Barton, Sr. Chair in Genetics and Nutrition. No funding and/or honorarium was provided to any member of the writing group for the production of this manuscript.
Competing interests None declared.
Provenance and peer review Not commissioned; externally peer reviewed.
Patient consent for publication Not required.