Article Text

Abstract
Background Exercise testing in children is widely recommended for a number of clinical and prescriptive reasons. Many institutions continue to use the Bruce protocol for treadmill testing; however, with its incremental changes in speed and grade, it has challenges for practical application in children. We have developed a novel institutional protocol (British Columbia Children’s Hospital (BCCH)), which may have better utility in paediatric populations.
Aim To determine if our institutional protocol yields similar peak responses in minute ventilation (VE), oxygen consumption (VO2), carbon dioxide production (VCO2), respiratory exchange ratio (RER), metabolic equivalents (METS) and heart rate (HR) when compared with the traditional Bruce protocol.
Methods On two different occasions, 70 children (boys=33; girls=37) aged 10–18 years completed an exercise test on a treadmill using each of the protocols. During each test, metabolic gas exchange parameters were measured. HR was monitored continuously during exercise using an HR monitor.
Results Physiological variables were similar between the two protocols (median (IQR); rs): VE (L/min) (BCCH=96.7 (72.0–110.2); Bruce=99.2 (75.6–120.0); rs=0.95), peak VO2 (mL/min) (BCCH=2897 (2342–3807); Bruce=2901 (2427–3654); rs=0.94) and METS (BCCH=16.2 (14.8–17.7); Bruce=16.4 (14.7–17.9); rs=0.89). RERs were similar (BCCH=1.00 (0.96–1.02); Bruce=1.03 (0.99–1.07); rs=0.48). Total exercise time (in seconds) was longer for the BCCH protocol: BCCH=915 (829–1005); Bruce=810 (750-919); rs=0.67.
Conclusion The BCCH protocol produces similar peak exercise responses to the Bruce protocol and provides an alternative for clinical exercise testing in children.
- pediatrics
- treadmill protocol
- validation
- cardiorespiratory function
This is an Open Access article distributed in accordance with the Creative Commons Attribution Non Commercial (CC BY-NC 4.0) license, which permits others to distribute, remix, adapt, build upon this work non-commercially, and license their derivative works on different terms, provided the original work is properly cited and the use is non-commercial. See: http://creativecommons.org/licenses/by-nc/4.0/
Statistics from Altmetric.com
What are the new findings?
This article presents a novel institutional protocol designed to provide metabolic values including peak oxygen consumption for treadmill testing in healthy children.
Our study challenges the limitations of a traditional protocol that is widely used.
The current findings establish a validated, alternate protocol that can be used for pediatric clinical exercise testing, exercise prescription and research studies.
Introduction
Clinical exercise testing is an important component in the assessment of the heart and lungs in response to metabolic stress. The purpose of an exercise test is to assess exercise tolerance, evaluate the safety of exercise for that patient, monitor the effects of a specific intervention (eg, physical training or invasive procedures such as catheterisation or surgery, changes in drug therapy) or assist in guiding exercise prescription.1–3
Exercise tests can be conducted using a variety of exercise-specific modalities (arm or leg ergometers) or upright treadmills for walking, running or wheeling. Treadmill testing has the advantage of extensive clinical use and is a well-established mode of exercise testing in both paediatric and adult patients with cardiac disease.4 5 In addition, it yields the highest heart rate (HR) and oxygen consumption (VO2) due to upright posture and larger exercising muscle mass compared with other modalities such as cycle ergometers.6 As such, children who are ambulatory can be effectively tested by treadmill exercise.
There are a variety of treadmill protocols that are used in both children and adults. These protocols differ in their methodological characteristics, such as stage duration, speed and grade increment (eg, Balke, Astrand, Bruce, Ellestad, Naughton protocols),3 which can impact test performance. Classical protocols using grade variations to adjust exercise intensity during tests are still commonly used despite having limitations for the practical application of laboratory information.7
Traditionally, paediatric centres that use treadmill testing have used the Bruce protocol, a protocol originally designed for diagnosing coronary artery disease in middle-aged men.8 Exercise testing in children presents its own unique challenges largely due to their small body size in relation to the testing equipment and less compliant nature to the exhaustive and monotonous exercise protocol. Especially challenging are very young children and those with chronic illness who are either unfamiliar with exercising to fatigue or unable to keep up with large changes in workload. Although the Bruce protocol has been validated in children,9 10 normative values for metabolic data are limited9 11 and data across age ranges10 often only provides peak exercise times or HR.9 11 When functional capacity or aerobic endurance is not able to be assessed due to low fitness or disease state, clinicians and researchers tend to develop prediction models based on submaximal workload12 or make protocol modifications to achieve peak values (modified Bruce)13 14 leading to a wide heterogeneity in exercise protocols used. This makes it difficult to determine a reliable set of reference values for children15 and reflects the overall challenge in using the Bruce protocol for many paediatric clinics performing exercise testing.
The main criticism of the Bruce protocol is that it has biomechanical limitations due to its large stepwise increases between stages. For children, the work increments between successive stages may be too great, resulting in the tendency for participants to quit prematurely during the first few seconds of a new stage1; thereby, underestimating their aerobic capacity. The long 3 min stages may lead to boredom and, regardless of fitness of the individual, the steep grade may lead to premature peripheral fatigue, ending tests without achieving maximal performance values. This has implications for subsequent exercise prescription where HR or energy expenditure (metabolic equivalents (METS) or VO2) reserves, or perceived exertion might be used to describe intensity.2
VO2max is widely recognised as the best single index of aerobic fitness and is commonly determined during a clinical exercise test.3 The traditional paradigm assumes that VO2 rises linearly with increasing exercise intensity up to a critical point beyond which VO2 plateaus, even though the participant is still able to increase his or her exercise intensity. Continued exercise beyond the plateau of oxygen consumption (VO2max) is supported by anaerobic energy sources and inevitably results in volitional fatigue. A plateau in VO2 is often used as a criterion to determine if a maximal exercise test was achieved. Few children demonstrate a plateau in their VO2 during exercise to volitional fatigue; consequently, peak VO2 is used as a surrogate. In children, some or all of the following criteria are indicative of a peak VO2 test and accepted as synonymous with VO2max: (1) subjective appearance of exhaustion (eg, facial flushing, sweating, unsteady gait); (2) an HR that has levelled off prior to the final exercise intensity or has reached a value near or above 90% of their predicted maximal HR and (3) a respiratory exchange ratio (RER) of at least 1.0.16
We have developed a novel protocol for measuring peak VO2 that has an initial speed and grade of 2.0 miles per hour (mph) and 1%, respectively, with the speed increasing by 0.5 mph every minute until the participant reaches volitional fatigue. With only a speed adjustment, we believe it resolves some of the limitations of the Bruce protocol and may allow for a more refined exercise prescription. The purpose of this study is to determine if our institutional protocol produces similar peak cardiorespiratory values to the Bruce protocol.
Methodology
Study sample
Seventy healthy boys and girls from the local community were recruited for this study divided into three age groups (10–12 years,13–15 years and 16–18 years). All participants were involved in extracurricular sports. Ethical approval to conduct this study was received from the University of British Columbia Children’s and Women’s Health Centre of British Columbia Clinical Research Ethics Boards. Once participants were informed of the procedure, written informed consent and assent was obtained from each subject.
Testing protocol
All testing was completed in the Exercise Physiology Lab in the Heart Centre at British Columbia Children’s Hospital (BCCH), Vancouver, Canada. Study participants were required to come to our lab on two separate occasions to complete two exercise protocols. There was a minimum of 48 hours and a maximum of 2 weeks between testing sessions. Using the Bruce protocol, the speed and grade of the treadmill simultaneously increased every 3 min until volitional fatigue.9 With the BCCH protocol, the incline stayed at a constant 1% grade starting at a speed of 2.0 mph, increasing by 0.5 mph every minute until volitional fatigue (table 1).
Methodological characteristics of British Columbia Children’s Hospital (BCCH) protocol versus Bruce protocol
Prior to the first test, subjects were randomly assigned a test sequence to control for an order-effect bias. Body mass was measured at each visit to the nearest 0.1 kg. Standing and sitting height were measured to the nearest 0.1 cm at the first visit. Sitting height was used to predict age at peak height velocity (APHV) to assess biological maturity.17 Body surface area (m2) and body mass index (BMI, kg/m2) were calculated. BMI was converted to age-specific percentile reference values using Centre for Disease Control and Prevention growth charts.18
Peak VO2test
Metabolic gas exchange parameters (minute ventilation, VE; VO2, carbon dioxide production, VCO2 and RER) were calculated by open-circuit spirometry using a metabolic cart (Moxus Metabolic Cart; AEI Technologies, Pittsburgh, Pennsylvania, USA). The metabolic cart was calibrated prior to each test being conducted using two concentrations of calibration gas (20.9% O2, 0.03% CO2, balance N2 and 15.0% O2, 5.0% CO2, balance N2). Calibration of the turbine flow metre of the volume sensor was performed with a standard 3L syringe (5570 Series; Hans Rudolph, Kansas City, Missouri, USA). Gas-exchange was measured continuously during each test using a breath-by-breath method and averaged over 15 s intervals. VE, tidal volume (VT), breathing frequency (FB) and ventilatory equivalents for VO2 (VE/VO2) and VCO2 (VE/VCO2) during the exercise test were recorded. HR was monitored continuously during exercise using an E600 Polar Heart Monitor transmitter/receiver pair (Polar Electro Canada, Lachine, Quebec, Canada). Study participants wore a small flexible rubber mouthpiece in their mouth. The mouthpiece was attached to a one-way, non-rebreathing valve (Style 2700B; Hans Rudolph, Shawnee, Kansas, USA) that was connected to the metabolic cart. Peak VO2 (L/min, mL/min/kg), VT (mL/breath), b (breaths/min), VE (L/min), VO2 (L/min, mL/min/kg), VCO2 (L/min, mL/min/kg) and RER were measured, and METS were calculated by dividing peak VO2 by 3.5. The speed and grade of the treadmill were adjusted according to the protocol used (table 1). Participants were provided with verbal encouragement to achieve volitional fatigue and discouraged from holding handrails during the test. Criteria for completion of a valid peak VO2 test included two of the following three criteria: (1) an HR ≥195 beats per minute; (2) an RER ≥1.0 and (3) volitional fatigue. Systolic and diastolic blood pressure (sBP and dBP) was taken at rest and immediately postexercise. BP was obtained from the right arm by auscultation where diastolic pressure was defined by muffling of the Korotkoff sounds (phase V unless the dBP was heard to zero then phase IV was used).
Statistical analysis
Sample size (Gpower, Version 3.1)19 was determined a priori, α=0.05, β=0.80, using a correlation coefficient r=0.84 (based on our preliminary, unpublished work in 10-year-old boys comparing peak VO2 using each protocol) yielding a sample size of 9. Since we wanted to develop comparison data for various age groups and sexes, we chose 10 participants for each of three age groups for both males and females; 10–12 years; 13–15 years; 16–18 years, with the goal to recruit 60 study participants in total. The distribution of variables was assessed using visual inspection (histogram) and a Shapiro-Wilk test for normality. Non-parametric data were analysed and expressed as median (IQR) and Spearman’s rank correlations (rs) generated for key variables: peak exercise HR, sBP and dBP (at rest and immediately postexercise), VE, VO2 (absolute, relative and predicted), RER (VCO2 L/min/ VO2 L/min), total exercise time (s) and estimated energy expenditure (METS). Differences between protocol medians were compared using a Wilcoxon matched pairs signed-ranks test. All tests were two-sided and significance was set at p <0.05. Statistical analyses were completed using IBM SPSS statistical software version 23.0. To investigate the agreement between the two protocols, we performed a Bland-Altman analysis (SigmaPlot software version 13;Systat Software, San Jose, California, USA). Plots were generated showing the bias between mean differences and limits of agreement (LOA).
Results
Participant characteristics (n=70, median age 14.4 years) are shown in table 2. We were able to predict maturation from sitting height for n=55 children. Age at peak height velocity (APHV) and time to APHV are shown in table 3. All participants were considered healthy in terms of percentile cut-points for BMI.
Participant characteristics
Age at peak height velocity (APHV)
VE, relative and absolute VO2 and METS were strongly correlated, all rs>0.80 (table 4). Furthermore, a Bland-Altman analysis showed a high LOA between the two protocols (figure 1; table 4).
Metabolic data
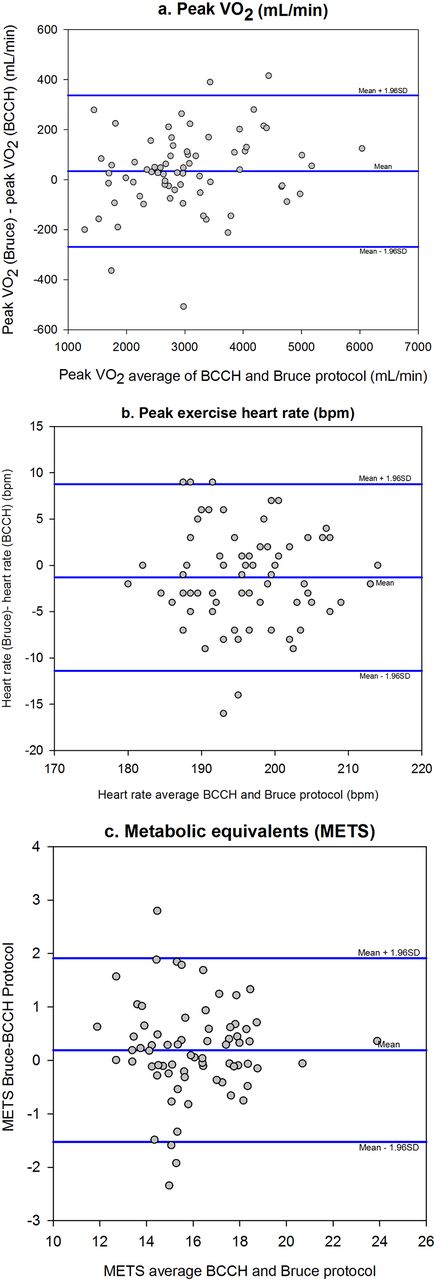
Bland-Altman analysis comparing two methods—British Columbia Children’s Hospital (BCCH) versus Bruce.
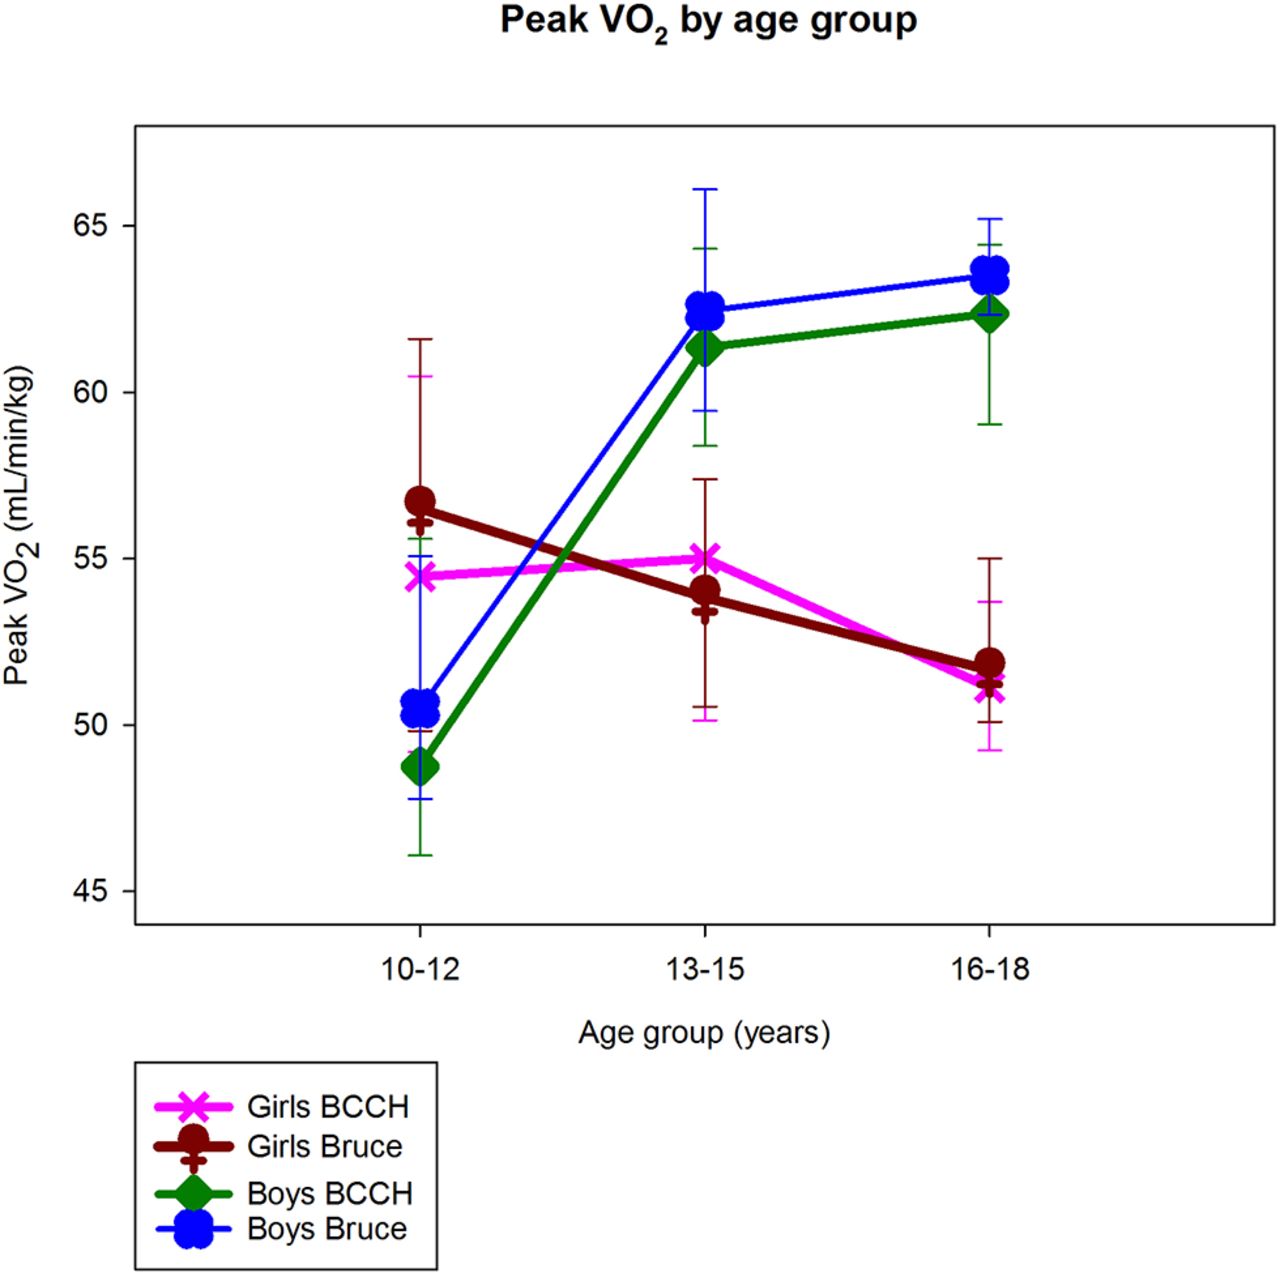
The median peak exercise stage achieved on BCCH was 15 (13–16) with a peak speed of 9.0 mph (8.0–9.5) (or 4.0 (3.6–4.2)m/s). The median peak exercise stage achieved on the Bruce protocol was 4 (4–5) with a peak speed of 4.2 mph (4.2–5.0) (or 1.9 (1.9–2.2) m/s at peak). VT (median 1809 mL/breath for BCCH and 1921 mL/breath for Bruce protocol; rs=0.93; p<0.001) and FB (median 58 breaths per minute (bpm) on BCCH and 54 bpm for Bruce) (rs=0.78; p<0.001) were similar between protocols. Eight participants did not achieve a maximal test during the BCCH and 9 did not achieve a maximal test during the Bruce based on the defined criteria. Group medians for relative peak VO2 for BCCH and Bruce protocols by age and sex are shown in figure 2.
Age-sex patterns in peak VO2 for each protocol—British Columbia Children’s Hospital (BCCH) and Bruce.
Discussion
We have shown that our institutional BCCH protocol yields similar peak responses in VE, VO2, VCO2, RER, METS and HR when compared with the Bruce protocol. Our Bland-Altman plots show strong LOA and, as such, the BCCH protocol may serve as an alternative clinical exercise testing protocol in children.
The goal of peak effort exercise testing in children is to get an objective measure of a child’s fitness. Although peak VO2 during childhood and adolescence is well documented,20–22 other aspects of aerobic fitness during youth are less well-understood, such as the VO2 kinetics at smaller incremental intensities, which inhibits our ability to get a true understanding of a child’s ability to run and transport body mass to provoke adaptation to physical activity.
The BCCH protocol provides utility for both clinical and non-clinical exercise testing in children. Our protocol requires children to run at an earlier stage and at faster speeds. Generally, the transition from walking to running occurs at 4.5–5.0 mph or 6–7 min into the BCCH protocol in contrast to the Bruce protocol where a slow run may not occur until 9 min at stage 4 (4.2 mph; 16% grade) of the protocol. Running at an earlier stage and at higher speeds allows clinicians to evaluate symptoms such as chest pain, palpitations and/or dyspnoea that are often reported with running in school or during other sporting activities. In our experience, children often complain of increased feelings of fatigue and leg discomfort while running uphill, which may lead to early test termination during the Bruce protocol. The BCCH protocol may alleviate some of these complaints of peripheral fatigue as the grade is held constant at 1% for the duration of the test. The addition of the 1% grade in our protocol allows us to quantify work (product of weight (mass) of a person and vertical distance achieved by walking or running up an incline).
Sgherza et al 23 suggest that peak VO2 test termination may be associated with perceived exertion, rather than by any physiological limitation.23 Barker et al 22 have shown that using secondary criteria such as RER, HR or effort to verify a maximal effort (peak VO2) in young people during ramp cycling exercise may result in undervaluing a true maximum.22 Supramaximal testing where the child is immediately retested at intensities greater than the one that had produced an exhaustive effort on the first test (generally, between 5% and 10% greater intensities are added) would need to have been performed to illustrate if a true maximal test was achieved.24 25 As the focus of this study was to determine if the metabolic responses were similar between the two testing protocols rather than to determine the true maximal value for VO2, we did not perform supramaximal testing.
For the exercise scientist, the BCCH protocol may be useful to evaluate the effects of training and rehabilitation programs and to determine target intensities for exercise prescription. Optimal exercise intensity domains for training prescription should be anchored to the ventilatory threshold, TVENT (ie, moderate exercise (below TVENT) or heavy exercise (above TVENT));22 or alternately, at some percentage of HR reserve or METS.2 The BCCH protocol provides an alternative to treadmill exercise at slow speeds and steep grades and is more complementary to normal physical activity. It is known that uphill running requires higher energy expenditure than level running.26 It is possible that the Bruce protocol, which starts at a steeper grade (10% in Bruce compared with 1% in BCCH) may not characterise VO2 kinetics for exercise transitions in regular activity prescription as participants may recruit their type II muscle fibres earlier resulting in greater anaerobic metabolism.27 The BCCH protocol, with a similar ability to the Bruce protocol to determine peak performance, provides a strong relationship between work rate and gas-exchange making it easier to relate intensities for regular activity prescription.
Our findings on age–sex patterns in peak VO2 when normalised for body weight are consistent with those described by Armstrong et al.16 Armstrong states that while boys show an almost linear increase in peak VO2 in relation to age, girls’ data demonstrate a similar but less consistent trend, with a progressive rise to age 13 and then a levelling off or slightly decreasing at around 14 years of age.16 Prepubertal boys’ peak VO2 is higher than those of girls and the sex difference becomes more pronounced as children progress through adolescence.16 Our boys had lower peak VO2 scores for the age group of 10–12 years than our girls of the same age group, likely because our boys were mostly 10-year olds and our girls were closer to 12 years of age. In the older age groups, the expected gender differences between boys and girls was observed with peak VO2 declining through adolescence in girls.
Limitations
Our participants were healthy, physically active children who were involved in sports outside of school and our findings may not be representative of a true ‘normal’ population. Without a change in grade, we found that healthy, physically active children tend to run slightly longer to yield the same peak performance parameters from the BCCH protocol compared with the Bruce protocol. It is unclear if this would hold true in less fit healthy children or in clinical populations (such as children with congenital heart disease). We specifically chose a physically active group to ensure consistency in performance. As such, we did not test younger age groups (<10 years) due to difficulties in getting consistent performances with metabolic testing on two different occasions.
Our RER values may be slightly lower at peak exercise than those previously reported. We suspect that this may be related to the flow turbine that was used in our metabolic cart system. Given that the same equipment was used for both tests, we believe that our finding that the two protocols produce similar responses is valid. Future investigation using supramaximal testing would allow us to determine if a true peak VO2 was achieved during both protocols.
Conclusion
The BCCH and Bruce treadmill exercise protocols yield similar exercise responses in children aged 10–18 years. The BCCH protocol provides an alternative testing protocol for use in children and may have better utility for testing children.
References
Footnotes
Acknowledgements We thank our study participants for volunteering their time to complete the study. The results of the study are presented clearly, honestly and without fabrication, falsification or inappropriate data manipulation.
Funding This study was supported by funding from the Douglas College Research and Scholarly Activity Fund Research Incentive Grant.
Competing interests None declared.
Ethics approval University of British Columbia Children's and Women's Health Centre of British Columbia Clinical Research Ethics Board.
Provenance and peer review Not commissioned; externally peer reviewed.