Article Text

Abstract
Objective To assess the incidence, severity and nature of injuries, to determine risk factors for injury and to identify potential injury prevention strategies in men's international Rugby-7s tournaments.
Design A prospective cohort study.
Participants Players from core teams competing in matches at 6 Sevens World Series from 2008/2009 to 2014/2015.
Results The incidence of injury across all Series was 108.3 injuries/1000 player-match-hours (backs: 121.0; forwards: 91.5) with a mean severity of 44.2 days (backs: 46.1; forwards: 40.9) and a median severity of 28 days (backs: 29; forwards: 26). The proportion of injuries sustained in the second half was significantly higher (60%; p<0.001) than the first half of matches and the proportion increased from match to match and day to day in a tournament. The knee (17.4%), ankle (15.9%) and posterior thigh (13.2%) were the most common injury locations for backs and the knee (18.5%), head/face (17.3%) and shoulder/clavicle (13.0%) for forwards. The four most common injuries across all players were knee ligament (13.0%), ankle ligament (12.8%), concussion (10.4%) and posterior thigh muscle strains (9.8%).
Conclusions The incidence of injury in Rugby-7s suggests that teams require squads of around 20 players for a Sevens World Series. The higher incidence of injury in the second half of matches is probably the result of player fatigue; therefore, injury prevention strategies for teams and the Governing Body should address this issue. The results presented support the World Rugby trial allowing ‘rolling substitutes’ during Sevens World Series matches, as this approach may help to mitigate the effects of player fatigue during the second half of matches.
- Contact sports
- Epidemiology
- Fatigue
- Prevention
- Rugby
Statistics from Altmetric.com
Introduction
Rugby-7s is a form of rugby union (rugby) with a rapidly growing popularity:1 the annual Sevens World Series (SWS) represents the highest level of competition and the most popular tournament.2 Rugby-7s is played on the same pitches as those used for Rugby-15s; therefore, since Rugby-7s involves only seven players in each team, the tactics are different and the physical demands on players higher than those in 15-a-side rugby (Rugby-15s).2 Higham et al3 found the physiological and performance characteristics of Rugby-7s players to be relatively uniform across playing positions, which contrasts with the characteristics of players in Rugby-15s. These authors reported that Rugby-7s required players with superior aerobic and anaerobic endurance capacity compared to Rugby-15s and that players' movement patterns reduced in the second half of matches but were similar from match to match and day to day in multiday tournaments.3 ,4
A preliminary, one-season epidemiological study indicated that the incidence and severity of injuries in Rugby-7s was higher than that observed in Rugby-15s,5 which led World Rugby to introduce an annual injury audit of the SWS to provide a detailed assessment and understanding of the injury risks. The aims of the current research were therefore to report the anthropometric characteristics of players, the incidence, severity and nature of injuries, injury causation factors and to identify potential injury prevention strategies for Rugby-7s.
Method
The study followed a prospective cohort design. It included collection of data for 16 core teams (Argentina, Australia, Canada, England, Fiji, France, Japan, Kenya, New Zealand, Portugal, Samoa, Scotland, South Africa, Spain, the USA and Wales) in six men's SWS (2008/2009, 2010/2011 to 2014/2015). All players provided written consent for their injury data to be recorded. Each Series consisted of 8 or 9 tournaments (Australia, Dubai, England, Hong Kong, Japan, New Zealand, Scotland, South Africa and the USA) with each team playing 5 or 6 matches at each tournament over a period of 2 or 3 days. Tournaments were normally scheduled as back-to-back pairs in consecutive weeks with a 5 to 7-week rest period between pairs of tournaments. The 16 countries involved in each tournament consisted of 15 core teams plus one additional non-core team.
A study manual was provided to teams prior to the start of each Series: all definitions and data collection protocols followed the recommendations included in the international consensus statement for epidemiological studies in rugby.6 An injury was defined as: “Any injury sustained during a SWS tournament match that prevented a player from taking a full part in all normal training activities and/or match play for more than one day following the day of injury”. Injuries were classified by the country's physician or physiotherapist using the Orchard Sports Injury Classification System (OSICS 8).7 Location, type, severity and time of injury together with the event leading to the injury were recorded. Match exposure data were based on the tournament schedule and 7 players participating for 14 min per match apart from the cup final match, which lasted 20 min. Players' age, stature (cm) and body mass (kg) were recorded by the country's team physician or physiotherapist prior to the start of each Series or when they were added to the team. Data describing the nature (ball-in-play, passes, rucks/mauls, kicks, scrums, lineouts) of matches in SWS tournaments from 2008/2009 to 2014/2015 were obtained from World Rugby's game analysis reports.8
Players' baseline data were summarised as means (SD), incidence of injury as injuries/1000 player-match-hours with 95% CIs and injury severity as the mean (days; 95% CI) and median (days; 95% CI).9 t Tests were used to identify differences in the anthropometric measurements of player groups. χ2 Tests were used for identifying differences in numbers of injuries; Z-tests for differences in incidence, mean severity and proportions of injuries; Mann-Whitney U tests for differences in median severity.9 Trends in anthropometric data, incidence and match parameters were assessed on the basis of linear regression analyses (StatPlus:mac LE.2009) of Series data over the study period.9 Since statistical tests were completed for a large number of factors, significance was accepted if the p value was <0.01; p values <0.05 were taken to indicate that a result may be significant but further investigation would be required to confirm the result.
Results
Table 1 summarises a range of match characteristics over the period 2008/2009 to 2014/2015:8 there was no evidence to suggest that any of these parameters changed significantly over this period.
Match statistics for a range of SWS playing characteristics from 2008/2009 to 2014/2015
Players' mean age, stature and body mass are shown, as a function of playing position and Series, in table 2 together with p values for the regression analyses across the time period studied. Forwards were significantly (p<0.001) older, taller and heavier than backs but there were no significant trends in the data over time.
Anthropometric data of the sample populations as a function of playing position and Series
In total, 702 match injuries (backs: 448; forwards: 254) and 6480.5 player-match-hours of exposure (backs: 3703.1; forwards: 2777.4) were recorded (table 3). The mean incidence of injury for all players over all Series was 108.3 injuries/1000 player-match-hours (backs: 121.0; forwards: 91.5), the incidence of injury for backs over the six Series being significantly (p<0.001) higher than that for forwards. There is an indication that the incidence for backs may have increased (p=0.041) over the study period, but there was no evidence of change for forwards (p=0.992).
Number, exposure (player-match-hours) and incidence (injuries/1000 player-match-hours, 95% CI) of match injuries as a function of playing position and Series
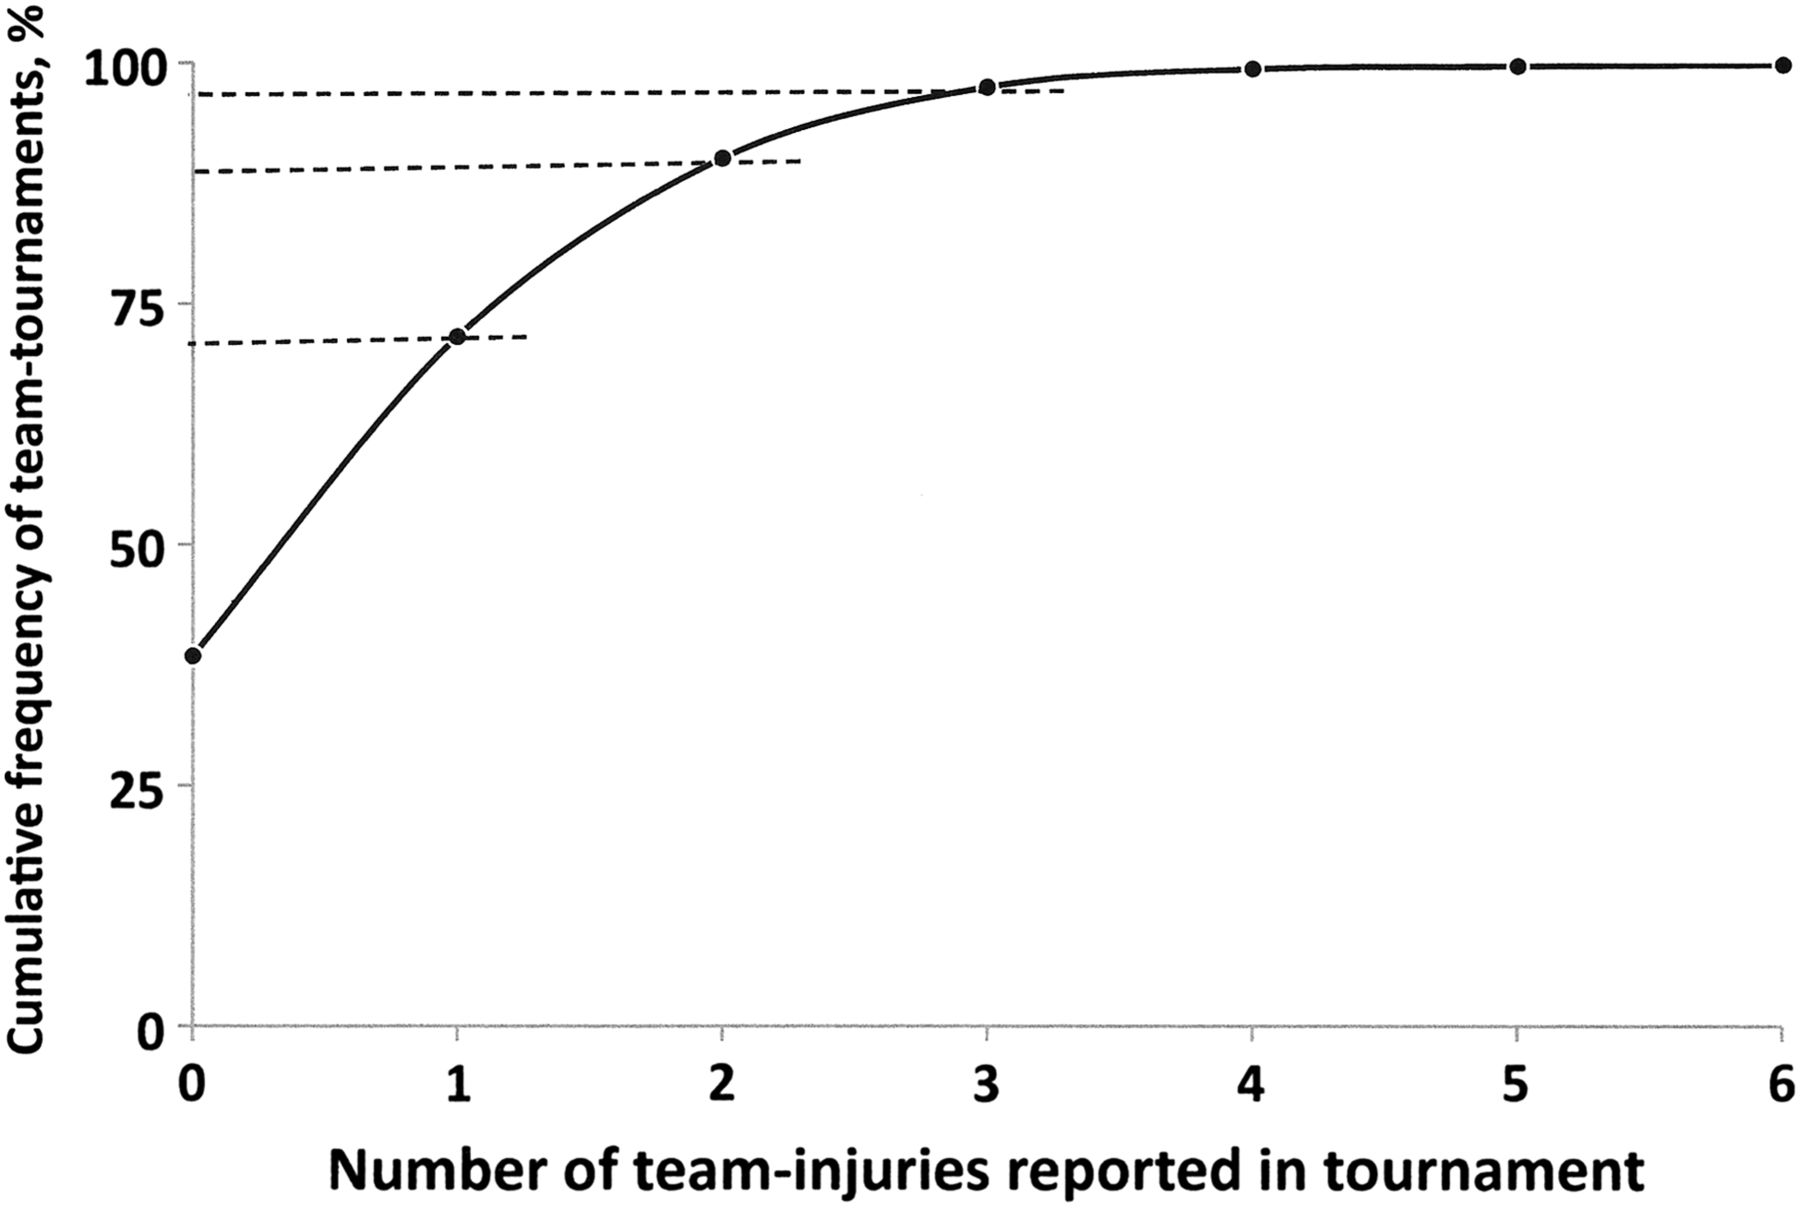
Figure 1 presents the cumulative percentage of team tournaments as a function of the number of injuries reported by teams at tournaments.7 Teams reported no injuries for 38% of the team tournaments, 1 team injury for 33%; 2 team injuries for 19%; and 3 or more team injuries for 10% of team tournaments.
Table 4 summarises the mean and median severities of injuries sustained by backs and forwards and figure 2 presents the cumulative frequency of injuries as a function of injury severity.
Mean and median severities of match injuries sustained as a function of playing position and Series

Cumulative percentage of team tournaments as a function of the number of team injuries reported.

Cumulative frequency of all injuries as a function of injury severity.
There are no statistically significant differences between backs and forwards for the mean (p=0.197) or median (p=0.307) severity and there were no significant trends in severity for backs (mean: p=0.488; median: p=0.115) or forwards (mean: p=0.843; median: p=0.055). There were also no significant differences in the mean severities sustained in the first half compared to the second half of matches for either backs (p=0.503) or forwards (p=0.447). Approximately 10% of all injuries were resolved within 6 days (period between paired tournaments: 6 days), which meant that ∼90% of players injured in the first of two paired tournaments were unavailable for the second tournament; the severity of ∼45% of all injuries resulted in injured players missing at least the next set of paired tournaments (ie, severity ≥30 days); ∼20% of injuries resulted in players missing at least two sets of paired tournaments (ie, severity ≥60 days); and ∼12% of injuries resulted in players missing three or more sets of paired tournaments (ie, severity ≥90 days).
The locations and types of all injuries sustained are shown in tables 5 and 6, respectively.
Locations of injuries sustained as a function of playing position and Series
Types of injuries sustained as a function of playing position and Series
In terms of injury location, there was an indication (p=0.026) that backs generally sustained more lower limb injuries than forwards and, in particular, significantly (p<0.001) more injuries to the posterior thigh. For injury type, there was an indication that backs sustained more muscle strains (p=0.017) than forwards. The four most common injuries sustained across all players were knee ligament (13.0%), ankle ligament (12.8%), concussion (10.4%) and posterior thigh muscle strains (9.8%). Only concussion showed an indication (p=0.023) of an increasing trend in incidence over the study period;10 this is most likely a consequence of increased awareness of this type of injury among players, medical staff and coaches and the introduction of a head injury assessment protocol in 2013/2014.
Table 7 summarises the nature (acute, gradual onset) and cause of onset (contact, non-contact) of all injuries.
Nature and cause of onset of all injuries sustained as a function of playing position and Series
The timing of when match injuries were sustained was examined in detail, in terms of the match half (first, second); daily-match-number (first, second, third) and match day (first, second); table 8. For this analysis, matches played in tournaments taking place over 3 days (Australia: 1 tournament; Hong Kong: 6 tournaments; USA: 4 tournaments) were excluded because 3-day tournaments involve different numbers of matches on each day compared to 2-day tournaments.
Timing of injuries as functions of match half, match number and tournament day
All teams taking part in a tournament play three matches on day 1 and two matches on day 2: only 10 of the 16 teams play a third match on day 2, as 6 losing teams in the second round do not progress to the third round. Therefore, to allow comparisons, one would expect 29 injuries in the first half, 86 injuries in the second half and 115 injuries in total to be sustained in the third round of matches on day 2 if 16 team matches were played. Overall, significantly more injuries were sustained in the second half of matches compared to the first half (p<0.001); there was an indication that more injuries were sustained on day 2 compared to day 1 (p=0.023), but there was no difference in the numbers of injuries sustained in the first, second or third match of either day (p=0.926). In terms of the proportion of second to first half injuries, this proportion increased from the first to the third match on day 1 (0.58 to 2.07) and day 2 (1.48 to 3.00), with the highest proportion occurring in the 20 min day 2 third round Cup Final match (4.17). In terms of when specific injuries were sustained, posterior thigh muscle strains (p<0.001) and shoulder dislocations (p=0.004) were significantly more likely to be sustained in the second half of matches than the first half; there were also indications that anterior thigh muscle strains (p=0.020), knee lesion of meniscus injuries (p=0.029) and knee ligament sprains (p=0.019) were more likely to occur in the second half of matches. No specific injuries were statistically more likely to occur in the first than the second half of matches and there were no statistically significant differences for when specific injuries were sustained in terms of the tournament day or the match number on any day.
The match activities identified as the causes of first and second half injuries are summarised in table 9. The distribution of these match events is significantly different in the second half of matches for backs (p<0.001) and there is an indication (p=0.037) that it may also be different for forwards. In terms of specific match activities, backs sustain significantly (p<0.001) more non-contact, running injuries in the second half and there is an indication that there may be more injuries from rucks. There is an indication that forwards may also sustain more injuries from rucks in the second half.
Match activities leading to injuries sustained in the first and second halves of matches
Discussion
This is the first detailed study investigating the risk of injury in international Rugby-7s. Analysis of several aspects of the matches identified no statistically significant changes in the character of the game in the period 2008/2009 to 2014/2015; however, the data available do not provide information separately for backs and forwards and do not allow some important aspects of the game, such as number of tackles, acceleration efforts and player distances travelled, to be explored. Analysis of anthropometric data shows that there were no significant changes in player characteristics over the period of this study: the cohort of players was, however, significantly (p<0.001) younger, shorter and lighter than the Rugby-15s cohorts involved in the 2007 and 2011 Rugby World Cups (RWCs).11 ,12
The overall incidence of injury (108.3 injuries/1000 player-match-hours) was 25% higher than that recorded for Rugby-15s players at the 2007 and 2011 RWCs (86.5 injuries/1000 player-match-hours; p<0.001);11 ,12 while the incidence for backs was significantly higher (121.0 injuries/1000 player-hours; p<0.001) than observed for backs at the RWC (88.8 injuries/1000 player-hours), the difference for forwards was not significant (SWS: 91.5 injuries/1000 player-match-hours; RWC: 84.5 injuries/1000 player-match-hours; p=0.418).11 ,12 The mean and median severities of injuries for backs and forwards were significantly higher (p<0.001) during the SWS than the RWCs.11 ,12 In terms of the location and type of injury, the major differences were the higher proportions of lower limb injuries sustained in the SWS, in particular injuries to the ankle and knee, together with higher proportions of joint (non-bone)/ligament injuries.11 ,12 The higher incidences and severities of injury mean that injury burdens for backs (5578 days/1000 player-match-hours) and forwards (3742 days lost/1000 player-match-hours) are two to three times higher in the SWS than the RWCs (backs: 1856 days/1000 player-match-hours; forwards: 1487 days/1000 player-match-hours). These differences in incidence and injury severity may be related to the higher ball-in-play times observed in Rugby-7s and the faster pace of the Rugby-7s game compared to Rugby-15s.4 ,8
In order to develop injury prevention strategies, it is important to identify the reasons for the higher incidence and severity of injuries in Rugby-7s. Countries competing in the SWS undertake significant international air travel prior to competition, often involving multiple time zone shifts, and it has been suggested that this travel may create physiological responses due to jet lag leading to an increased number of injuries. However, a previous investigation addressing this specific issue did not find a significant travel effect and confirmed that there was no significant difference in the incidence of injury between the first and second of the paired tournaments.13
An important finding of the current study was that significantly more injuries were sustained in the second half of matches compared to the first half and that the proportion of injuries sustained in the second half of matches increased progressively from match 1 to match 3 each day and from day 1 to day 2. This indicates that players may be subject to a fatigue effect as tournaments progress, resulting from the high short-term physiological demands placed on players due to the speed and intensity of Rugby-7s matches.3 ,14 Previous match analysis studies concluded that although players fatigue during individual matches, fatigue was transient and did not persist from match to match or day to day during multimatch, multiday tournaments.4 ,15 ,16 While this is, in general, consistent with the overall match-to-match and day-to-day results obtained in this study, it is not consistent with the increasing proportion of second half injuries observed from the start of day 1 to the end of day 2.
It is known that fatigued muscles are less able to absorb energy, and therefore more likely to fail and result in injury, than non-fatigued muscles.17 ,18 The majority of hamstring muscle strains recorded in this study resulted from running activities and the higher incidence in the second half could be related to muscle fatigue.3 ,15 ,19 Cortes et al20 reported that knee kinematics and ground reaction forces of fatigued athletes were affected significantly during side-stepping, cutting actions and they postulated that the resultant loss of coordination could increase the likelihood of sustaining knee-ligament injuries. Fatigued hamstring and quadriceps muscles have also been implicated as risk factors for knee ligament injuries in sports involving running and cutting activities;21 ,22 furthermore, Takarada23 postulated that damaged muscles, which were the result of contact events and sprinting activity, increased the risk of lower limb ligament sprains due to increased joint laxity. Rugby-7s involves many rapid, side-stepping cutting actions, especially by the fast-running backs: it is not surprising, therefore, that knee and ankle joint ligament injuries were identified as common injuries in SWS and were significantly more common in the second half of matches. The shoulder complex is an inherently weak unstable structure24 and is one of the most common sites of injury in rugby:25 any factor that reduced its strength and stability is therefore likely to increase the risk of injury. Several authors have identified player fatigue as a cause of reduced proprioception in the shoulder,26–30 which would impact on a player's tackle technique, to an extent that it could increase the risk of shoulder injury.
From the previous discussion, it can be concluded that training regimens that reduce fatigue levels, especially in the second half, and maintain players' movement patterns and coordination when fatigued would most likely reduce the incidence of joint ligament injuries in Rugby-7s. An evaluation of running intensity and energy demands in Rugby-7s resulted in a recommendation that training drills should replicate the physiological demands experienced in matches.31 ,32 Earlier substitution of fatigued players in matches may also help to reduce the incidence of injuries; therefore, the use of rolling substitutions, which is being trialled by World Rugby, could contribute to a reduction in fatigue levels. In addition, considering the high proportion of second half to first half injuries sustained in the final tournament match, the reasons for this match to last 20 min should be reviewed. It is recognised, however, that the introduction of rolling substitutions may raise other injury-related issues, and therefore the effects of rolling substitutions should be carefully monitored.
The high incidence and severity of injuries in Rugby-7s creates critical consequences for countries competing in the SWS, in ways that do not arise in other team sports. On the basis of the observed incidence of 108 injuries/1000 player-match-hours and the assumption that this follows a Poisson distribution, the probability of teams sustaining a particular number of injuries at each stage of a SWS tournament can be calculated.9 For example, after a team has played five matches, there is a 41% probability that the team would have sustained no injuries; a 37% probability of sustaining one injury; a 16% probability of two injuries; a 5% probability of three injuries; and a 1% probability of four injuries. Taking into account that 16 teams take part in each SWS tournament, it can be predicted that after five matches, six or seven teams would not have sustained an injury; five or six teams would have sustained one injury; two or three teams would have sustained two injuries; and one team would have sustained three injuries. Although not allowed under the Laws of the Game in place during this study, increasing the team squad size from 12 to 15 players for each SWS tournament would ensure that a full complement of 12 fit players (7 on-pitch and 5 on-bench substitute players) available for all matches. A trial introduced by World Rugby for the 2015/2016 SWS allowing five substitutions per match, irrespective of how many substitutes are available on the bench (eg, 5 substitutes used once each or two substitutes used on 5 occasions), may go some way towards alleviating the disadvantage for teams with less than 12 fit players by the sixth match. The schedule for the SWS also means that most players injured in the first of two paired tournaments (∼90%; see figure 2) would not recover before the second paired tournament took place (usually 6 days after the first tournament). Since around 60% of teams sustain at least one injury per tournament, ∼50% of teams entering the second of two paired tournaments do not have a full complement of 12 players, unless they have standby players available at short notice for the second tournament. Furthermore, the severity of injuries means that ∼45% of injured players would not return before the next pair of tournaments took place (∼1 month after the previous tournament) and ∼20% of injured players would miss two sets of paired tournaments (∼2 months later); see figure 2. Taking this into account, a team competing in a 9-tournament SWS would probably require a full squad of ∼20 players to cover the whole Series, of which 12 players would travel to a tournament with the remaining players receiving treatment for injuries (0–6 players) or resting (2–8 players); the exact numbers in each group are dependent on how many tournaments had already been played in the Series.
The recommendations from this study are that (1) the SWS schedule should take account of the risk of injury to ensure that all teams can compete in tournaments on equal terms; (2) the necessity for the final tournament match to last 20 min should be reviewed; (3) the trial of rolling substitutions should be evaluated so that the change, if beneficial in terms of injury reduction, can be made permanent; and (4) injury prevention should be a priority in Rugby-7s for individual teams and the Governing Body.
What are the findings?
The knee is the most common injury location and ligament injuries the most common type.
The incidence of injury in the second half of Rugby-7s tournament matches is significantly higher than in the first half.
The incidence of injury in the second half of Rugby-7s tournament matches increases as the tournament progresses from match to match and day to day.
How might it impact on clinical practice in the future?
Highlights the high incidence of injury in rugby-7s and the need for adequate medical support.
Promotes the importance of players' prematch conditioning to minimise the effects of player fatigue in rugby-7s tournaments.
Identifies the need to implement effective injury prevention strategies focused on reducing the risk of knee injuries.
Acknowledgments
The authors acknowledge the valuable support provided by the medical teams working with the 16 participating teams during the six Sevens World Series who provided the players' detailed injury data: Akbar Bhamji, Alan Davies, Andrew Cooke, Angel De Lanuza Torres, Ashley James, Atsushi Tasaki, Avi Carroll, Ben Searle, Bernard Zabotto, Brett Davison, Brian Green, Cameron Watson, Carla Brash, Cesar Corte Goncalves, Dan Jones, Dan Moore, Danielle Mah, Garcia Orsetti Gohzalo, Gemma Scott, George Odhiambu, Gruff Parsons, Guillermo Zurdo Gallo, Hugh Everson, Hugo Peralta, Isabel Grondin, Jennifer Khalik, John Mitchell, Jonathon Moses, Jose Carlos Rodrigues, Josh Bird, Juan Martin Zucchiatti, Karolina Unaisi Vunibaka, Katherine Rottier, Katie Ryan, Kerry Kirk, Kim Oslund, Kristen Douhan, Lamech Francis, Laurent Tiffounet, Marc Julia, Marco Caldo, Mathew Siliga Amituanai, Matt Wenham, Mike Keating, Nicolas Barizien, Nikki Blanchflower, Paul Cameron, Philippe Coste-Garriguet, Philippe Turblin, Rafael Lazaro Fernandez, Remi Mobed, Scott McAllister, Tim McGrath, Una Vunibaka, William Koong.
References
Footnotes
Contributors CWF designed and implemented the study, analysed the data and wrote the first draft. Prepared and approved the final submission. AET implemented the study, reviewed and edited the first draft: approved the final submission. MR approved the study, reviewed the initial results and edited the first draft: approved the final submission.
Funding The study was funded by World Rugby, Dublin, Ireland.
Competing interests CF is an independent consultant in sport risk management and implements injury surveillance studies at international rugby tournaments on behalf of World Rugby. MR is World Rugby's Chief Medical Officer.
Ethics approval World Rugby Institutional Ethics Committee.
Provenance and peer review Not commissioned; externally peer reviewed.