Article Text

Abstract
Objective In this work, whether a two-bout exercise protocol can be used to make an objective, immediately available distinction between non-functional over reaching (NFO) and overtraining syndrome (OTS) was studied.
Design Underperforming athletes who were diagnosed with the suspicion of NFO or OTS were included in the study. Recovery of the athletes was monitored by a sports physician to retrospectively distinguish NFO from OTS.
Setting Sports medicine laboratory
Participants The protocol was started and completed by 10 underperforming athletes. NFO was retrospectively diagnosed in five athletes, and OTS was diagnosed in five athletes.
Interventions A two-bout maximal exercise protocol was used to measure physical performance and stressinduced hormonal reactions.
Main outcome measurements Exercise duration, heart rate and blood lactate concentration were measured at the end of both exercise tests. Venous concentrations cortisol, adrenocorticotrophic hormone (ACTH), prolactin and growth hormone were measured both before and after both exercise tests.
Results Maximal blood lactate concentration was lower in OTS compared with NFO, while resting concentrations of cortisol, ACTH and prolactin concentrations were higher. However, sensitivity of these measures was low. The ACTH and prolactin reactions to the second exercise bout were much higher in NFO athletes compared with OTS and showed the highest sensitivity for making the distinction.
Conclusions NFO might be distinguished from OTS based on ACTH and prolactin reactions to a two-bout exercise protocol. This protocol could be a useful tool for diagnosing NFO and OTS; however, more data should be collected before this test can be used as the gold standard.
Statistics from Altmetric.com
The goal in training competitive athletes is to provide training loads that are effective in improving performance. At some stages during the training process, athletes may experience an unexplainable decrease in performance. This might happen when prolonged excessive training takes place concurrent with other stressors and insufficient recovery. This unexplainable performance decrements can result in chronic maladaptations that can lead to the overtraining syndrome (OTS). A keyword in the recognition of OTS might be “prolonged maladaptation” not only of the athletic performance but also of several biological, neurochemical and hormonal regulation mechanisms. When athletes deliberately use a short-term period (eg, training camp) to increase training load, they can experience short-term performance decrement, without severe psychological or lasting other negative symptoms.1 2 This functional over reaching (FO) will eventually lead to an improvement in performance after recovery. However, when athletes do not sufficiently respect the balance between training and recovery, non-functional over-reaching (NFO) can occur.1 2 At this stage, the first signs and symptoms of prolonged maladaptation such as performance decrements, psychological disturbance (decreased vigour, increased fatigue) and hormonal disturbances are present, and the athlete will need weeks or months to recover. The distinction between NFO and OTS is very difficult and will depend on the clinical outcome and exclusion diagnosis.
The recent “consensus statement” of the European College of Sport Science indicates that the difference between NFO and OTS is the amount of time needed for performance restoration and not the type or duration of training stress or degree of impairment.1 In essence, it is generally thought that symptoms of OTS, such as fatigue, performance decline and mood disturbances, are more severe than those of NFO. However, there is no scientific evidence to either confirm or refute this suggestion.1 The distinction between NFO and OTS is most of the time based on “time to recover”. Hence, there is a need for objective, immediately available evidence that the athlete is indeed experiencing OTS.
Most of the literature agrees that FO, NFO and OTS must be viewed on a continuum with a disturbance, an adaptation and finally a maladaptation of the hypothalamic–pituitary–adrenal axis (HPA), resulting in an altered hormonal response to intense training and competition.3,–,12 When investigating hormonal markers of training adaptation, it is important to target specific hormones for their information potential and to synchronise their sampling in accordance with their response patterns.
The hypothalamus is under the control of several “higher” brain centres and several neurotransmitters 13 known to play a major role in various neuroendocrine and behavioural functions, for example, activation of the HPA axis, feeding and locomotion.14 Therefore, the typical HPA axisrelated hormones cortisol, adrenocorticotrophic hormone (ACTH), prolactin (PRL) and human growth hormone (GH) were targeted in the present study.
It should be emphasised that, depending on the training status, the time the hormone measurements are taken (diurnal variation), urinary, blood and salivary measures create a great variation inthe interpretation of the results. In pathological situations such as in major depression,15 16 post-traumatic stress disorder,17 and probably also in OTS,10 the glucocorticoids and the brain monoaminergic systems apparently fail to restrain the HPA response to stress. Indeed, we recently showed that a test protocol with two consecutive maximal exercise tests separated by 4 h may give a good indication of the HPA response to stress in well-trained and FO athletes relative to a case of OTS.10 We found a suppression of the HPA response to the second exercise bout in the OTS athlete as opposed to the normal responses. The question can be asked if this method is also a valuable tool to make a distinction between NFO and OTS. Therefore, we report the results of 10 patients who were referred to our laboratory with the diagnosis of suspicion of NFO or OTS.
Methods
Subjects
Ten patients who consulted a sports physician with complaints of underperformance and fatigue participated in the present study. The eight men and two women had an average height and weight of 181±(8) cm and 68.4±(11.8) kg. All subjects were diagnosed by a sports physician according to the latest guidelines for overtraining diagnosis.1 18 A careful history including training history was taken, completed by a physical examination and a blood draw to rule out other possible causes for the complaints. Patients were diagnosed as NFO or OTS retrospectively according to the severity of symptoms and the total duration of symptoms and underperformance (ie, both before and after testing) when no medical explanation for the condition could be found. It turned out that a cutoff of 1-year total duration gave a good distinction between NFO and OTS patients. Demographic data and reported symptoms can be found in table 1. Data of subject 1 are the same as presented in an earlier publication.10 All subjects signed informed consent before participation.
Demographic data and reported symptoms of the patients
Protocol
Two incremental graded exercise tests until exhaustion were performed, with 4 h of rest in between. One hour before each test, the athletes received a standardised meal (2315 kJ, 73% carbohydrate, 19% protein, 8% fat). Athletes arrived in the laboratory at 07:00 after an overnight fast. The first blood sample was collected as they arrived. Immediately after the first exercise test, the second blood sample was drawn. The third and fourth blood samples were drawn before and immediately after the second test. A schematic overview of the protocol can be found in fig 1. Because it is known that venepuncture increases blood prolactin, going back to baseline within 30 min, blood was drawn before and after each test (four punctures) creating the same “stress” in each situation. The study protocol was approved by the university ethical committee.
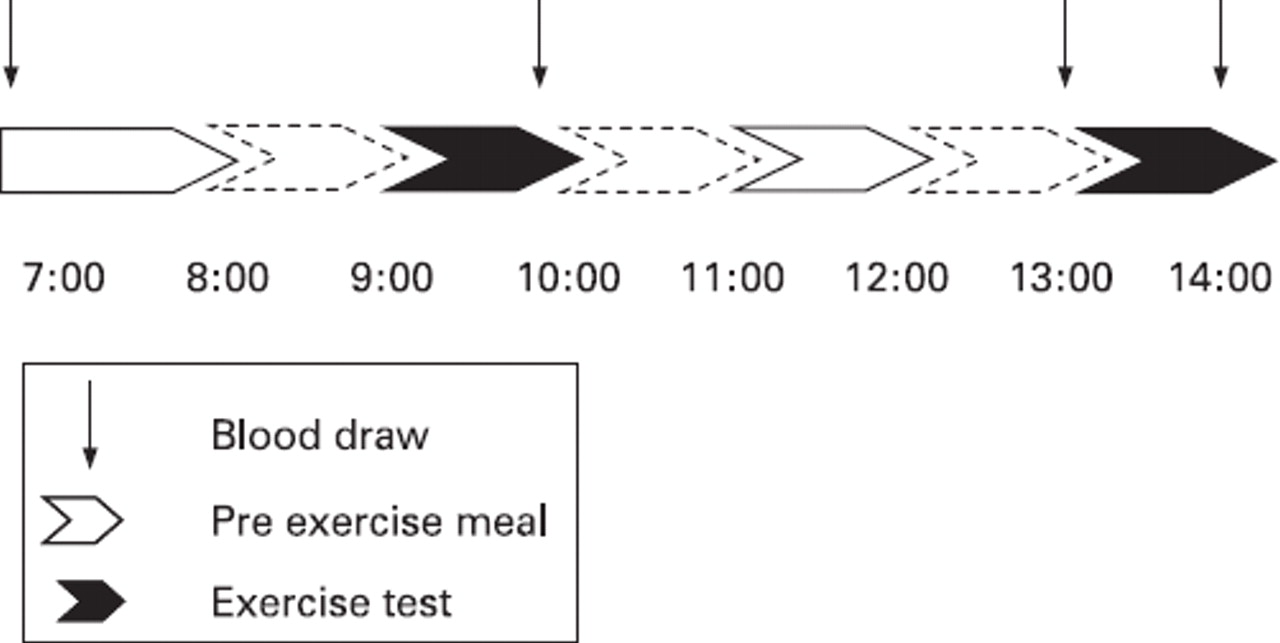
Schematic overview of the protocol.
Exercise testing
Exercise tests were performed on a cycle ergometer (Lode Excalibur Sport, Groningen, The Netherlands) or on a treadmill (Ergo ELG 55; Woodway, Weil am Rhein, Germany) depending on the sport. Tests on the cycle ergometer started with an initial workload of 80 W (subjects 6 and 7) or 30 W (subjects 4 and 9), the workload was increased by 40 W every 3 min. Tests on the treadmill started at 5.4 km h−1, the speed was increased with 1.8 km h−1 each 3 min (subjects 1, 2, 3, 8 and 10). One subject performed the treadmill test with an inclination of 1% (subject 5). The duration of each test was recorded in seconds. Subjects wore a heart rate monitor (Polar Accurex Plus, Kempele, Finland) for determination of maximal heart rate (HRmax) throughout the exercise tests. After each exercise test, 20 μl of blood was drawn from the right earlobe to determine maximal blood lactate concentration ([La]max) with enzymatic analysis (EKF; Biosen 5030, Barleben, Germany).
Blood analysis
Samples were collected in prefrozen 4.5 ml K3 EDTA vacutainer tubes (Becton Dickinson Vacutainer System Europe, Plymouth, UK) and immediately centrifuged at 3000 rpm (Minifuge 2, Heraeus, Germany) for 10 min, and plasma was frozen at −20°C until further analysis. Samples were assayed via RIA for cortisol (DiaSorin, Stillwater, Minnesota, USA), ACTH (Nichols Institute Diagnostics, San Juan Capistrano, California, USA), PRL (Roche Diagnostics, Mannheim, Germany) and GH (Pharmacia & Upjohn Diagnostics, Uppsala, Sweden).
Hormonal concentrations were expressed both in absolute (average (SE)) and relative values. For the relative hormone concentrations, both pre-test values were set at 100%; both post-test values were calculated by dividing through the pre-test value and multiplying by 100%.
Data analysis
Data were analysed using three different methods: visual inspection, parametric statistics and calculation of sensitivity for both OTS and NFO detection. Because the sample size was rather small (ie, maximal 5 for each group), data were first inspected visually. Parametric statistics and sensitivity calculation were used to support conclusions from visual inspection of the data. For the purpose of visual inspection, we created graphs with averages and SE for both the OTS and the NFO groups.
When visual inspection gave an indication for group differences, parametric statistical analyses were performed through ANOVA with repeated measures with one withinsubjects factor (post-values for first and second exercise test) and one between-subjects factor (NFO or OTS) or through an independent samples t test. Those analyses were performed in SPSS V.15.0. Sensitivity was also calculated for these variables by dividing the number of correct OTS or NFO diagnoses by hormonal analysis by the total number of OTS or NFO diagnoses according to the consensus statement.1 Sensitivity was presented as a ratio. The denominator varies because of random missing values.
Results
Exercise testing
Exercise duration, HRmax and [La]max are presented in fig 2A, B, and C. Visual inspection of the data led to the conclusion that there is no difference in exercise duration and HRmax between the OTS and the NFO patients. For [La]max, a much lower value was found for the OTS patients in combination with a larger reduction from the first to the second test compared with the NFO patients. However, parametric analysis did not indicate significant differences. The main effect of group gave an F ratio of 2.9 for [La]max and an F ratio <1 for exercise duration and HRmax, showing that almost three times as much variance is explained by the group membership (ie, OTS vs NFO) compared with random factors. In addition, sensitivity for OTS detection with [La]max was high (table 2). With a cutoff of 8 mmol l%#x2212;1, four out of the five OTS patients would have been diagnosed correctly from the first exercise test and four out of the four OTS patients from the second exercise test. Sensitivity for NFO diagnosis was lower, however (table 2). From the first exercise test, a correct diagnostic ratio of two out of four was found, for the second test, two out of three.

Exercise duration, maximal heart rate and maximal blood lactate concentrations during the first (grey bars) and the second (black bars) exercise test for the non-functional over-reached (NFO) group and the overtraining syndrome (OTS) group. Data are presented as means (SE).
Sensitivity for the detection of OTS and NFO
Absolute hormone concentrations
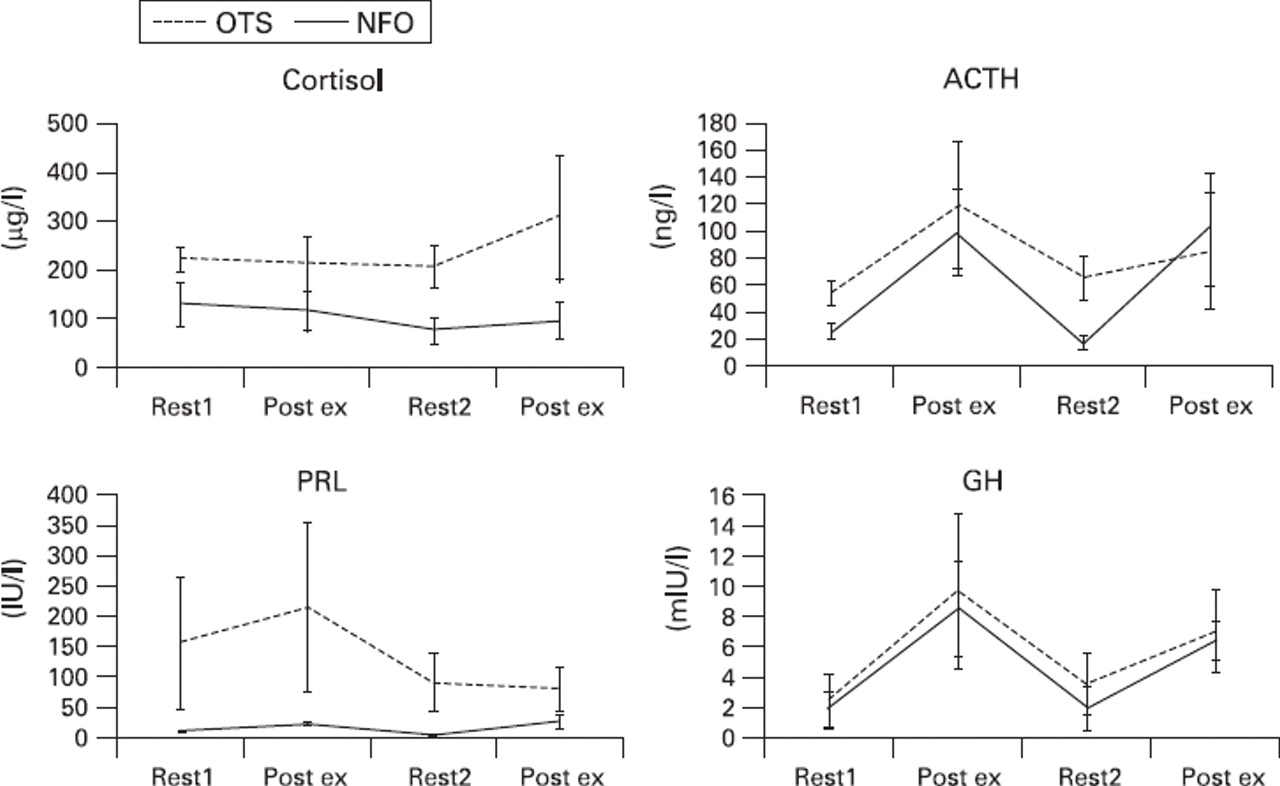
In fig 3A–D, absolute hormone concentrations are presented for the NFO and the OTS groups. Visual inspection of the data led to the conclusion that resting concentrations cortisol, ACTH and PRLwere higher for OTS patients comparedwithNFO. However, reactions to exercise tests did not differ between the groups. Resting hormone concentrations were tested with independent t tests. Only for ACTH, the t test gave a value >2 (ie, t8=2.6; p<0.05), meaning that only for ACTH, the difference between the groups was more than twice as large as the SE. Sensitivity of resting cortisol, ACTH and PRL was four out of five (cutoff 175 μg l−1), four out of five (cutoff 40 ng l−1) and two out of five (cutoff 50 IU l−1), respectively (table 2). Sensitivity for detection of NFO was three out of five, four out of five and three out of five respectively for cortisol, ACTH and PRL, respectively (table 2).

Cortisol, adrenocorticotrophic hormone (ACTH), prolactin (PRL) and growth hormone (GH) concentrations before and after the two exercise bouts for the NFO group (solid lines) and the OTS group (dashed lines). Data are presented as mean (SE).
Relative hormone concentrations
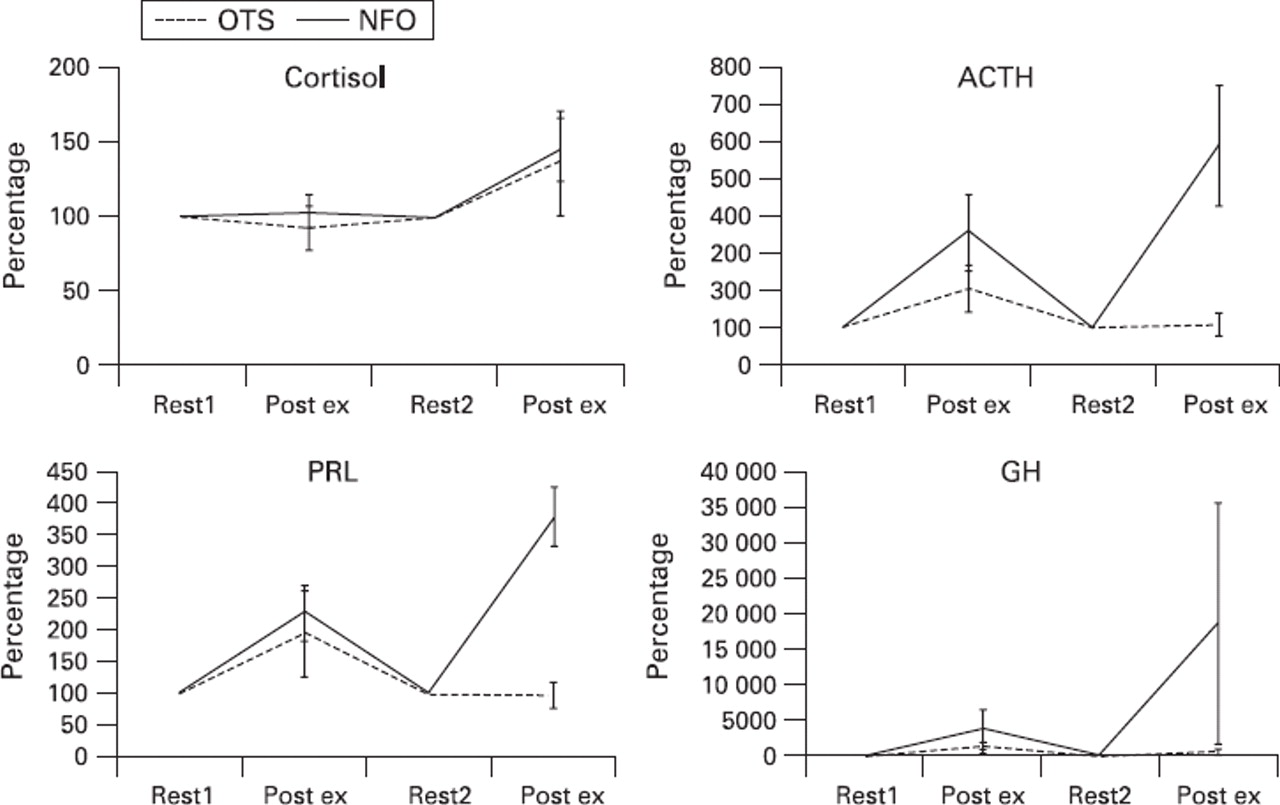
Hormonal responses to the two exercise bouts are presented in fig 4A–D. Visual inspection led to the conclusion that there are no differences in relative cortisol response between the NFO and the OTS group. ACTH, PRL and GH responses are higher in the NFO group compared with the OTS group, especially in the second exercise bout. However, the SE of GH in the NFO group was probably too large to draw clear conclusions. Indeed, the main effect of group gave an F ratio of F1,7=1.4 for GH. For ACTH and PRL, F ratios were F1,7=5.1 and F1,6=14.7, both significant at p<0.05, confirming larger responses for the NFO group. Visual inspection led to the conclusion that this larger response was much more pronounced after the second exercise bout. Indeed, parametric results pointed in the direction of an interaction effect between test and group for ACTH and PRL (F1,7=4.1; p=0.084; F1,6=4.0; p=0.092).
Cortisol, ACTH, PRL and GH responses to the two exercise tests for the non-functional over-reached (NFO) group (solid lines) and the OTS group (dashed lines). Data are presented as percentage increase from both baseline values (SE) of the mean.
Sensitivity of ACTH and PRL for the detection of OTS was four out of four and five out of five, respectively (table 2; cutoff, 200% at the second exercise test) and for the detection of NFO was four out of five and three out of three, respectively. Sensitivity of cortisol (cutoff, 200% at the second test) and GH (cutoff, 1000%) for the detection of OTS was four out of five and two out of five, and for the detection of NFO, one out of five and two out of four, respectively (table 2).
Discussion
Results of the present study show that ACTH and PRL responses to a double maximal exercise bout are sensitive for the diagnosis of OTS and NFO. Cortisol and GH responses were much less sensitive measures as were resting hormone concentrations. Maximal lactate concentrations at both exercise tests showed a high sensitivity for the detection of OTS, but almost half of the NFO patients did not reach [La]max of 8 mmol l−1 either.
Subjects
One of the difficulties in diagnosing OTS is that this should be based on “exclusion criteria”.1 18 Although, in recent years, the knowledge of central pathomechanisms of the OTS has significantly increased, there is still a strong demand for relevant tools for the early diagnosis of OTS. By calculating sensitivity for detection of NFO and OTS, a good indication of the value of the different measures for the diagnosis of unexplainable underperformance is obtained (table 2).
Ten patients were referred to the laboratory with a possible diagnosis of having OTS. Based on the criteria used in the consensus statement of the ECSS,1 the decision was made to perform a double maximum test with these athletes. One of the criteria to define an athlete as OTS is that recovery from the status will take months, or even years.1 2 In the present study, an arbitrary cutoff of 1 year was used. Those patients who needed more than 1 year for recovery were retrospectively diagnosed with OTS, the others with NFO. There seemed to be a good distinction between the patient groups based on this criterion, as the OTS patient with the shortest recovery time (1) experienced underperformance and other symptoms for 2 years, whereas the NFO patient with the longest recovery time (10) had NFO for 8 months. In addition, although subjective, there seemed to be a good parallel with the severity of the symptoms.
Lactate
One almost overall finding, at least in endurance and strengthendurance athletes having OTS, is a diminished maximal lactate concentration, whereas submaximal values remain unchanged or slightly reduced.10 12 This is confirmed in the present study where OTS patients did not reach maximal lactate concentrations above 8 mmol l−1. Two out of the four NFO patients did not reach [La]max of 8 mmol l−1 at the first exercise test either (for one patient [La]max was missing). Thus, although low [La]max has frequently been described as a diagnostic marker for OTS, from these results, it does not seem sensitive enough to distinguish OTS from NFO.
Absolute hormone concentrations
Resting hormone concentrations have been a topic of many studies and discussions. It has been suggested that conflicting results were, at least partly, because of a lack of standardisation in both the way overtraining was measured and in the hormone measurement protocols used. Results from the present study show that variability in resting hormone concentrations is also present within groups of NFO and OTS patients. The arguments for contradictory findings are not valid within this study where blood was drawn at the same time of day always after an overnight fast. However, the diurnal variation in cortisol cannot be ruled out with this protocol because tests are separated by 4 h. However, each test was done with the same protocol and timing so that the data were collected in a standardised manner. One possible reason why the cortisol levels do not show the same pattern as ACTH might be because of this diurnal variation. Therefore, it must be concluded that resting hormone concentrations are not sensitive enough, at least not to diagnose unexplained underperformance in athletes. It has been suggested that hormonal reactions to stress tests are more sensitive.1 11
The symptoms associated with OTS, such as changes in emotional behaviour, prolonged feelings of fatigue, sleep disturbances and hormonal dysfunctions are indicative of changes in the regulation and coordinative function of the hypothalamus.8 19 Previous studies have shown different results for stress-induced hormonal responses.6 20 21 Results from a previous study10 and the present study show that contradictory findings cannot solely be explained by different measurement methods and/or definitions used. From figs 3 and 4, it is clear that hormonal responses to one single exercise bout are not sensitive enough to distinguish NFO from OTS.
Relative hormone concentrations
The only measures that accurately distinguished NFO from OTS were increases in ACTH and PRL concentrations after a second maximal exercise bout. The OTS athletes showed a very small or no increase in ACTH and PRL concentrations after the second exercise bout; the NFO athletes showed very large increases. This is a confirmation of our previous studies with this protocol.10 22 The use of two bouts of maximal exercise to study neuroendocrine variations showed an adapted exercise-induced increase of ACTH, PRL and GH to a twoexercise bout.10
The fact that GH did not perform as well as both other pituitary hormones in the present study could be the result of the large inter-individual variation in the NFO group. One of the NFO athletes had a very low resting value before the second exercise test and showed an increase of 12 000%. Cortisol concentrations after the second exercise test seem also quite good markers for OTS but poor when it comes to distinguish NFO from OTS. Although almost all OTS athletes showed a reduced increase in the response of cortisol to the second exercise bout, almost none of the NFO athletes showed an overshoot (table 2). This result is similar to earlier findings.10 22
In an earlier study, we found that in order to detect signs of OTS and distinguish them from normal training responses or FO, this method may be a good indicator not only of the recovery capacity of the athlete but also of the ability to normally perform the second bout of exercise.10 The test could, therefore, be used as an indirect measure of hypothalamic–pituitary capacity. It was hypothesised that on the NFO–OTS continuum, a hypersensitivity of the pituitary is followed by an insensitivity or exhaustion afterwards.10 22 Results from the present study confirm this hypothesis. The NFO athletes showed a very high response to the second exercise bout, at least in ACTH and PRL, whereas the OTS athletes showed suppression.
There are two other studies that have measured prolactin in relation to overtraining. Lehmann et al23 showed that an increase in training volume, rather than intensity, led to more symptoms associated with overtraining. They also observed a close-to-significant exercise-induced decrease in plasma prolactin in the increased intensity group but no change because of increased volume. Budgett et al24 observed a more marked plasma prolactin response to a neuroendocrine challenge in athletes with unexplained underperformance syndrome. They also observed a higher resting plasma prolactin in unexplained underperformance syndrome athletes than healthy controls. These authors also state that prolactin could prove useful in monitoring the individual response to training and recovery.
Behind the seemingly uniform acute hormonal response to exercise, explaining the disturbance to the neuroendocrine system caused by OTS is not that simple. There are several similarities with other intensive and chronic stress situations. There is compelling evidence for the involvement of HPA axis abnormalities in chronic stress situations such as post-traumatic stress disorder17 and depression25 and probably also during NFO and OTS. In chronic stress situations, the number of ACTH and cortisol secretion pulses is increased, which is also reflected in elevated urinary cortisol production.25
Chronic stress and the subsequent chronic peripheral glucocorticoid secretion plays an important role in the desensitisation of higher brain centre response during acute stressors because it has been shown that in acute (and also chronic) immobilisation, the responsiveness of hypothalamic corticotrophin-releasing hormone (CRH) neurons rapidly falls.26 These adaptation mechanisms could be the consequence of changes in neurotransmitter release, depletion of CRH and/or desensitisation of hypothalamic hormonal release to afferent neurotransmitter input.26 Indeed, concentrations of CRH are elevated, the number of CRH-secreting neurons in the limbic brain regions is increased and the number of CRH binding sites in the frontal cortex is reduced secondary to increased CRH concentrations following chronic stress.25
Another very important brain area that mediates, and in turn is affected by the stress response, is the hippocampus.27 The consequences of impaired regulation of cortisol secretion are manifold, ranging from effects in peripheral tissues (eg, osteoporosis) to changes in the central nervous system.28 Most of the effects seen in chronic stress situations can be explained by the occupation of the two glucocorticoid receptors in the brain. In normal situations, the mineralocorticoid receptor will be occupied, whereas the glucocorticoid receptor has lower affinity for the natural ligand corticosterone (cortisol) than the mineralocorticoid receptor and is extensively activated only after stress and at the peaks of the circadian rhythm. One of the main functions of glucocorticoid receptors is to normalise brain activity some hours after an organism has been exposed to a stressful event and to promote consolidation of the event for future use.25 28 To this purpose, corticosteroids feed back in precisely those circuits that are initially activated by the stressor and are enriched in glucocorticoid receptors: limbic forebrain neurons and the paraventricular nucleus of the hypothalamus.
What is already known on this topic
▶. The diagnoses NFO and OTS must be made based on an exclusion diagnosis. The most important marker to distinguish NFO from OTS is duration of recovery, which is only known retrospectively.
▶. Athletes with NFO or OTS show a disturbed functioning of the hypothalamic–pituitary–adrenal (HPA) axis, which parallels disturbances in other stress-related syndromes.
What this study adds
▶. The two-bout exercise protocol seems a useful tool for prospectively diagnosing underperforming athletes, with an overshoot of adrenocorticotrophic hormone (ACTH) and prolactin (PRL) after the second exercise bout in NFO athletes and a suppression in OTS.
▶. A possible explanation for the difference is hypersensitivity of glucocorticoid receptors in NFO versus insensitivity in OTS.
When stress is chronically induced, as in NFO and OTS, two specific mechanisms could occur: first, when corticosteroid levels are chronically too high, a hypersensitivity of the receptors will occur, this can lead to a disinhibition of CRHproducing neurons, which in turn will lead to an intensified release of ACTH (as seen in the second exercise bout in the NFO athletes). When the chronic stress situation continues and glucocorticoid receptors are chronically activated (which occurs in post-traumatic stress disorder17 and depression),25 a blunted ACTH response to CRH will occur.28
From the data mentioned previously, it can be concluded that in NFO and OTS, the neuroendocrine disorder is a hypothalamic dysfunction rather than a malfunction of the peripheral hormonal organs29 and that the distinction between NFO and OTS can be characterised by hypersensitivity versus insensitivity of glucocorticoid receptors. The interactive features of the periphery and the brain could be translated into possible immunological, psychological and endocrinological disturbances.
References
Footnotes
-
Competing interests None.