Article Text

Abstract
Background: Although there have been reports of injury rates in men’s World Cup rugby, there has been no research into injury rates in women’s international rugby.
Objective: To determine the rate of injury at the 2006 Women’s Rugby World Cup (WRWC).
Methods: All participating teams in the 2006 WRWC were enrolled prospectively in this study. Healthcare workers for each team collected data on training and game exposure and information on injuries.
Results: 55 players (16%) sustained at least one injury (10.0/1000 player hours); 4 players (1%) sustained two injuries. 45 injuries occurred during games (37.5/1000 player hours) and 14 injuries occurred during practice (12.5/1000 player hours), a statistically significant difference (RR = 12.5, 95% CI 6.9 to 22.8). The injury rate was 39.3/1000 player hours for the forwards and 42.2/1000 player hours for the backs (RR = 1.3, 95% CI 0.7 to 2.3). The front row had the highest injury rate (62.5/1000 player hours). 63.6% of injuries occurred during the tackle. Most injuries occurred to the neck, knee and head/face. The majority of injuries were sprains, muscle injuries and contusions. There were five fractures during the event and four reported concussions.
Conclusion: Female players sustained a considerable rate of injury during the 2006 WRWC. Backs had a slightly higher rate of injury than forwards, but the players most often injured were in the front row. The neck/cervical spine and knee were the most commonly injured regions, followed by the head and face. This is the first study to examine injury rates in female rugby players at a World Cup and reports valuable data in this population.
Statistics from Altmetric.com
Rugby is an intense contact sport and injuries do occur. Injury rates in men’s rugby have been reported in many studies1–25 and there have been previous reports specific to injuries in men’s World Cup competitions.2 11 However, very few data have been published on women’s rugby.4 26–29 It is difficult to draw conclusions on the nature of women’s rugby injuries since these studies have used different data collection methods and reported rates of injury in different formats. There has been no published literature reporting injury rates during women’s international rugby events. The purpose of this investigation was to determine injury rates during the 2006 Women’s Rugby World Cup (WRWC). It is only after injury rates and circumstances have been determined that injury prevention strategies can be developed.
METHODS
Team contact information was solicited from the International Rugby Board (IRB). In the months before the competition, team managers were contacted and the study was explained. Medical staff contact information was obtained from the managers and the medical staff were then contacted. The purpose and procedures of the study were explained to the medical staff.
During their stay at the World Cup, the researcher met with each team. The purpose and procedures of the project were explained to the players. In some cases translators were used to describe the study properly. The researcher then requested consent from players by asking them to sign consent forms. Height and weight measurements were also taken during these team meetings.
Medical staff were further briefed on the procedures of the study in Edmonton at an IRB medical meeting before the start of the competition. Study forms were distributed and the researcher made sure that the medical staff understood the proper completion of the forms. In most cases the teams had a team physician who completed the study forms. In one case the team physiotherapist completed the forms instead of the physician. Two teams did not travel with a team physician. One team had a physiotherapist complete the forms; the other team had a player who translated information from her physiotherapist to the forms.
A consensus document on injury definition and data collection for rugby has recently been prepared. Injury was defined as: “Any physical complaint, which was caused by a transfer of energy that exceeded the body’s ability to maintain its structural and/or functional integrity, that was sustained by a player during a rugby match or rugby training, irrespective of the need for medical attention or time-loss from rugby activities. An injury that results in a player receiving medical attention is referred to as a ‘medical-attention’ injury and an injury that results in a player being unable to take a full part in future rugby training or match play as a ‘time-loss’ injury.”30
The injuries of interest in this study were “time-loss” injuries. In every case of injury which resulted in a player missing rugby participation, medical staff completed an Injury Report Form. This form was adapted from the consensus document30 for the World Cup event. Information collected on this form included player age and position, events surrounding the injury, details of the injury region and type, injury diagnosis, cause of the injury, ruling on law violations or dangerous play, and whether or not the player returned to play in that session.
Participation in all team sessions was recorded on Participation Forms. Medical staff indicated whether each player participated fully, partially or not at all during each session. Exposure information was calculated from these forms.
Injury Report Forms and Participation Forms were collected at regular intervals throughout the event. The researcher met with medical staff to collect the forms and discuss any problems with data recording. Forms were checked for completeness and missed time was cross-referenced with Injury Report Forms. Any missing information was solicited from medical staff.
The data were entered into Microsoft Excel and EpiInfo for analysis. Relative risks (RRs) and 95% confidence intervals (CIs) were calculated for all comparisons.
RESULTS
Twelve countries were represented at the 2006 Women’s Rugby World Cup. Each team participated in five games over the course of 20 days. A total of 339 players participated in the event. All of the participating athletes agreed to participate in the study, resulting in a 100% consent rate. The demographic characteristics of the participating players are presented in table 1.
A total of 5881 player hours of participation were logged during the World Cup event. Match participation accounted for 1200 player hours while training accounted for 4681 player hours.
Fifty-five players (16%) sustained at least one injury during the event. Four players (1%) sustained two injuries. A total of 59 injuries resulted in an injury rate of 10.0 injuries/1000 player hours. As shown in table 2, a significantly higher rate of injury occurred in matches (37.5 injuries/1000 player hours) than in training (3.0 injuries/1000 player hours) (RR = 12.5, 95% CI 6.9 to 22.8).
Forwards sustained injuries at a rate of 39.3 injuries/1000 player hours. Players in the back positions had a higher injury rate at 42.2 injuries/1000 player hours. There was no significant difference between the injury rates of forwards and backs (table 2). Injury rates by position are also shown in table 2. Front row players sustained injuries at a rate four times that of locks (RR = 4.3, 95% CI 1.0 to 19.2) and nearly three times that of loose forwards (RR = 2.6, 95% CI 0.9 to 7.3). Outside backs had the highest injury rate of the back position, although the rate was similar to inside backs (RR = 0.9, 95% CI 0.4 to 2.3). Outside backs were nearly four times as likely to be injured as centre backs (RR = 3.7, 95% CI 0.8 to 16.5).
During the first half of games, players experienced an injury rate of 40.0 injuries/1000 player hours. The injury rate during the second half of play was slightly lower at 35.0 injuries/1000 player hours although the rates were not significantly different (RR = 1.1, 95% CI –1.7 to 2.7).
Injury rates by placement in the tournament were compared. When the top five teams were compared with the bottom five, there were virtually no differences in the rates (RR = 0.9, 95% CI 0.4 to 1.8). However, when the teams were divided into groupings of four, the teams finishing in the middle rankings sustained a higher rate of injury. The middle four teams were 3.2 times more likely to sustain an injury than the top four teams (RR = 3.2, 95% CI 1.6 to 6.3) and 2.7 times more likely to sustain an injury than the bottom four teams (RR = 2.7, 95% CI 1.4 to 5.1). The top four and bottom four teams had similar injury rates (RR = 0.9, 95% CI 0.4 to 1.9).
Contact mechanisms accounted for 75% of the injuries. Table 3 shows injuries according to the specific phase of play. Tackling activities accounted for 64% of all injuries. Sprain/ligament injuries were most common, followed by injuries to muscle tissue. Injuries were also ordered according to specific diagnosis. The most common specific injury diagnoses are listed in table 3. In some cases an injury episode resulted in more than one type of injury, therefore these do not necessarily sum to 59 injuries.
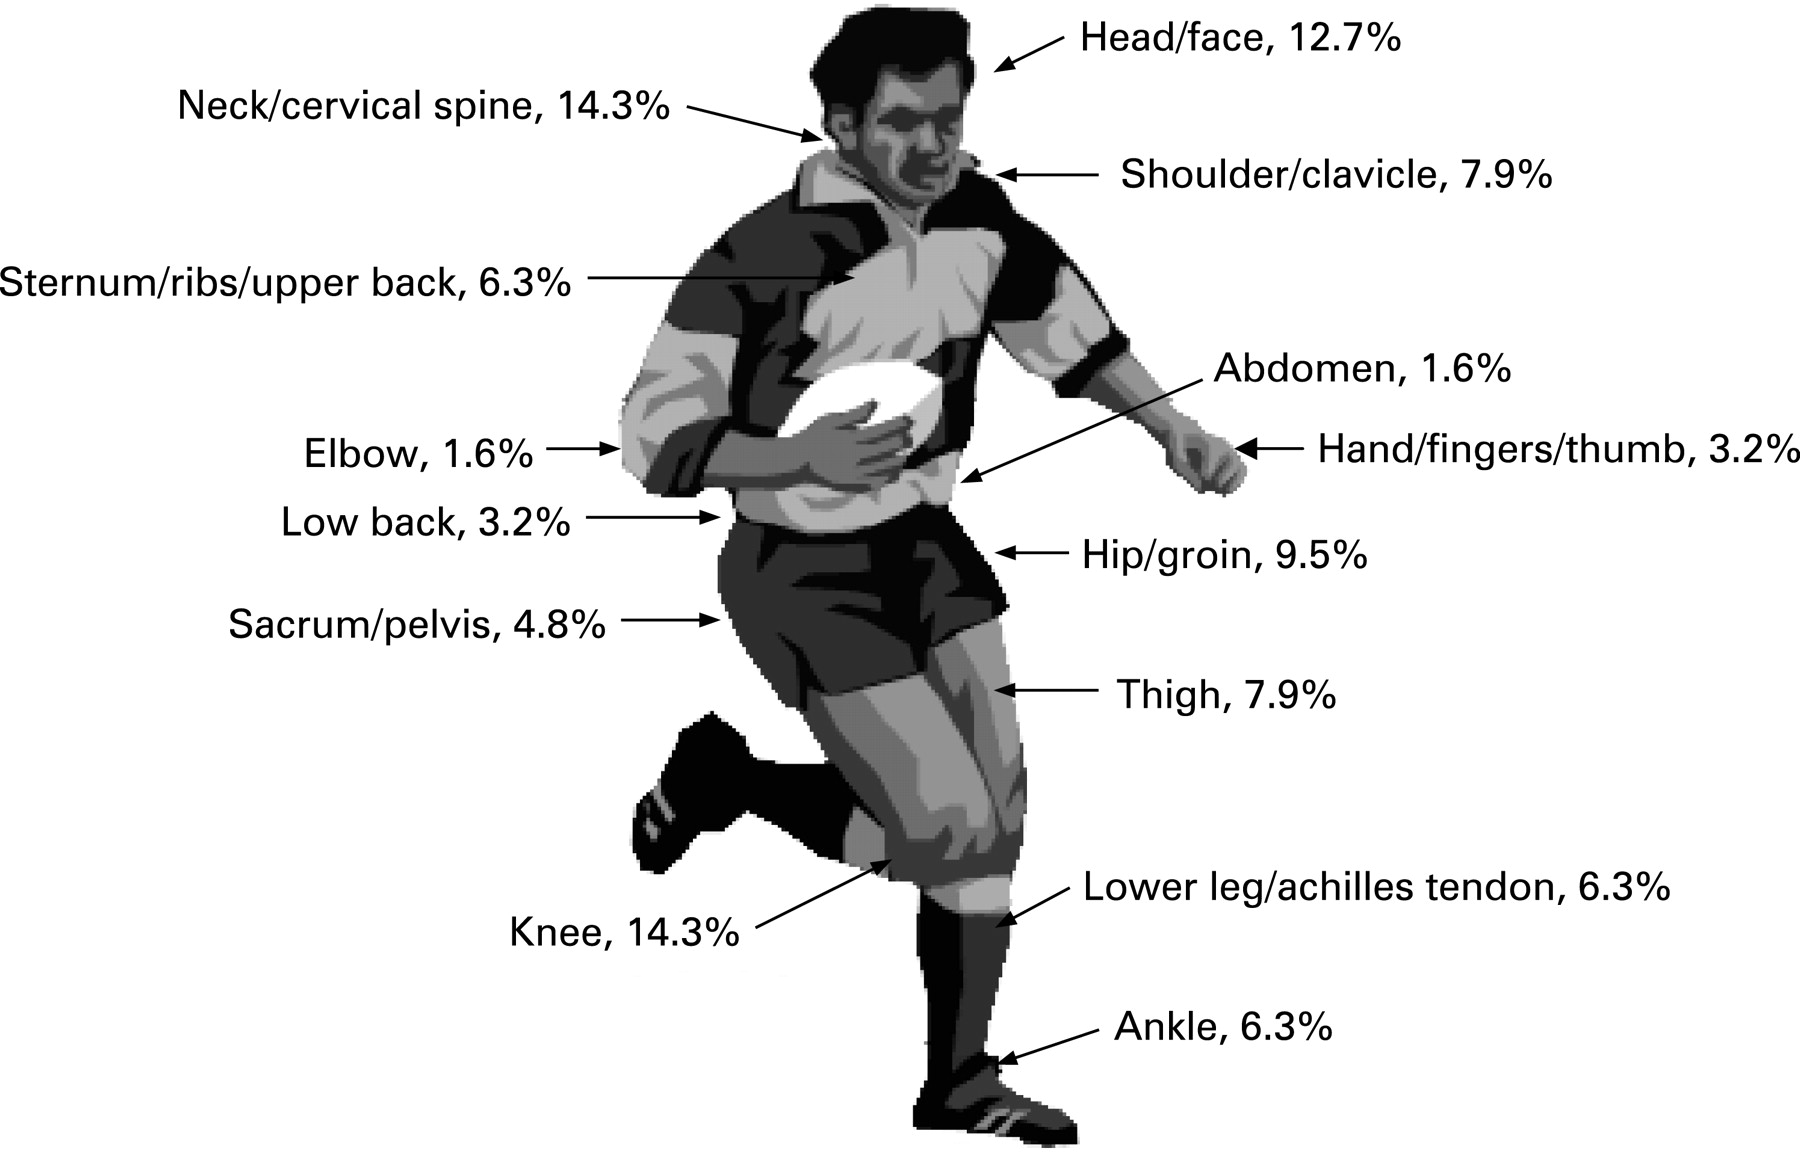
Injuries were categorised according to the specific body region injured. This distribution is shown in fig 1. Neck/cervical spine and knee injuries were most common, followed by the head and face.

The WRWC 2006 Statistical Review and Match Analysis was obtained from the IRB.31 Numbers of certain types of play were available from this report and it was then possible to calculate rates of injury for these plays. Injury rates expressed as the number of injuries occurring per 1000 plays are shown in table 4.
Further analysis was performed to investigate injury regions and types by playing position. Region and type of injury by playing phase were also determined. Because of the relatively small number of injuries in this study, most of these numbers were very small and none of these analyses showed statistical significance. It would have been beneficial to rate the severity of injuries during the competition. Usually this is determined by the number of sessions missed from participation. Because this was a short tournament, many of these data are incomplete and analysis is inappropriate.
DISCUSSION
The injury rate in this study was 10.0 injuries/1000 player hours. However, when only injuries occurring during matches are considered, the rate was 37.5 injuries/1000 player hours. This injury rate is similar to the rate of 32 injuries/1000 player hours reported by Jakoet and Noakes from the 1995 men’s World Cup.11 Best et al2 reported a much higher rate of 97.9 injuries/1000 player hours during the 2003 men’s World Cup. These studies used the same injury definition.
There is very little previous literature in women’s rugby with which to compare these injury rates. Comstock27 reported that 83% of women rugby players will sustain an injury in a 3-month period. In data collected from self-administered questionnaires during a rugby tournament, Comstock and Fields28 reported injury rates of 4.4 injuries/100 matches. Carson et al26 reported a rate of 7.1 injuries/1000 player hours in a combination of matches and training. The Rugby Injury and Performance Project reported a rate of 6.1 injuries/100 player games and 0.6 injuries/100 player practices.4 Differing populations, data collection methods, injury definition and exposure calculations make comparison between these studies inappropriate.
When the top and bottom finishers of the 2006 WRWC were compared, there was little difference between injury rates. However, the middle four teams had a much higher injury rate. Wekesa et al24 reported highest injury rates in the lowest finishing team in a World Cup prequalifiying tournament. Best et al2 also reported higher injury rates in the non-finalist teams. In this tournament the middle four teams may have had a higher injury rate because they had more games against teams of a similar level.
Backs had a slightly higher rate of injury than their team mates in the forward positions. In the current study front row players sustained the highest rate of injury, but only four (37.5%) of their injuries occurred during the scrum. The outside backs had a particularly high injury rate. Clark et al7 and Nathan et al18 reported similar high rates of injury to wing and fullback players. Lewis and George16 found the highest rates of injury to wings in their female study population.
It is not surprising that a large proportion (75%) of the injuries was attributed to contact mechanisms. Brooks et al5 reported a very similar rate of 72% of injuries caused by contact. The tackle accounted for 64% of injuries with the tackled player more likely to be injured. Similar trends have been reported in other studies; tackling accounted for 58.5% of injuries reported by Bathgate et al,3 40% of those reported by Bird et al,4 56% of those reported by Jakoet and Noakes11 and 55% of those reported by Roux et al.20
Excluding tackle injuries, the most dangerous type of play in this study was the scrum. The actual number of injuries was low4 but the rate was relatively high (142.9/1000 plays). When examining injury rates, over four times more injuries occurred in the scrum than in the rucks and mauls combined. No injuries were reported during line-out plays. Nathan et al18 and Roux et al20 reported similar findings, with the scrum accounting for the greatest percentage of injury after tackles. Other studies have found higher rates of injury in rucks and mauls than in scrums.4 7 11 16
What is already known on this topic
Rugby is an intense sport where injuries are likely. Men’s injury rates have been reported extensively.
Head and neck injuries are common in rugby.
This study found a higher injury rate in the first half of the game, but the difference was not significant. This trend is contradictory to other published literature. Bathgate et al3 and Wekesa et al24 in particular found higher rates of injury during the second half of play.
The neck/cervical spine and knee regions were the most commonly injured regions. Many studies have reported the highest injury rates in the upper extremity.16 18 19 25 27 However, other studies have reported higher injury rates in the lower extremity.4 7 8 13 14 20 24 26 The high rate of neck injury is a surprise and future studies will need to confirm if this finding was a chance occurrence.
What this study adds
This study is the first to report injury rates in women’s international rugby.
Injury patterns in this study are similar in many aspects to men’s rugby, but more research is warranted.
Sprains were the most common type of injury reported. Several other reports also found sprains to be the most common type of injury,4 11 13 but some studies found muscle strains to be the most common injury.7 18 20 The most common specific injury diagnosis was medial collateral ligament sprain.
It is noteworthy that three of the four concussion injuries were reported by one team. This may represent under-reporting by other teams in the tournament. Concussion injuries may be under-reported owing to the IRB’s regulations requiring either no participation in rugby for 3 weeks or clearance by a neurological specialist to return to play. Access to a neurological specialist was available during the tournament.
This study has recognised limitations. Medical staff may have waited a period of time between the occurrence of the injury and completion of the Injury Report Forms. Recall bias may have occurred. The regular submission of forms to the researcher was an attempt to minimise this bias. Rugby players and medical staff may not have reported all the injuries that occurred during the World Cup. Differential reporting rates may have occurred from team to team. The researchers kept track of all players leaving the game due to injury and later ensured that Injury Report Forms for these injuries were submitted. Language barriers may have been a factor contributing to inaccurate completion of the forms. In one case a player completed the forms but the accuracy of her reporting cannot be verified.
There are very few data reporting injury rates in women’s rugby and no previous reports have studied women’s international rugby. The injury rates in this study were comparable to those reported in one study of men’s World Cup rugby. The tackle accounted for the greatest proportion of injuries. The neck/cervical spine and knee were the most commonly injured regions, which is different from data on men; future studies will need to confirm this finding. It is our hope that the results of this study will aid the understanding of injury in women’s rugby and will encourage more research in the sport.
Acknowledgments
The authors thank Caroline Landreville for her work as a research assistant during the World Cup; all the medical staff for their work in completing the forms and the players for their cooperation and support; and Simon Jelowitz of the IRB and Trevor Arnold of Rugby Canada for their assistance with the logistics of the study.
REFERENCES
Footnotes
Funding: Financial support for this study was provided by the International Rugby Board.
Competing interests: None.
Ethics approval: Ethics approval for the study was obtained from the University of Calgary Office of Medical Bioethics.