Article Text

Abstract
Objectives: To investigate if ligamentous laxity increases seasonal incidence of injury in male first division club rugby players, and to determine if strength protects against injury in hypermobile and tight players.
Methods: Fifty one male first division club rugby players were examined for ligamentous laxity using the Beighton-Horan assessment and graded with an overall laxity score ranging from 0 (tight) to 9 (hyperlax). Each participant was classified into a group determined by their laxity score: tight (0–3), hypermobile (4–6), or excessively hypermobile (7–9). The incidence of joint injuries was recorded prospectively throughout the rugby season and correlated with laxity score. Differences between the groups were analysed.
Results: The overall prevalence of generalised joint hypermobility was 24% (12/51). The incidence of injuries was significantly higher in hypermobile (116.7 per 1000 hours) than tight (43.6 per 1000 hours) players (p = 0.034). There were no significant differences in peak strength between the hypermobile and tight groups.
Conclusions: The laxity of the players may explain the differences in injury rates between these groups. Peak strength does not protect the hypermobile joint against injury. It appears that hypermobility may cause an increase in the injury rate of male first division club rugby players.
- rugby
- incidence
- injuries
- ligamentous laxity
- strength
Statistics from Altmetric.com
Fitness training programmes for sports have often included flexibility, strength, and cardiorespiratory endurance training.1 It is also a common belief that flexibility exercises decrease the incidence, intensity, and duration of muscluotendinous and joint injury and are seen as one of the best ways of avoiding these types of injury.1,2 This should not be regarded as meaning that maximum joint flexibility will completely eliminate the risk of injury. Although the term flexibility is generally thought to refer to the extensibility of muscles, the measurements are also affected by ligamentous laxity or joint looseness, and athletes at either extreme of the flexibility continuum are probably at increased risk of injury. Generalised ligamentous laxity or tightness is a genetically determined component of overall joint flexibility and cannot be readily altered by stretching.1 Prediction and awareness of anatomical factors that increase the risk of injury allow the clinician to develop individual rehabilitation programmes and preparticipation sports screening aimed at decreasing the risk of injury, as well as predicting the sports at which athletes can best perform, and steering them away from potentially harmful activities.3–5 Whereas joint laxity may appear to be an advantage in sports requiring good flexibility such as gymnastics, it can be potentially dangerous in a sport such as rugby. The relation between ligamentous laxity or hypermobility and the overall occurrence of injury has not been examined in controlled trials, and the research that has been carried out has produced conflicting results. Ligamentous laxity has been shown to result in a greater likelihood of knee ligament rupture in professional football players,6 but has no relation to the occurrence or type of injury in college and secondary school athletes.7,8 Ligamentous laxity has also been identified as an intrinsic risk factor associated with injury in other elite athletes.4,9,10 However, a study carried out on lacrosse players found no significant difference in overall injury rates between hypermobile and non-hypermobile players.11 Some researchers have found that ligamentous laxity predisposes individuals to the development of rotator cuff tendonitis and instability of the shoulder.3 However, another eight year study on high school footballers reported no definite correlation between loose jointedness and major injuries of the knee and ankle.12
Studies of injury in rugby union have shown that an increase in injuries to both professional and amateur players coincided with the introduction of professionalism.13 The purpose of this study was to first assess the ligamentous laxity of a group of male first division club rugby players and to record the seasonal incidence of joint injuries in that specific population. The secondary objective was to determine if there was a relation between ligamentous laxity and injury incidence. A final objective was to determine if strength protects against injury in hypermobile and tight players.
METHODS
Participants
Fifty one male first division club rugby players (mean (SD) age 23.6 (3.3) years) were recruited for the study from senior A and B club teams around the Waikato region. Each participant was registered with a first division club at the beginning of the year and played in at least three games during the season. All procedures were explained fully, and written consent was obtained from each player. Ethical approval was obtained from the Waikato Institute of Technology ethics for human research review board before testing was started.
Study design
The same researcher examined all participants for generalised ligamentous laxity using the adapted Beighton-Horan scale.14 This hypermobility assessment, originally devised by Carter and Wilkinson in 1964 and modified by Beighton et al in 1973,1 measures the following five elements:
-
passive opposition of the thumb to the flexor aspect of the forearm (1 point per hand)
-
passive hyperextension of the 5th metacarpal phalangeal joint beyond 90° (1point per hand)
-
hyperextension of the elbows by 15° or more (1 point per arm)
-
hyperextension of the knees (1 point per leg)
-
forward flexion of the trunk with knees extended and palms flat on floor (1 point)
All elements are added together to give an overall ligamentous laxity score ranging from 0 (tight) to 9 (hyperlax). An “injury allowance point” was also used, whereby participants who tested positive for only one side of a bilateral test, but had a history of a significant injury to the contralateral joint, were presumed to be lax before that injury and were awarded an injury allowance point. Elbow and knee joint angles were measured using a Jamar goniometer. After the assessment, participants were stratified by ligamentous laxity into one of three laxity groups: tight (0–3); hypermobile (4–6); extremely hypermobile (7–9).
Injury incidence
The incidence of shoulder, hip, knee, ankle, and wrist and hand joint injuries was recorded prospectively over the entire season by the teams’ physiotherapists. These data were then analysed to determine if injury rate correlated with hypermobility status.
An injury was defined as any condition limiting function that resulted in an athlete seeking medical treatment from a doctor or physiotherapist, regardless of whether athletic participation had been missed. Only new injuries incurred during that season were considered, and any aggravations or reinjuries suffered during the season were not included.
Strength testing
All players classed as hypermobile were recruited to undergo strength testing on the Biodex System 2 Multi-Joint Testing System Shirley, New York, USA, to determine the relative strength of the hamstrings and quadriceps at two speeds. The nine players were matched with another nine players from the tight group according to position, height, weight, level, and game time. The other three hypermobile players could not participate in the strength testing because of injury. Biodex strength testing was also performed on the non-lax players as matched controls. Each participant was instructed to follow the same warm up procedure before testing; this consisted of light resistant pedalling at a cadence of 50 rev/min on a Monark cycle ergometer for five minutes. Five practice repetitions on each leg were performed at each of the two test speeds before data collection to allow the subject to become familiar with the equipment. At a speed setting of 180°/s, five maximal repetitions were performed. The subject then rested for two minutes before testing the leg at a speed of 60°/s. A three minute rest period was given between test bouts, before testing of the opposite leg. Consistent verbal encouragement was given throughout the maximal effort repetitions. Values for peak torque strength were obtained, and hamstring to quadriceps ratios as well as percentage strength deficits were calculated for each knee motion of each limb.
Statistical analysis
Descriptive statistics were used to determine mean values of genetic orientation (age, height, and weight). The Kruskal-Wallis (non-parametric analysis of variance) and Mann-Whitney U tests were used to determine if there were significant differences between incidence of injury for the tight, hypermobile, and extremely hypermobile athletes. Simple analysis of variance was used to compare strength values between the lax and non-lax players.
RESULTS
Laxity results
Twelve of the 51 subjects (24%) were above the 4/9 criterion for hypermobility. Only 8% (4/51) of subjects scored 7, 8, or 9 (fig 1). The overall mean (SD) laxity score for this study was 2.0 (2.4) (range 0–9).
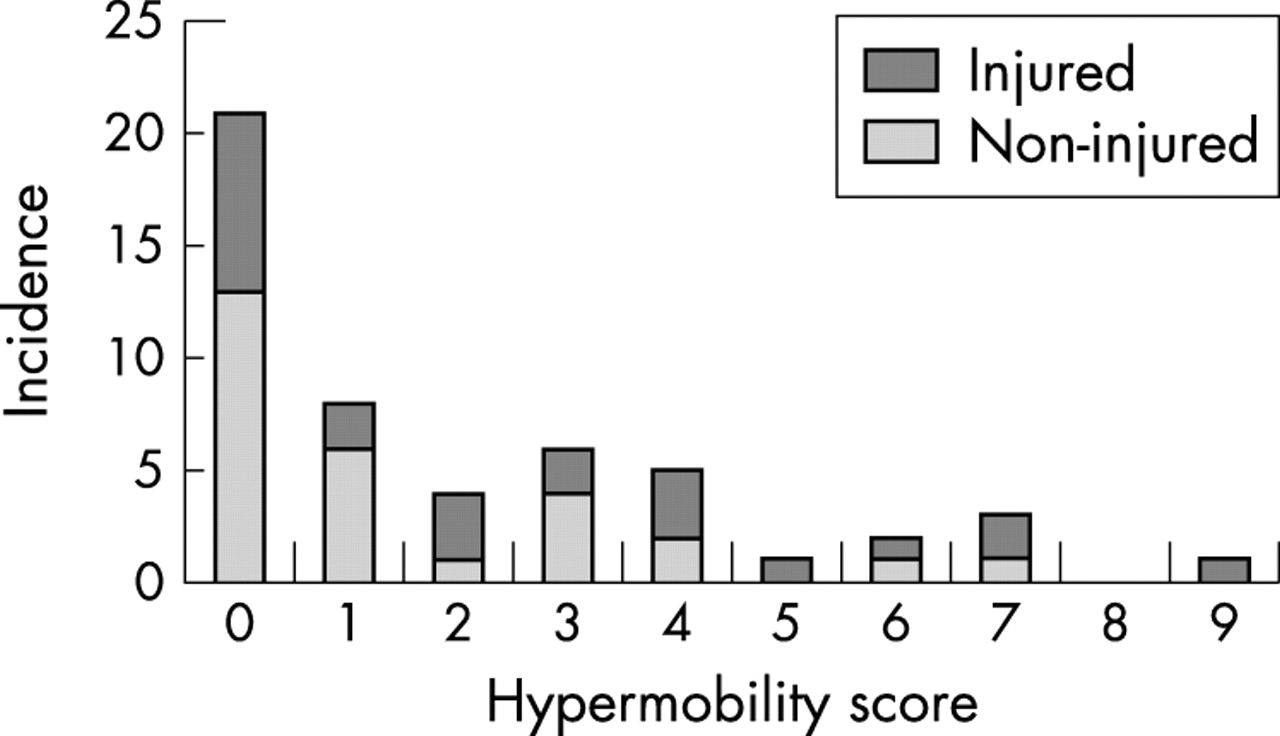
Distribution of the Beighton-Horan hypermobility scores and frequency of injuries during a season for male first division club rugby players.
Injury surveillance
Twenty three athletes sustained a total of 31 injuries over the entire season; 19 reported a single injury and four suffered two or more injuries. Figure 2 illustrates the incidence and distribution of injuries sustained over the entire rugby season.

Incidence of joint injury per 1000 exposure hours among male first division club rugby players sustained during the season, by site of injury.
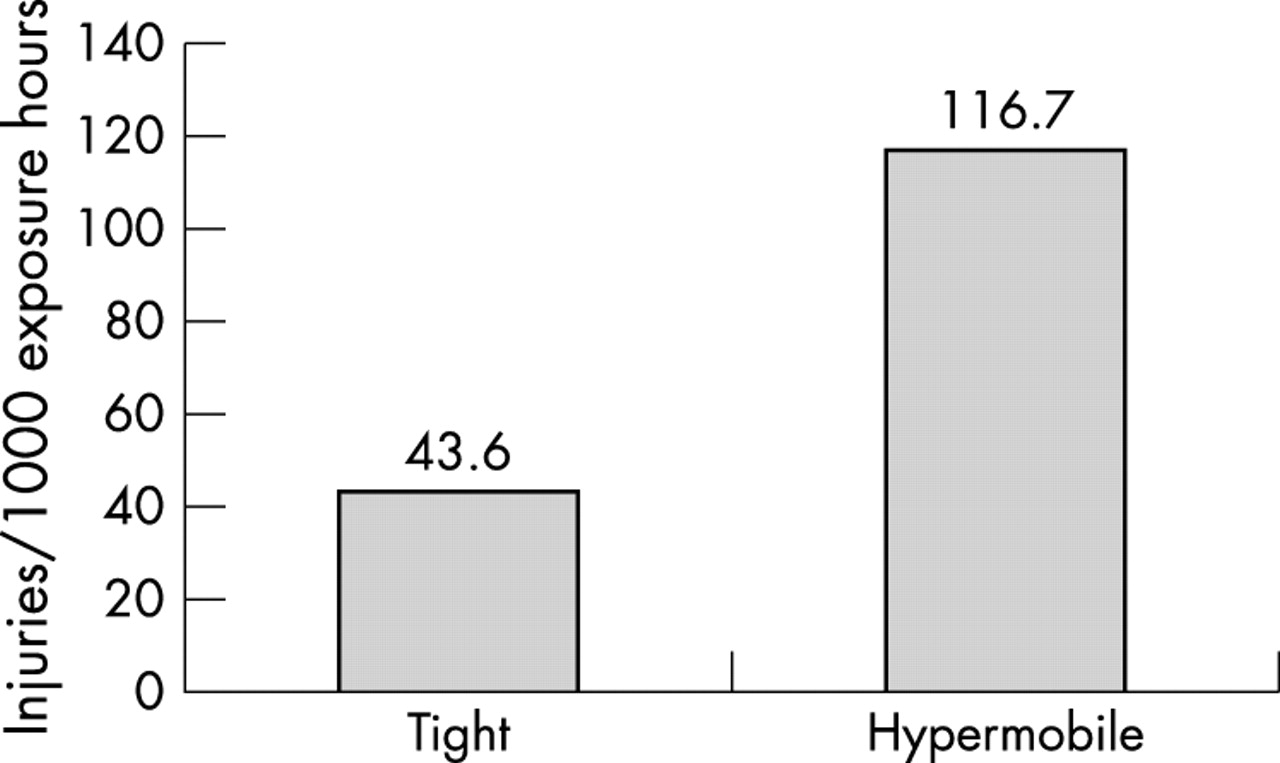
There were no significant differences (p<0.05) in injury rates between the three laxity groups. However, analysis of the injury data by hypermobility status alone did show a significant increase in injuries in the hypermobile (116.7/1000 hours) compared with the tight (43.6/1000 hours) group (p = 0.035; fig 3).
Injury rate per 1000 exposure hours by hypermobility status for male first division club rugby players.
Strength results
Table 1 shows the mean peak torque scores for the hypermobile and tight groups in knee flexion and extension. Initial observations suggest that the tight group were on average stronger, but there were no significant differences between the hypermobile and tight groups for the mean peak torque generated. Although not significant, the trend does indicate that tight subjects were on average stronger than their hypermobile counterparts. When hypermobility status and strength (classed as either being above or below the mean value) were compared with injury rates, no significant differences (p = 0.056) were found between these groups. Also, strength was not found to protect against hypermobility, as no differences were observed in injury rates between hypermobile athletes who were stronger or weaker than the mean torque value (p = 0.07).
Mean peak torque (N.m) scores for knee flexion and extension in tight (n = 9) and hypermobile (n = 9) male first division club rugby players
Furthermore, we were not able to predict injuries as a result of imbalances between muscle groups and between limbs.
DISCUSSION
It is becoming clear that sports injuries result from a complex interaction of identifiable risk factors, only a few of which seem to be identified. This study was conducted to determine if ligamentous laxity increased the seasonal incidence of injuries in male first division club rugby players. Previous research has produced conflicting evidence on whether ligamentous laxity does indeed play a role in determining the probability of an injury occurring in other sporting populations. The main finding of this study supports the hypothesis that the incidence of injury is higher in athletes considered to be hypermobile: 116.7/1000 hours v 43.6/1000 hours (p<0.05).
The incidence of injury for this population equates to one injury for every 8.6 and 22.9 hours of game time for the tight and hypermobile groups respectively. Despite being amateur players, the results for the hypermobile group correlate closely with those of professional rugby players (an overall injury rate of 120/1000 player hours15). A pooled data analysis of injury incidence in rugby league found an overall injury rate of 40.3 injuries per 1000 player hours.16 It is evident from these and previous results that the introduction of professionalism coincided with a similar rise in injuries for both levels of competition.17
This study of joint laxity found a mean ligamentous laxity score of 2.0 (2.4) (range 0–9). Other studies have reported an overall laxity score ranging from 1.8 (2.0) for men and 3.3 (2.2) for women1 to 3.7 for gymnasts and 4.36 for dancers.18 Clearly flexibility exists on a continuum scale, and scores on that scale are influenced by sex and the requirements of the sport. Rugby could be considered to be a sport in which good flexibility or a high degree of laxity does not have a positive outcome on performance. Therefore athletes with inherent ligamentous laxity do not have an advantage, and in fact could be disadvantaged by the increased risk of injury. It is therefore logical that athletes recognised as hypermobile should be steered into sports where this condition could be advantageous.
Take home message
Generalised ligamentous laxity may increase the incidence of injury in male rugby players. The Beighton-Horan assessment may help to identify athletes at increased risk of injury from potentially hazardous sports such as rugby so that they can be steered into more appropriate sports.
No significant differences in peak strength were found between the hypermobile and tight groups, indicating that laxity may explain the differences in injury rates between these groups. Also no differences were found between injury rates for hypermobile athletes who scored above or below the mean peak torque value. Therefore strength did not protect against injury in athletes with hypermobility. This does not support the ideas of Nicholas,6 who suggested a strengthening programme for “loose” individuals to compensate for their laxity. However, because of the small numbers tested, a significant finding may have been impossible, and the trend suggests that the tight subjects were stronger on average than their hypermobile counterparts.
There is disagreement, however, over the number of points necessary for the classification of generalised hypermobility. Cut off points that have been used are 4/91 and 5/9,11,18 making comparisons difficult. Differences in definitions and methodologies between studies have created problems in reviewing the literature.
A prescreening evaluation of all athletes could be designed and implemented to identify players with inherent hypermobility using the Beighton-Horan assessment. This method is simple and takes about two minutes to complete. It is ideal for collecting information on athletes at higher risk of joint injury and establishing appropriate preventive rehabilitation programmes.
Fatigue was not considered in this research but may be an important factor in the occurrence of injuries. Further research is needed in this area.