Article Text

Abstract
Background: Protective helmets in sport are important for reducing the risk of head and facial injury. In cricket and other sports with projectiles, national test standards control the minimum helmet performance. However, there are few field data showing if helmets are effective in reducing head injury.
Objectives: (a) To examine the performance of cricket helmets in laboratory tests; (b) to examine performance with regard to test standards, game hazards, and helmet construction; (c) to compare and contrast these findings with baseball and ice hockey helmets.
Methods: Impact tests were conducted on a selection of helmet models: five cricket, two baseball, and two ice hockey. Ball to helmet impacts at speeds of 19, 27, 36, and 45 m/s were produced using an air cannon and a Hybrid III dummy headform and neck unit. Free fall drop tests with a rigid headform on to a selection of anvils (flat rigid, flat deformable, and hemispherical rigid) were conducted. Resultant headform acceleration was measured and compared between tests.
Results: At the lower speed impacts, all helmets produced a good reduction in headform acceleration, and thus injury risk. At the higher speed impacts, the effectiveness was less. For example, the mean maximum headform accelerations for all cricket helmets at each speed were: 67, 160, 316, and 438 g for 19, 27, 36, and 45 m/s ball speeds respectively. Drop tests on to a hemispherical anvil produced the highest accelerations. The variation in performance increased as the magnitude of the impact energy increased, in both types of testing.
Conclusions: The test method used for baseball helmets in which the projectile is fired at the helmet may be superior to helmet drop tests. Cricket helmet performance is satisfactory for low speed impacts, but not for impacts at higher, more realistic, speeds. Baseball and ice hockey helmets offer slightly better relative and absolute performance at the 27 m/s ball and puck impacts.
- biomechanics
- cricket
- head injury
- helmets
- test methods
Statistics from Altmetric.com
Cricket is a popular ball sport involving the risk of ball to head impacts.1–3 In their review, Stretch et al1 state that head and face injuries account for 9–25% of injuries to batsmen. Emergency data collected in Australia for 1989–1993 showed that 44.4% of all cricket related presentations in children and 16.6% in adults were for head injury.2 Protective helmets are used regularly at all levels of cricket (recreational to professional) for batsmen or women and some fielders to prevent head and orofacial injury. Baseball and ice hockey players are exposed to similar risks of impacts and injury to head from ball and puck,3–6 and helmets are used regularly to reduce the injury risk. Unlike cricket and baseball, in ice hockey the main cause of head injury is impact with the boards or ice.7–9 The helmets in each of these sports have distinctive styling and underlying structural differences.
Helmets are designed to attenuate the impact energy and distribute the impact force. The design features that determine performance are the liner foam, its thickness and density, and the shell stiffness. Attenuation of impact energy is assessed in most test standards by dropping a helmet plus headform on to an anvil and measuring the acceleration of the headform. The helmet is deemed to have passed the test, when the headform acceleration remains below a specified amount—for example, 250 g. Although there is debate about the relation between the magnitude of biomechanical variables,10–12 such as headform acceleration and head injury risk, Macintosh et al13 estimated an 80% likelihood of head injury involving skull fracture or intracranial haemorrhage with a head acceleration of 200 g. Because of differences between tests involving anatomical specimens and laboratory tests involving headforms, permissible headform acceleration in many helmet standards is greater—for example, for pedal cycle helmets it is in the range 250–300 g.14,15 In general, the thicker the liner, the greater the potential for energy attenuation, but as this dimension is limited, the liner stiffness needs to be selected to control the amount of deformation.
There is a plethora of national and international standards governing the performance of cricket, baseball, and ice hockey helmets (table 1). In cricket, there is almost no direct comparison between the British and Australian standards, with differences in impact energy, impact delivery, and assessment criterion. For baseball helmets, the ball is fired at 27 m/s into the helmet, and ice hockey helmets are dropped on to an anvil in a more conventional test. Do the differences in test protocols result in effective helmets with unique sport specific properties?
Comparison of impact tests for sporting protective headgear
Little research on cricket helmet performance has been published. Stretch22 used a standard impact energy attenuation test and observed a relation between the liner construction and test performance. The test was intended to represent the energy of a cricket ball impacting a helmet at 160 km/h (44.5 m/s)—that is, 154 J. He found that the denser the liner, the better the performance. A speed of 160 km/h is faster than a ball is usually delivered in cricket.23,24 The faster ball speeds in cricket range from 32 m/s for first grade fast bowlers23 to 36–40 m/s for elite internationals and more than 40 m/s for “express” bowlers.
Research on the performance of baseball and ice hockey helmets is also limited. Honey9 attributed the decrease in the rate of concussion for children from 2.8/1000 player hours in 1974 to 0.5/1000 player hours in 1990 to the use of helmets.
The aims of this study were to compare and contrast cricket helmet performance in a selection of impact tests with baseball and ice hockey helmets, to correlate helmet performance with helmet construction, and to check the compliance of helmet performance to standards.
METHODS
Selection of helmets
A representative sample of cricket, baseball, and ice hockey helmets was purchased in Australia, the United Kingdom, and the United States in May and June 2001. The selection criteria were: the helmet met relevant standards; availability; popularity; construction differences.
Cricket helmets tested were: Albion Test 2000, Gunn & Moore Teknik, Gunn & Moore Diamond, Gray Nicolls Millennium, and Gray Nicolls Optimum. The helmets were in the size range 54–58 cm. The most common design consisted of a 3–4 mm thick shell and a 8–10 mm liner. The Gunn & Moore helmets conformed to the British standard, the others to the Australian standard. Rawlings and Cooper baseball helmets conforming to the National Operating Committee on Standards for Athletic Equipment (NOCSAE) were tested. The helmets have a 2 mm high density polyethylene shell and a 38 mm soft foam liner. The Bauer 5000 and 4000 ice hockey helmets were tested. Medium (55–60 cm) sizes were selected. The helmets met all relevant ice hockey standards, namely: CSA Z262.1, HECC, CE, ASTM F1045-99, and EN 967. The helmets had similar stiff shell structures, of 1–3 mm thickness, but the 5000 model had a stiff liner (expanded polypropylene) of thickness 10–20 mm, compared with the 4000 model which had a softer foam liner (vinyl nitrile) 12–15 mm thick.
Air cannon tests
An impact test was developed to simulate ball/projectile helmet impacts. Impacts that were radial towards the centre of the headform and not tangential or glancing blows were chosen in order to assess the more severe impacts.
An air cannon was used to deliver cricket balls, ice hockey pucks, and baseballs at preset velocities to an enclosure containing a Hybrid III head and neck. The Hybrid III is the standard crash test dummy used in frontal crash tests. The test helmets were placed on the headform. The ball was fired through a light gate which measured ball velocity just before striking the headform. Preliminary tests were conducted to ensure that the correct ball velocity and impact site were obtained. Helmets were impacted up to three times in each location, but at the same speed. Fresh sites and helmets were selected for testing at different impact speeds. The method resembles the NOCSAE baseball test method.
A Hybrid III 5th percentile female headform and neck were used. The headform was instrumented with a triaxial array of Endevco 2228c accelerometers, and the signals were conditioned with an Endevco unit model 133. Data were acquired at 16 000 Hz and filtered with a channel class 1000 filter.
The projectiles consisted of:
-
Cooper CVB official league solid core centre baseball, mass = 0.142 kg;
-
Kookaburra Comet cricket ball, mass = 0.156 kg;
-
Vegum “official” hockey puck, mass = 0.163 kg.
Six of each projectile were rotated through the tests, and there was no apparent damage to any of the projectiles during the tests.
The following impact velocities were selected to represent moderate to severe impacts: 19, 27, 36, and 45 m/s. The impact locations of centre front, centre rear, lateral left, and lateral right were used (fig 1). Test speeds were chosen to be comparable with test standards and the impact energies therein, and to reflect the range of ball speeds observed in cricket and baseball for recreational and elite.23–25
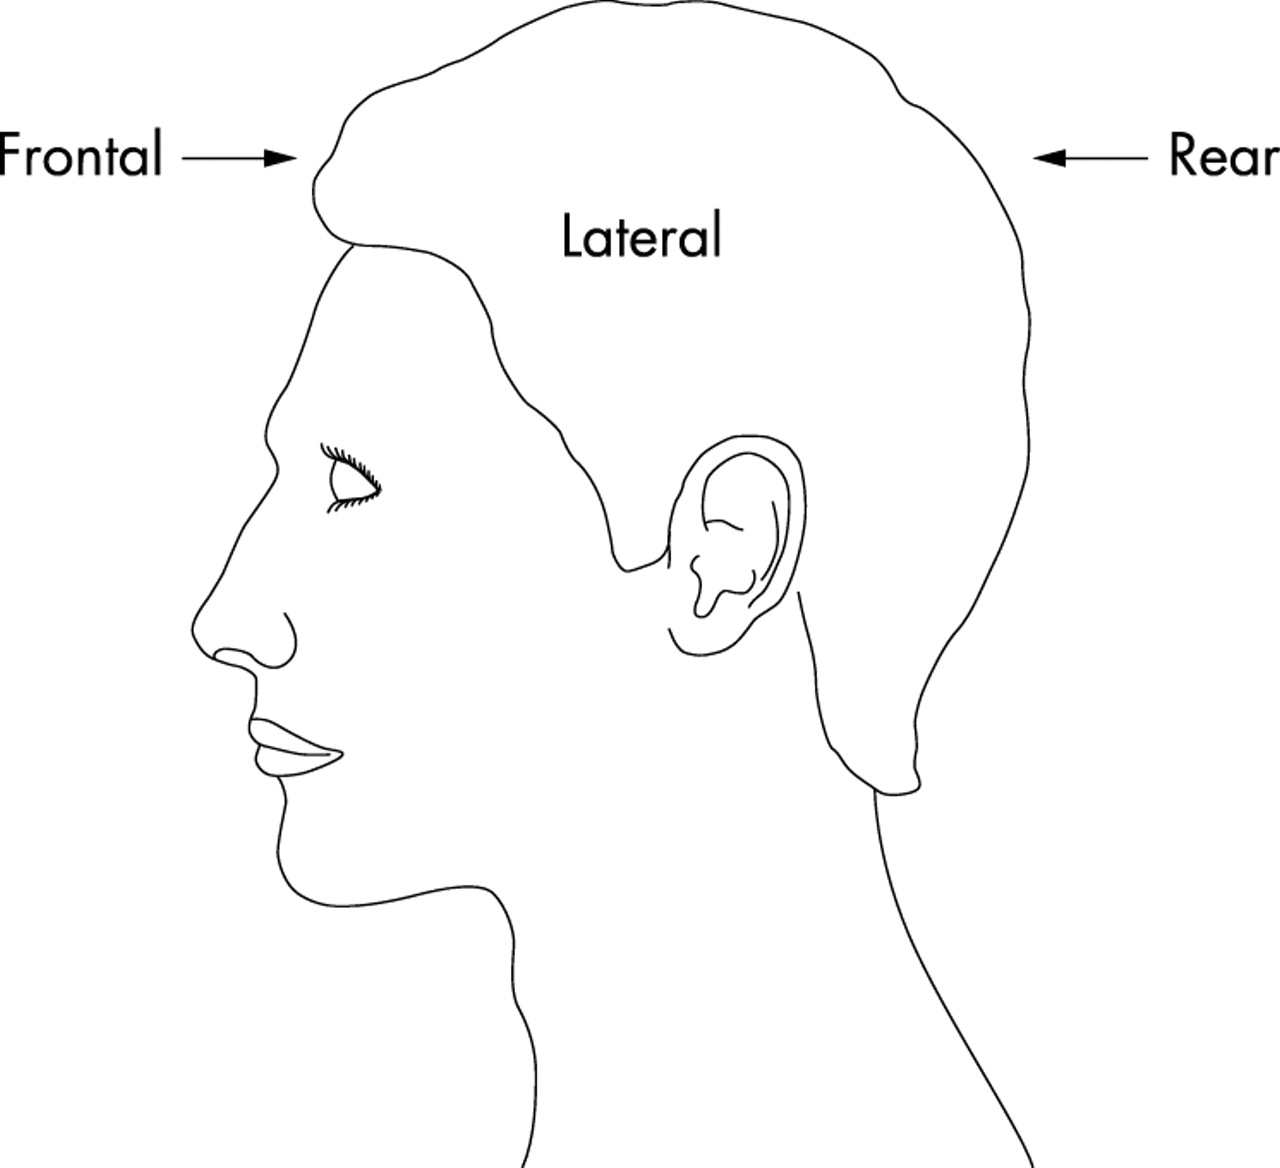
Location of helmet impacts.
Drop tests
A monorail guided, free fall impact device was used for the drop tests. These helmet tests are most commonly used. The mass of the headform, bearing, and connecting arm was 5 kg. A size C International Standards Organization (ISO) rigid magnesium alloy headform was used. A triaxial accelerometer, Kistler type 8793A500, was placed at the centre of mass of the headform. Acceleration data were acquired at 16 000 Hz and filtered with a channel class 1000 low pass filter. Three impact anvils were used:
-
flat steel, 200 mm diameter;
-
hemispherical steel anvil, 95 mm diameter (slightly larger than the 73 mm diameter specified in BS 7928);
-
flat modular elastomeric profiler (MEP), 152 mm diameter.
Drop tests were conducted from selected heights between 0.2 and 1.2 m, and thus speed (1.98–4.85 m/s) and energy (9.8–58.9 J). Impact speeds were measured with a timing gate. Each helmet was not subjected to all possible tests because of limited helmet availability and rationale—for example, cricket helmets were not tested with deformable anvils.
All tests were conducted at the Institute for Preventative Sports Medicine on the campus of St Joseph Mercy Hospital, Ann Arbor, Michigan, USA.
RESULTS
Air cannon tests
Ball to headform impacts
A series of ball and puck to bare headform tests were conducted to establish baseline data (table 2). The results reflect the slight differences in energy, because of ball mass, and the hardness of the balls and pucks. The baseball delivered the most severe impact, even though its energy was less than the other projectiles at each velocity. All bare headform impacts show the high potential for injury to the unprotected head as accelerations exceed 200 g.
Air cannon test results for ball and puck impacts against bare Hybrid III headform (impact site, centre front)
Ball to helmet impacts
Table 3 presents summary results for all impact sites combined on cricket, baseball, and ice hockey helmets. The maximum resultant headform acceleration was calculated for each test, and the mean of the maxima was calculated. The mean of repeat impacts was about 10% greater than the maximum for the first impact.
Resultant centre of gravity headform acceleration maxima for air cannon tests for all cricket, baseball, and ice hockey helmets
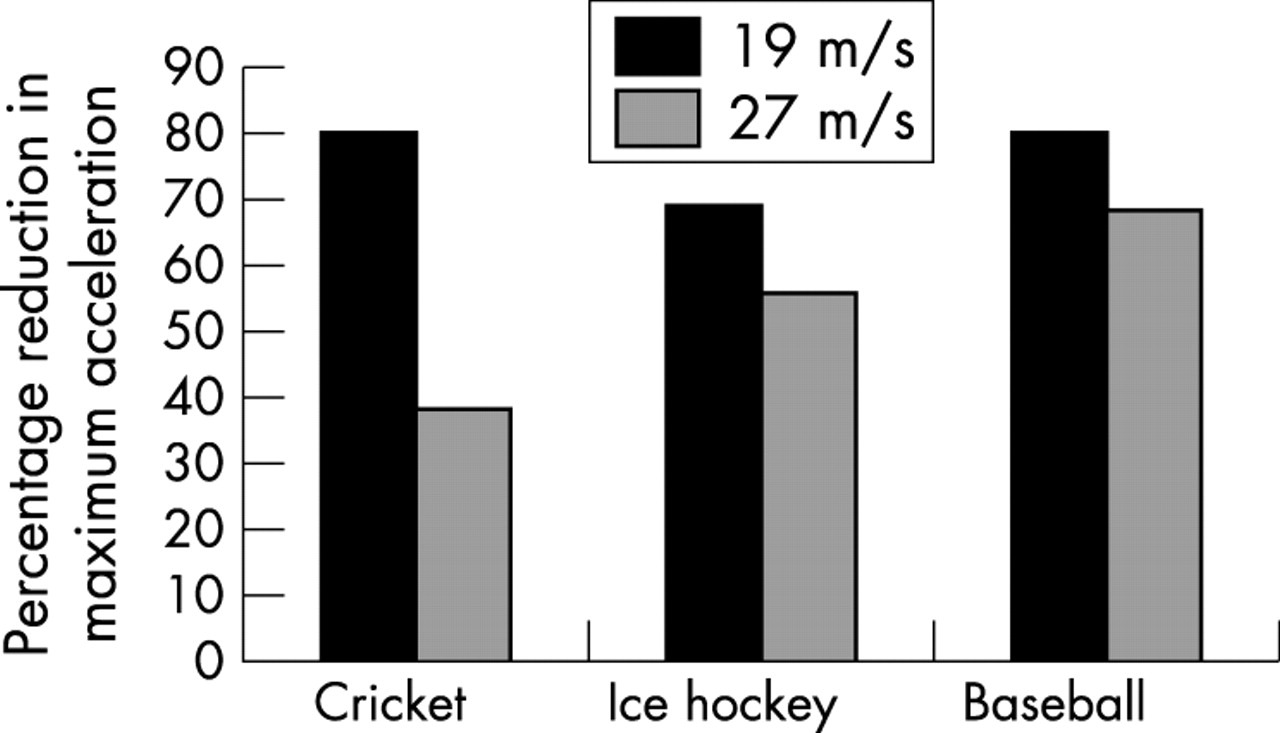
A comparison between the cricket ball impacts on the bare headform and those on the centre front of each cricket helmet model was made for the 19 and 27 m/s speeds. The results are presented as the percentage reduction in headform acceleration (fig 2). All cricket helmets reduced the headform acceleration by about 80% at the least severe impact. When the speed of impact was doubled, the reduction was only 40%. The differences in performance between the different cricket helmet models were not significant.

Percentage reduction in maximum resultant headform acceleration with cricket helmet compared with bare headform (centre impacts only). AS, Australian standard; BS, British standard. AS-A is helmet model A, etc. BS-A units were not available for the 57 J centre tests.
The mean maximum resultant headform accelerations for all centre impacts on cricket, baseball, and ice hockey helmets were calculated and compared with those for bare headform impacts with the relevant ball or puck (fig 3). For impacts at 19 m/s, the protection appears to be similar between helmets, but at 27 m/s the ice hockey and baseball helmets appear to offer greater relative and absolute protection than cricket helmets. Headform acceleration begins to exceed safe levels at speeds of 27–36 m/s.

Percentage reduction in averaged maximum resultant headform acceleration with helmet (cricket, baseball, and ice hockey) compared with bare headform. Helmet and projectile from same sport. Helmet model data have been combined. Centre impacts only.
Drop tests
Drop tests on to a flat rigid anvil, rigid hemispherical anvil, and in some cases the MEP anvil were conducted. The frontolateral aspect of the helmet was struck. Table 4 presents the results for cricket helmets. There are large differences between test results for helmet model and anvil; hemispherical anvil impacts result in the greatest accelerations. Typically, when repeat tests are undertaken on the same helmet and same site, the acceleration magnitude increases for each test, and varies by about 10–20% of the initial maximum acceleration. The better performance of AS-B in the hemispherical anvil impacts is due to it having a stiff 8 mm thick expanded polystyrene liner. The other cricket helmets had softer foam liners (possibly ethyl vinyl acetate or polyurethane). Interestingly, although the AS-B helmet performed the best on the drop tests, its performance on the air cannon tests was the worst of the cricket helmets.
Resultant centre of gravity headform acceleration for drop tests with cricket helmets
Air cannon and drop tests
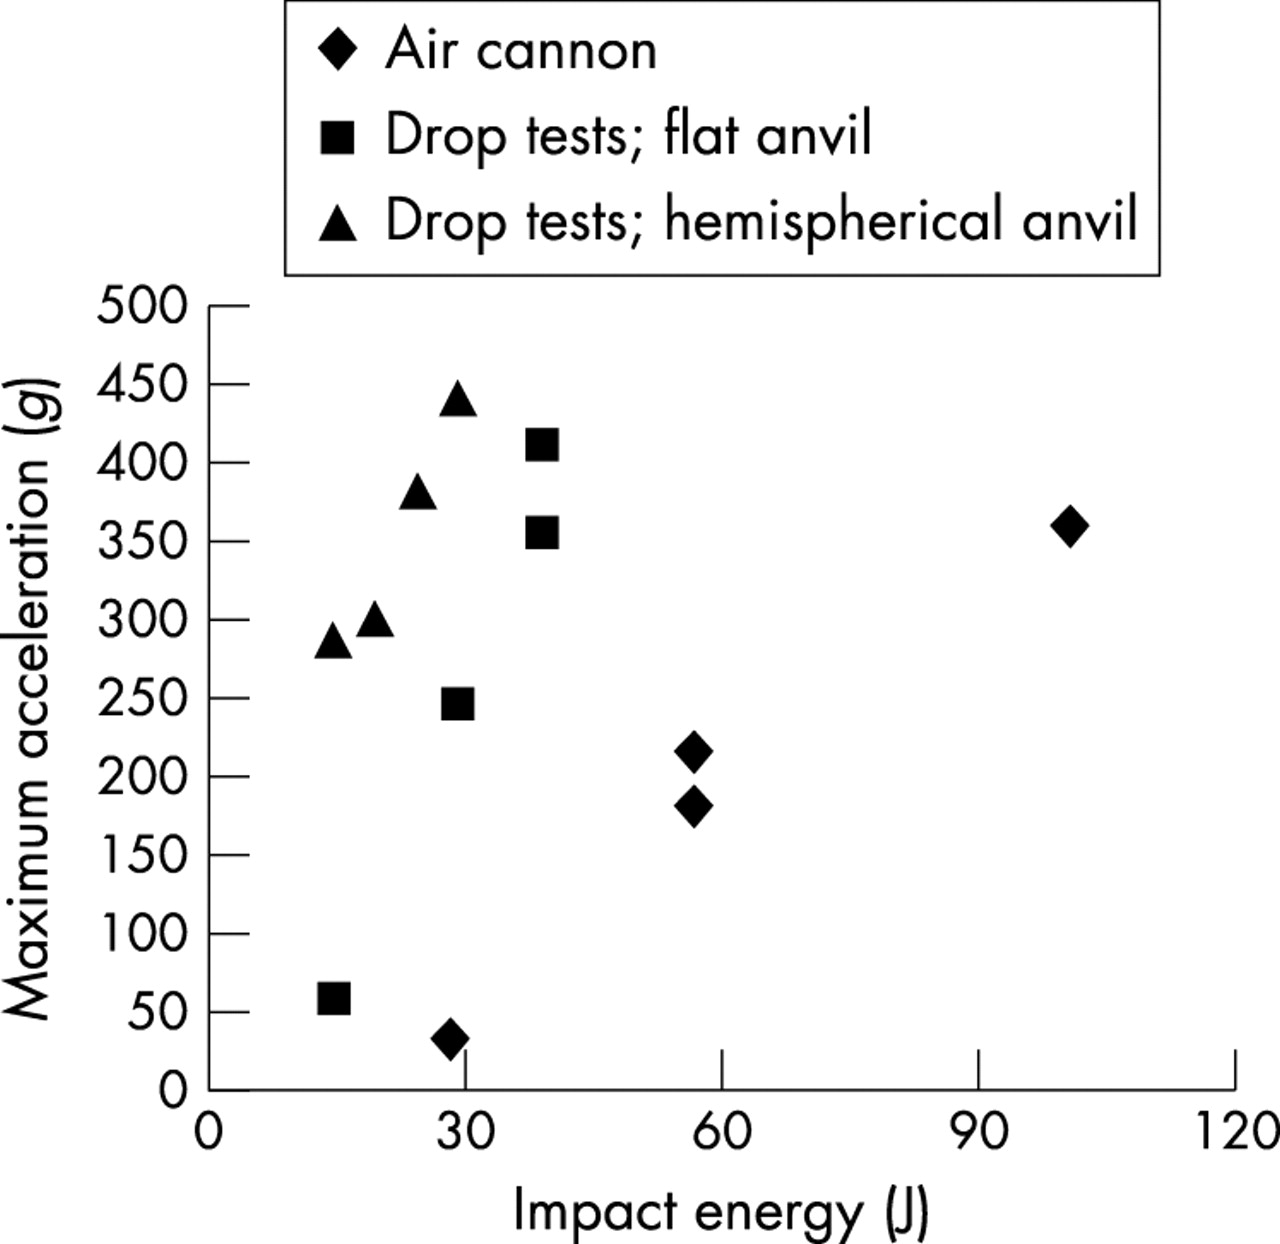
Figures 4–7 show the mean maximal resultant headform accelerations under each impact condition for all impact sites on examples of each helmet: a cricket helmet conforming to the Australian standard; a cricket helmet conforming to the British standard; the Bauer 5000 ice hockey helmet; a baseball helmet. Two data points per impact energy means that identical tests were conducted on two different helmets. To enable a comparison between all tests, the impact energy was calculated on the basis of impact speed and impactor mass. However, the hardness and stiffness of the projectiles, and the differences between the Hybrid III and rigid headforms also influence the results. It would be expected that, for the same impact energy, the acceleration measured with a Hybrid III headform would be lower than with a rigid headform, because of the deformable “skin” of the Hybrid III headform. The stiffness of the Hybrid III neck also influences the data.

Comparison of mean resultant headform acceleration maxima for air cannon and drop test results for a BS 7928 compliant cricket helmet (BS-B). All impact locations were combined.

Comparison of mean resultant headform acceleration maxima for air cannon and drop test results for an AS 4499 compliant cricket helmet (AS-A). All impact locations were combined.

Comparison of mean resultant headform acceleration maxima for air cannon and drop test results for a NOCSAE compliant baseball helmet (all sites combined).

Comparison of mean resultant headform acceleration maxima for air cannon and drop test results for Bauer 5000 ice hockey helmet (all sites combined). MEP, Modular elastomeric profiler.
For the Bauer 5000 ice hockey helmet, headform acceleration data from the air cannon test, flat anvil drop test, and MEP anvil drop test are very similar and follow a linear trend. The same is true for the data for the baseball helmet, except for hemispherical anvil impacts. With the cricket helmets, the acceleration data follow typical trends for each impact type, with greater impact energy resulting in greater acceleration, but there is little correlation between test data from the air cannon test and flat and hemispherical anvil drop tests.
DISCUSSION
A series of ball to cricket helmet impacts and drop tests were conducted on a selection of helmets and contrasted with tests on exemplar baseball and ice hockey helmets. Air cannon and drop test results show that there are a variety of ways in which a helmet can be constructed that will meet minimum performance requirements. Cricket helmets are generally constructed with a stiff shell and a thin liner. In contrast, baseball helmets have a very thick, soft liner and a more flexible shell. Owing to this thickness, which is almost four times that of the standard cricket helmet, it is able to attenuate energy in the air cannon tests to a greater level than the cricket helmets.
Results for the Bauer 5000 helmet show a strong correlation between maximum resultant headform acceleration and impact energy, irrespective of the impacting agent. This is due primarily to its thick and stiff expanded polypropylene liner, a feature that is not realised to the same extent in the selection of cricket helmets tested. The Bauer 5000 helmet may protect the wearer from the wider range of impact hazards in ice hockey:4,7,9 puck impacts and contact with the ice and boards. In contrast, with cricket helmets there is a wide range of maximum resultant headform accelerations for similar energy impacts delivered by different impactors to the same model helmet. The differences observed between cricket helmets in the drop tests were less obvious in the air cannon tests. In the latter, the results for each helmet are fairly similar (fig 8). If the air cannon tests are considered to be the “gold standard”, then neither the Australian nor British standard produces a better cricket helmet.

Cricket helmets: mean maximum resultant headform acceleration maxima for air cannon tests. All helmet data combined for centre front impacts.
The mean and range of maximum resultant headform accelerations are below 100 g for the least severe (19 m/s) cricket ball impact. For these lower speed impacts the helmets offer a great deal of protection (fig 3). However, the headform accelerations indicate a substantial head injury risk with ball impacts greater than 27 m/s as acceleration exceeds 300 g. This may be a concern for club and elite cricketers who are exposed to balls travelling at speeds of 30–45 m/s. Ball to head impacts are more likely to occur at the higher speeds because of the reduced response time, but skilled batsmen have quicker responses.1 The injury data show a greater proportion of head injuries in children,2 where ball speeds are usually lower. The severity of the typical ball impact may be less than tested here, as ball impacts may be more tangential to the head.
The slightly better performance of baseball helmets than cricket helmets shows that improvements are possible, although the style of the baseball helmet may not translate well to cricket, a sport with ingrained “traditions”. Other considerations, such as thermal comfort, batting position, and vision, are also important design constraints.
A mixture of field and laboratory research is required to identify the nature and severity of ball to head impacts in cricket. As cricket helmet performance in laboratory tests appears to be impact specific, it is important that the test methods simulate realistic impact scenarios, so that performance translates into protection on the pitch. There is no justification for two or more different cricket helmet standards, especially as helmet performance was similar for Australian and British standard compliant helmets. Substitution of an air cannon test for the current methods of testing cricket helmets may offer a more realistic test method and could equally be applied to testing face guards, as is the case in the ice hockey standards. The baseball helmet test with the higher energy impacts is one instrument that may be responsible for the better performance of the baseball helmets. Alternatively further development of a test method incorporating drop tests may be required, so that test equipment found in many laboratories can be used.
The similar performance of all three helmet types indicates that a multiuse helmet that could be used for ice hockey, cricket, baseball, cycling, skateboarding, and skiing, for example, is possible. This may improve safety by making helmets more affordable because of their greater range of application.
Conclusions
Laboratory impact testing of cricket helmets shows that they offer a high level of head protection in 19 m/s cricket ball impacts, moderate protection in 27 m/s impacts, and insufficient protection in higher velocity impacts. When the results for cricket helmets are compared with those for baseball and ice hockey helmets, it appears that the thinner, less stiff liners found in cricket helmets are responsible for their poorer performance. The more severe impact tests in performance standards for baseball and ice hockey helmets require thicker and/or denser liners to meet their test requirements. The test method in the NOCSAE baseball helmet standard19 simulates more realistically projectile impacts than methods in the Australian and British standards for cricket helmets, both to helmets and face guards. The development of a common standard for cricket helmets using similar test methods should be considered. To formulate such a standard, more information is needed about the impact hazards, such as ball impact speeds and injury risks, in cricket. The comparison of differently styled and constructed sports safety helmets is useful in showing the benefits that each design offers and provides valuable guidance for helmet development.
Acknowledgments
We thank the NSW sporting injuries committee for financial support through the FE Johnson Memorial Fellowship. The support of Beth Kedroski and Mr Raj Israel at the IPSM is greatly appreciated. We would also like to thank St Joseph Mercy Hospital for the use of their biomechanics laboratory. There is no conflict of interest as funding was not received from any helmet manufacturer, and neither author has a professional affiliation with a helmet manufacturer.