Article Text

Abstract
Background Precise and accurate field methods for body composition analyses in athletes are needed urgently.
Aim Standardisation of a novel ultrasound (US) technique for accurate and reliable measurement of subcutaneous adipose tissue (SAT).
Methods Three observers captured US images of uncompressed SAT in 12 athletes and applied a semiautomatic evaluation algorithm for multiple SAT measurements.
Results Eight new sites are recommended: upper abdomen, lower abdomen, erector spinae, distal triceps, brachioradialis, lateral thigh, front thigh, medial calf. Obtainable accuracy was 0.2 mm (18 MHz probe; speed of sound: 1450 m/s). Reliability of SAT thickness sums (N=36): R2=0.998, SEE=0.55 mm, ICC (95% CI) 0.998 (0.994 to 0.999); observer differences from their mean: 95% of the SAT thickness sums were within ±1 mm (sums of SAT thicknesses ranged from 10 to 50 mm). Embedded fibrous tissues were also measured.
Conclusions A minimum of eight sites is suggested to accommodate inter-individual differences in SAT patterning. All sites overlie muscle with a clearly visible fascia, which eases the acquisition of clear images and the marking of these sites takes only a few minutes. This US method reaches the fundamental accuracy and precision limits for SAT measurements given by tissue plasticity and furrowed borders, provided the measurers are trained appropriately.
This is an Open Access article distributed in accordance with the Creative Commons Attribution Non Commercial (CC BY-NC 4.0) license, which permits others to distribute, remix, adapt, build upon this work non-commercially, and license their derivative works on different terms, provided the original work is properly cited and the use is non-commercial. See: http://creativecommons.org/licenses/by-nc/4.0/
Statistics from Altmetric.com
Background
Body composition has a large impact on health and performance. In aesthetic sports, weight category sports and gravitational sports (in which body weight influences performance, eg, ski jumping, long distance running, etc), many athletes reduce weight rapidly or maintain an extremely low body weight or fat mass in order to gain a competitive advantage. Weight, fatness, energy intake and energy expenditure are closely related to each other. Therefore, extreme weight changes, very low body weight, extremely low body fat content, loss of tissue or insufficient bone mineral density are common in many weight sensitive sports.1–5 This may induce severe medical problems,1 ,5–7 and instead of the assumed competitive advantage, severe and long-lasting performance setbacks may result.8–11 The health of the athlete is a precondition for optimum performance. Protecting the health of athletes and optimising their performance both depend on the availability of accurate, precise and valid methods for the assessment of body composition.12 ,13
Recently, the IOC working group on Body Composition, Health and Performance presented a discussion paper on how to minimise risks for athletes in weight sensitive sports.5 Currently, there are no generally accepted lower limits of weight or fat mass for male and female athletes that can be used as scientifically based threshold values for optimal performance, or for raising the alarm, or for removal of athletes from competition. There are two reasons for this unsatisfactory situation: first, valid methods with sufficient accuracy for body composition assessment in athletes that are applicable in the field do not exist and second, interpretation of body composition data of athletes in various sports is a complex task, particularly because individual differences as well as general sexual dimorphism underpins differences that require consideration.
Body composition data must be seen in the context of other health parameters.5 Longitudinal changes in body mass (m) and body composition should be followed accurately and precisely for the assessment of the health risks associated with precompetition manipulation of body mass.5 Subcutaneous adipose tissue (SAT) measurement using skinfolds has a long tradition, but the accuracy obtainable with this technique is limited because skin and SAT are measured together in a compressed state without considering the compressibility and viscous-elastic behaviour at the individual measurement sites.12–14
Recently, a novel ultrasound (US) technique for measurement of SAT and embedded fibrous structures has been introduced.12–15 This US technique avoids the tissue compression and movement that occurs when using skinfold callipers and employs a recently developed image evaluation procedure for multiple thickness measurements of SAT layers.
Aims and contents
This US technique and the obtainable accuracy of tissue thickness measurements is analysed in part A. The introduction of a standard set of sites that fulfil the criteria for accurate and reliable measurements of SAT thickness is the content of part B, and interobserver reliability results obtained with this new set of sites in a group of competitive athletes are described in part C. Additional important information on the standardised application of this method for measuring uncompressed SAT thickness and on the interobserver results can be found in the online supplementary appendix.
Part A: US technique and accuracy
B-mode US imaging
B-mode (brightness mode) US images are generated by sequences of US beams which penetrate the tissue to create an image in which the brightness of the screen corresponds to the echo intensity in the plane of the scan. The principle of US imaging is the pulse-echo technique. A short pulse (several wavelengths long) is applied and travels with the speed of sound (c) in a given tissue. Diagnostic US systems conventionally use c=1540 m/s for calculating the distance (dUS) from the surface of the probe to the boundary between two tissues. The speed of sound in adipose tissue is lower than that in other soft tissues (1450 m/s).16 ,17
Standardised US imaging of SAT
US was applied to measure subcutaneous fat as early as 1965,18 and many applications followed19–24 in which the potential of this method was identified. A brief review of the history of US applied to measure body fat can be found in Müller et al.14 A novel approach for avoiding measurement errors due to high compressibility of fat14 ,25 and a semiautomatic image evaluation procedure designed to minimise measurement errors have recently been published.12 ,14 ,15 Since SAT is highly compressible, the US probe (transducer) has to be placed over a given site without any pressure. This is obtained by using a thick layer of US gel between the probe and the skin (a 3–5 mm thick gel layer should be seen above the skin in the US image). According to the standardised approach applied here, US measurements are made with the participant lying in a supine, prone or rotated position. A diagnostic US system (GE Logic e) with a linear probe operated at 18 MHz (in the harmonic mode) was used for the SAT images in this publication (axial resolution: about 0.10–0.15 mm). The application of the US measuring technique at the individual sites is described in part B (table 1). Important points for avoiding errors when using this standardised US method to measure SAT can be found in online supplementary appendix, part A.
Description of ultrasound (US) sites and measurement procedure (see figure 1)
Accuracy of US thickness measurements
Diffraction and technically obtainable minimum pulse length limit lateral and axial resolution approximately to the wavelength used. Diagnostic US probes (transducers) use frequencies from 3 to 22 MHz, which corresponds to a wavelength in soft tissue of 0.5–0.07 mm. US attenuation increases with increasing frequency—typical investigable depths are between 10 mm (22 MHz) and 200 mm (3 MHz). For studies of fat patterning in athletes or other individuals who have only thin layers of SAT, high frequencies (9–18 MHz) are recommended to obtain US images with high resolution. This enables thickness measurements with an accuracy that is limited only by furrowed borders and plasticity of the tissues. When using 18 MHz, the border resolution error due to the US resolution limit is about 0.1 mm on each side of the SAT. The calculated distance is the sound speed multiplied by half the echo time. Therefore, any deviation of the sound speed used by the US system from the actual sound speed in the tissue adds to the distance measurement error. In obese persons, where SAT is several centimetres thick, the border resolution error can be neglected; accuracy would be limited by incorrect sound speed rather than by US resolution. For instance, when measuring a 100 mm thick SAT layer, it does not matter whether the borders are detected with a resolution of 0.1 or 0.3 mm (corresponding to 0.1%, or 0.3%, respectively). Therefore, a lower frequency (which is necessary for thick tissue layers) will not reduce accuracy substantially, provided the speed of sound is set correctly.
In the distance evaluation algorithm (FAT Software; rotosport.com) developed for multiple tissue thickness measurements, the sound speed can be set appropriately for any biological tissue. Thus, the technical measurement error can be kept very low; this also holds true in thick fat layers. The limiting factors for accuracy are intrinsic in the tissue: furrowed tissue borders and viscous-elastic features of SAT. Since accuracy is limited primarily by these biological factors, and since precision limitations (reliability), not technical US accuracy limitations, will be the dominating factor of the overall error in most cases, it is of paramount importance to minimise these influences by standardising measurement sites and technique (see part B). An example analysis of technically obtainable measurement accuracy can be found in online supplementary appendix, part A. Interobserver reliability is analysed quantitatively for a sample of athletes in part C of this publication.
Semiautomatic multiple thickness measurement of SAT
For measurement of a series of thickness values in a given US image, an image segmentation algorithm for detecting the SAT contour was applied14 and US images were evaluated by means of a semiautomatic distance measurement algorithm (FAT Software, rotosport.com). Sound speed was set to 1450 m/s in the evaluation software for distance calculation in adipose tissue.16 ,17 Usually 50 to 300 individual thickness measurements resulted from one image (depending on the selected region of interest). Mean, SD, median, minimum and maximum values were automatically calculated. The tissue segmentation was controlled visually and, if necessary, parameters that determine the accepted segment inhomogeneity could be set manually to optimise SAT contour detection. The software also enables an operator to distinguish between distances in which embedded tissues (eg, fibrous structures) are included (dINCL) or excluded (dEXCL). The thickness of the embedded structures is also determined: dES=dINCL-dEXCL.
Part B: standardisation of US sites and procedure
A new set of sites that provide anatomical and image clarity is presented in this part. An accurate description of these sites and the development of a basis for standardising this US measurement technique are the core of this section.
The US approach to measure SAT outlined in part A was first applied to the set of sites used for skinfold measurement (International Society for the Advancement of Kinanthropometry—ISAK sites), but several of these skinfold sites do not allow clear US images,14 ,15 and the marking of ISAK sites requires specific knowledge of anatomy and detailed anthropometry training.26 ,27 ISAK sites were defined for skinfold studies, but do not optimally fulfil the criteria for US measurement of uncompressed SAT. Therefore, identification of sites that can be found easily and reproducibly, also by those who lack specific anthropometry experience, was necessary for SAT patterning studies using diagnostic US. The search for new sites was determined by the following criteria: the set of sites represents trunk, arms and legs; sites can easily be marked with high precision after 1 h of training; all distances necessary to define the new sites are relative to the person's body height; anatomical structures are easily identifiable in the US image (dermis, SAT, fascia of the muscle); and SAT thickness does not change much in the vicinity of the site.
Description of standard sites selected for US measurements of SAT patterning
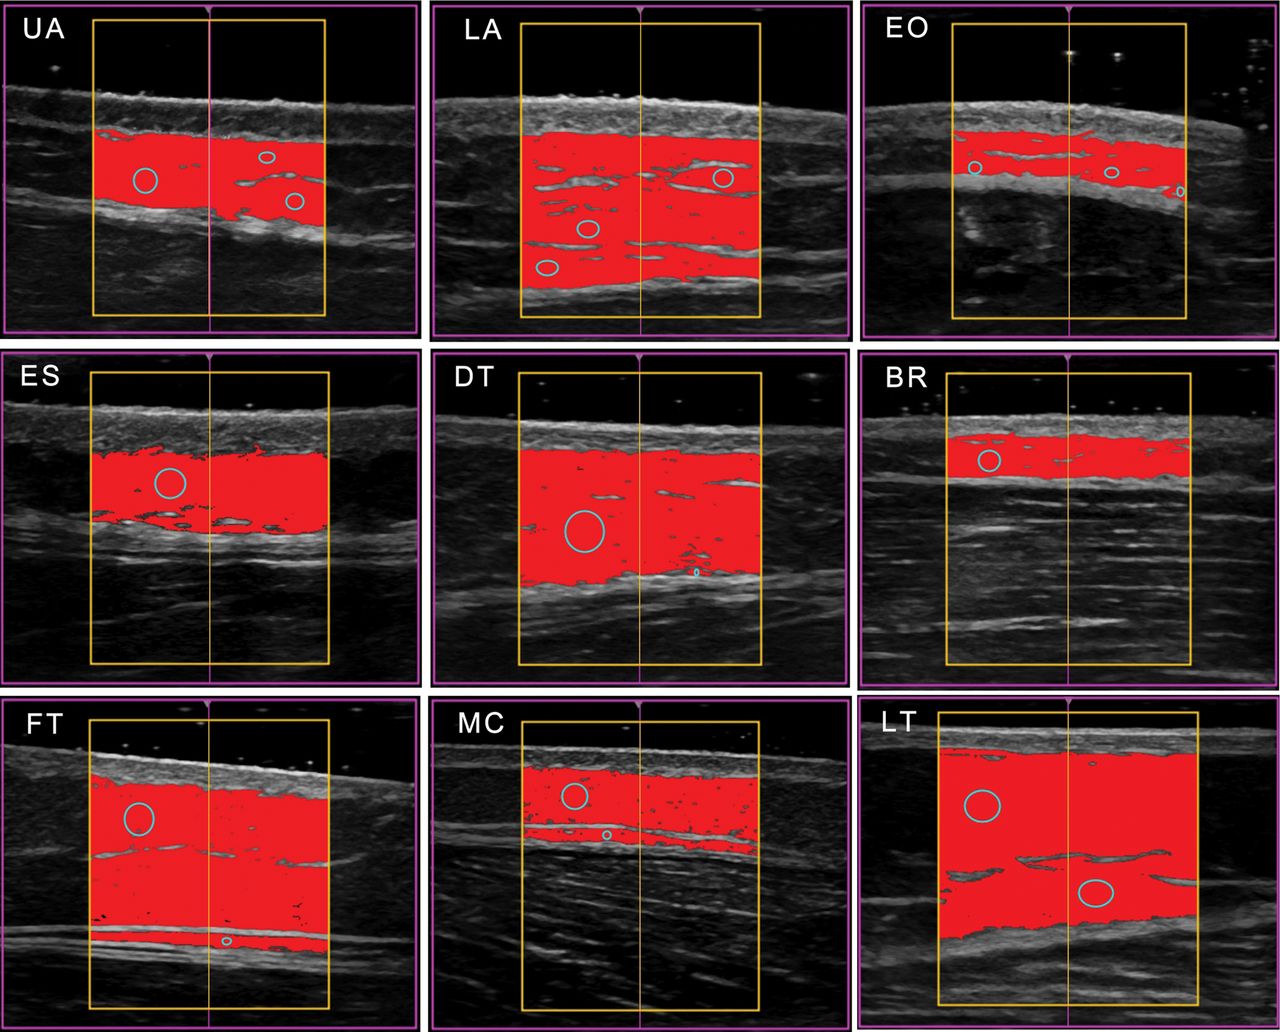
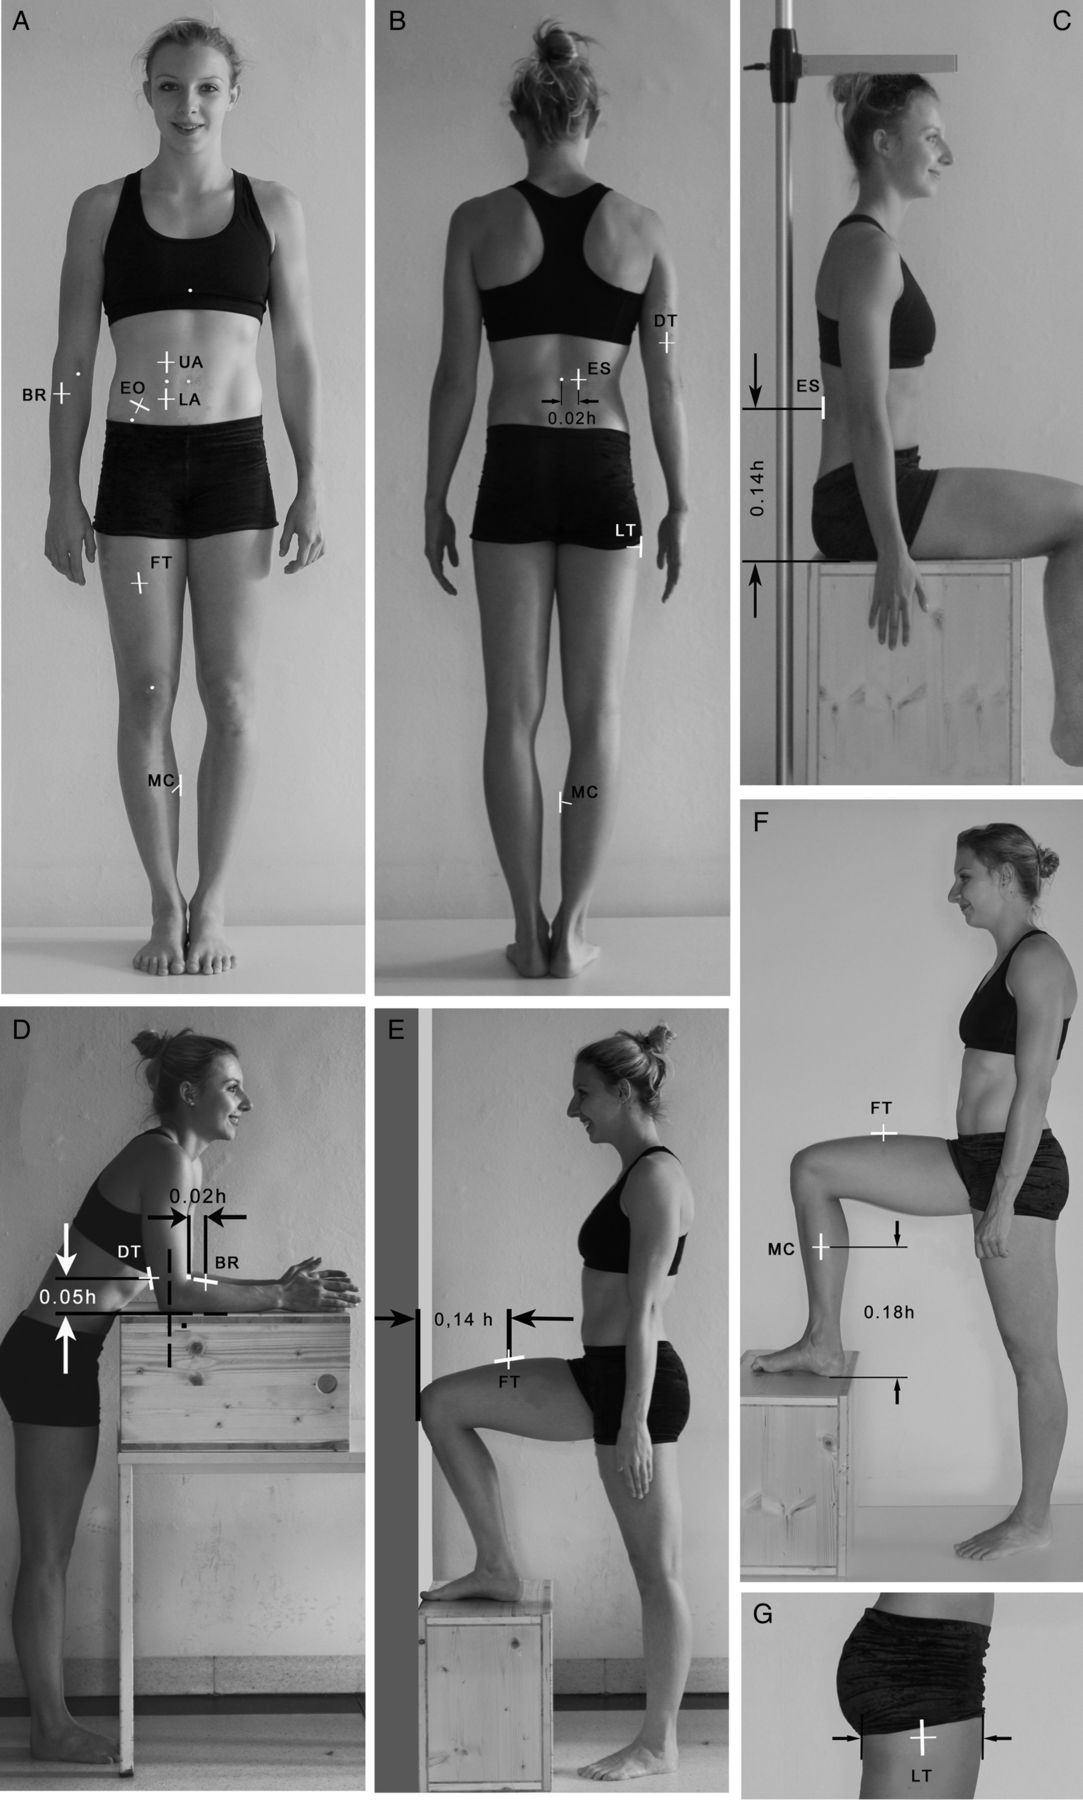
Table 1 describes the basic set of eight sites that were selected for analysis of SAT patterning. All sites are marked on the right side of the body (figure 1A–G). The table also includes notes on how to take the US images at the individual sites. Sites UA (upper abdomen), LA (lower abdomen) and EO (external oblique) are marked in the standing position (figure 1A). In the fat patterning studies described in this publication, the EO site was used. This site is close to the supraspinale ISAK site, but recent experience has shown that SAT layers are very thin at this site in athletes and do not contribute substantially to the sum of SAT thicknesses, and marking takes too much time and can be difficult in obese persons. Therefore, EO should only be used as an optional site in future studies. The site ES (erector spinae) is marked in the stretched sitting position (figure 1C), while sites DT (distal triceps) and BR (brachioradialis) are marked with the forearm supported on a table and the arm held vertically (figure 1D). The site FT (front thigh) is marked with the foot placed on an anthropometric box which is placed in front of a wall such that the thigh is horizontal and the big toe and the knee touch the wall (figure 1E). Site MC (medial calf) is marked with the right foot on a box of appropriate height such that the upper leg axis is horizontal and the lower leg vertical (figure 1F). LT (lateral thigh) should be used in the core set of eight sites to determine SAT thickness in this fat depot area of the thigh. The site is marked in the standing position at the midpoint of the sagittal thigh diameter at the height of the gluteal fold (the height at the most dorsal aspect is used in case the fold is not horizontal).

Ultrasound sites. (A and B) Survey of the US sites described in table 1. (C–G) Body positions when marking these sites. (C) shows how to mark the ES site, and also how to measure sitting height (s).
It is important that the participant looks forward at all times when the trunk sites are marked because movements of the head affect marking accuracy. It should also be noted that, while marking is done in a standing or sitting position, all US measurements are made with the participant lying in a supine, prone or rotated position, as described in table 1.
Examples of fat patterning results
A typical US image from the MC site is shown in figure 2. Below the black band corresponding to the gel layer between the probe and skin are the epidermis and dermis, and the dark (almost black) SAT layer (interrupted by a fibrous structure in this case); the fascia of the muscle, and the muscle underneath can be identified easily. The borders of SAT (skin and fascia) are white bands without interruption (no ‘black holes’ are included in the white bands—this is a necessity for the semiautomatic image segmentation).

Typical example of an ultrasound image of SAT site: medial calf (MC). Structures of relevance for US image evaluation are marked. In the right-hand image, the detected SAT region is displayed in white. Within the region of interest, the evaluation algorithm measured automatically 280 SAT thickness values (along 280 vertical lines in the image). Means: DINCL=1.97 (±0.14) mm, DEXCL=1.62 (±0.16) mm, and the difference DES=0.35 mm, which represents the mean thickness of the embedded (fibrous) structures. DINCL: thickness with fibrous structures; DEXCL: thickness without fibrous structures. Sound velocity was set to c=1450 m/s. Image depth was 15 mm. SAT, subcutaneous adipose tissue.
A series of US images of a female gymnast, after a phase of reduced training, is shown in figure 3, while figure 4A displays the corresponding SAT thickness values, and figure 4B shows the SAT pattern of the athlete 4 months before when she was in full training. In figure 3, the structures of relevance are easily identifiable: skin, SAT and muscle fascia. At the LA, an intermediate fascia structure is visible (Camper's fascia). In order to determine the precise location of the muscle fascia (the lower border of SAT) in this case, the US probe was applied with varying pressure on the skin (with just a thin layer of gel) before starting the measurement without compression (using a thick layer of gel). The compressibility of SAT is higher than that of muscle tissue and the associated changes in the image due to changing compression enabled the observer to distinguish clearly between them. At the ES site, the thicker skin of the posterior trunk can be seen below the black layer of gel, followed by an almost homogeneous (almost black) SAT layer, and finally the fascia above the muscle appears as a light band. An intermediate fascia is present in this athlete at the FT and MC sites. The seeds from which the SAT contour detection algorithm started are also shown in the images.
Series of SAT measurements at the sites described in table 1. Typical US images captured for fat patterning analysis. A linear probe (GE, L18) operated at 18 MHz (in harmonic mode) was used. Image depth was 20 mm. Camper's fascia is visible at the lower abdomen (LA) site. Mean SAT thicknesses (in mm) are (compare to figure 4A): UA: 4.26, LA: 8.30, EO: 2.44, ES: 4.29, DT: 7.11, BR: 2.24, FT: 8.99, MC: 4.04, which sum to DINCL=41.67 mm in this example. Thickness at LT: 9.85 mm. The mean thicknesses without fibrous structures are: UA: 4.09, LA: 7.30, EO: 2.21, ES: 4.04, DT: 6.84, BR: 2.13, FT: 8.30, and MC: 3.55, and the sum DEXCL=38.47 mm; LT: 9.43 mm. UA, upper abdomen; LA, lower abdomen; EO, external oblique; ES, erector spinae; DT, distal triceps; BR, brachioradialis; FT, front thigh; and MC, medial calf; LT, lateral thigh; SAT, subcutaneous adipose tissue.

Survey plots of fat patterning in five athletes. The columns show the mean values of the semi-automatic multiple thickness measurements for the eight US sites. The mean thickness value of the SAT thickness in a given ultrasound image (within the region of interest) is termed DINCL (grey) when fibrous structures are included, and it is termed DEXCL (black) when fibrous structures are subtracted. A: Female artistic gymnast in a phase of reduced training (m=59.6 kg, BMI=20.5 kgm−2, DINCL=41.7 mm). B: The same female gymnast 4 months previously when in full training (m=58.2, BMI=20.0 kgm−2, DINCL=25.8 mm). C and D: Female swimmers (m, h, BMI, DINCL: 59.4 kg, 1.685 m; 20.9 kgm−2, 18.0 mm; 67.0 kg, 1.830 m, 20.0 kgm−2, 60.6 mm); both were in preparation for the 2015 world championships. E: World class swimmer (BMI=23.7 kgm−2, DINCL=9.1 mm). F: National level artistic gymnast (BMI=21.4 kgm−2, DINCL=6.3 mm). UA, upper abdomen; LA, lower abdomen; EO, external oblique; ES, erector spinae; DT, distal triceps; BR, brachioradialis; FT, front thigh; and MC, medial calf; LT, lateral thigh.
Examples of survey plots of the fat patterning in five athletes are shown in figure 4A–F. Figure 4A represents SAT patterning in the female gymnast whose US image series is displayed in figure 3. DINCL changed by 62% during a phase of reduced training. This large increase in the SAT thickness sum was associated with a weight gain of only 1.4 kg. Figure 4C,D show SAT patterning of two female swimmers; both were preparing for the World Championships in 2015. Between them, SAT thickness sums DINCL differed by 330% (18.0 and 60.6 mm, respectively). Figures 4E (male world champion in swimming) and 4F (international level male gymnast) show extremely low SAT values: the sums of the eight sites DINCL are 9.1 and 6.3 mm, respectively (this equals a mean SAT thickness in these athletes of only 1.1 and 0.8 mm). Body mass index (BMI) does not correlate with sums of SAT thicknesses in the athletes whose SAT thicknesses are shown in figure 4.
Discussion of the site selection and standardisation process
Final selection of the core sites for US SAT patterning studies was a long process. We began with the eight ISAK sites for skinfold measurements because of the existing experiences at these sites.19 ,26–28 A comparison with ISAK skinfolds showed the low validity of skinfold thickness measurements for determining SAT thickness because of the high compressibility of fat.14 Such accuracy limitations due to the varying compressibility of SAT are to be expected at all other sites that have been used for skinfold measurements as well.29 Using the individual body height (h) as the distance reference for all sites increases the marking precision substantially and is better than using fixed distance values for all persons independent of their differing body dimensions. Further considerations that influenced the site selection process can be found in online supplementary appendix, part B.
The predictive value of SAT thickness data obtained by US in terms of total body fat remains to be analysed within the framework of validation studies using multicomponent body composition models.12 ,30 The obtainable accuracy (see part A) and precision (see part C) support the expectation that total body fat assessment based on this US technique should result in better adiposity estimates than that based on other field methods, particularly for athletes and other lean individuals in whom internal fat is low.
There is a potential to replace other field methods because of the high accuracy and precision obtainable with US; however, it will take some time until comprehensive reference data become available for comparing and interpreting the results obtained in various groups of athletes. Until then, other field methods may remain in parallel use, although their measurement accuracy does not reach the level desired for medical diagnoses, performance optimisation strategies or ‘no-start’ decisions.
Part C: interobserver reliability
A comparison of the results obtained by three observers using the standardised US method described in part A and part B is presented in this section. Three observers measured the eight sites each in each of 12 athletes. Each observer evaluated his own 96 images.
Methods
US sites for measurement of SAT patterning
All sites were marked on the right side of the body. The sites used for this interobserver study were: UA, LA, EO, ES, DT, BR, FT and MC. LT was not used here.
Anthropometry
Anthropometric data included: m, h, sitting height (s)—measured in the fully stretched position, (BMI=m/h2) and the mass index (MI1). MI1 considers individual sitting height: MI1=0.53 m/(hs).3 ,4 ,31 For s/h=0.53, MI1 equals the BMI.
Statistics, participants and observers
Values are presented as means±SDs and distribution of data is shown in box plots. Further information on statistical methods, participants and observers can be found in online supplementary appendix, part C.
Results
Figure 5 shows the three observers’ individual SAT thickness sums DINCL obtained from the eight sites plotted over the mean value of the three observers’ sums (in a given athlete). Values are presented in table 2. Online supplementary figure 8 and supplementary table 4 show the results for DEXCL. Sums of SAT thickness measurements with the embedded fibrous structures included are termed DINCL, while DEXCL denotes measurements with the fibrous structures excluded (subtracted). Statistical characteristics for DINCL are: R2=0.998, ICC=0.998, SEE=0.55 mm, and for DEXCL: R2=0.997, ICC=0.996, SEE=0.66 mm. Deviations for DINCL were slightly smaller because there is just one upper border and one lower border to be determined by the algorithm, whereas for DEXCL, there are several additional borders to be determined to measure the additional thicknesses of embedded structures.
Measurement results for the three observers
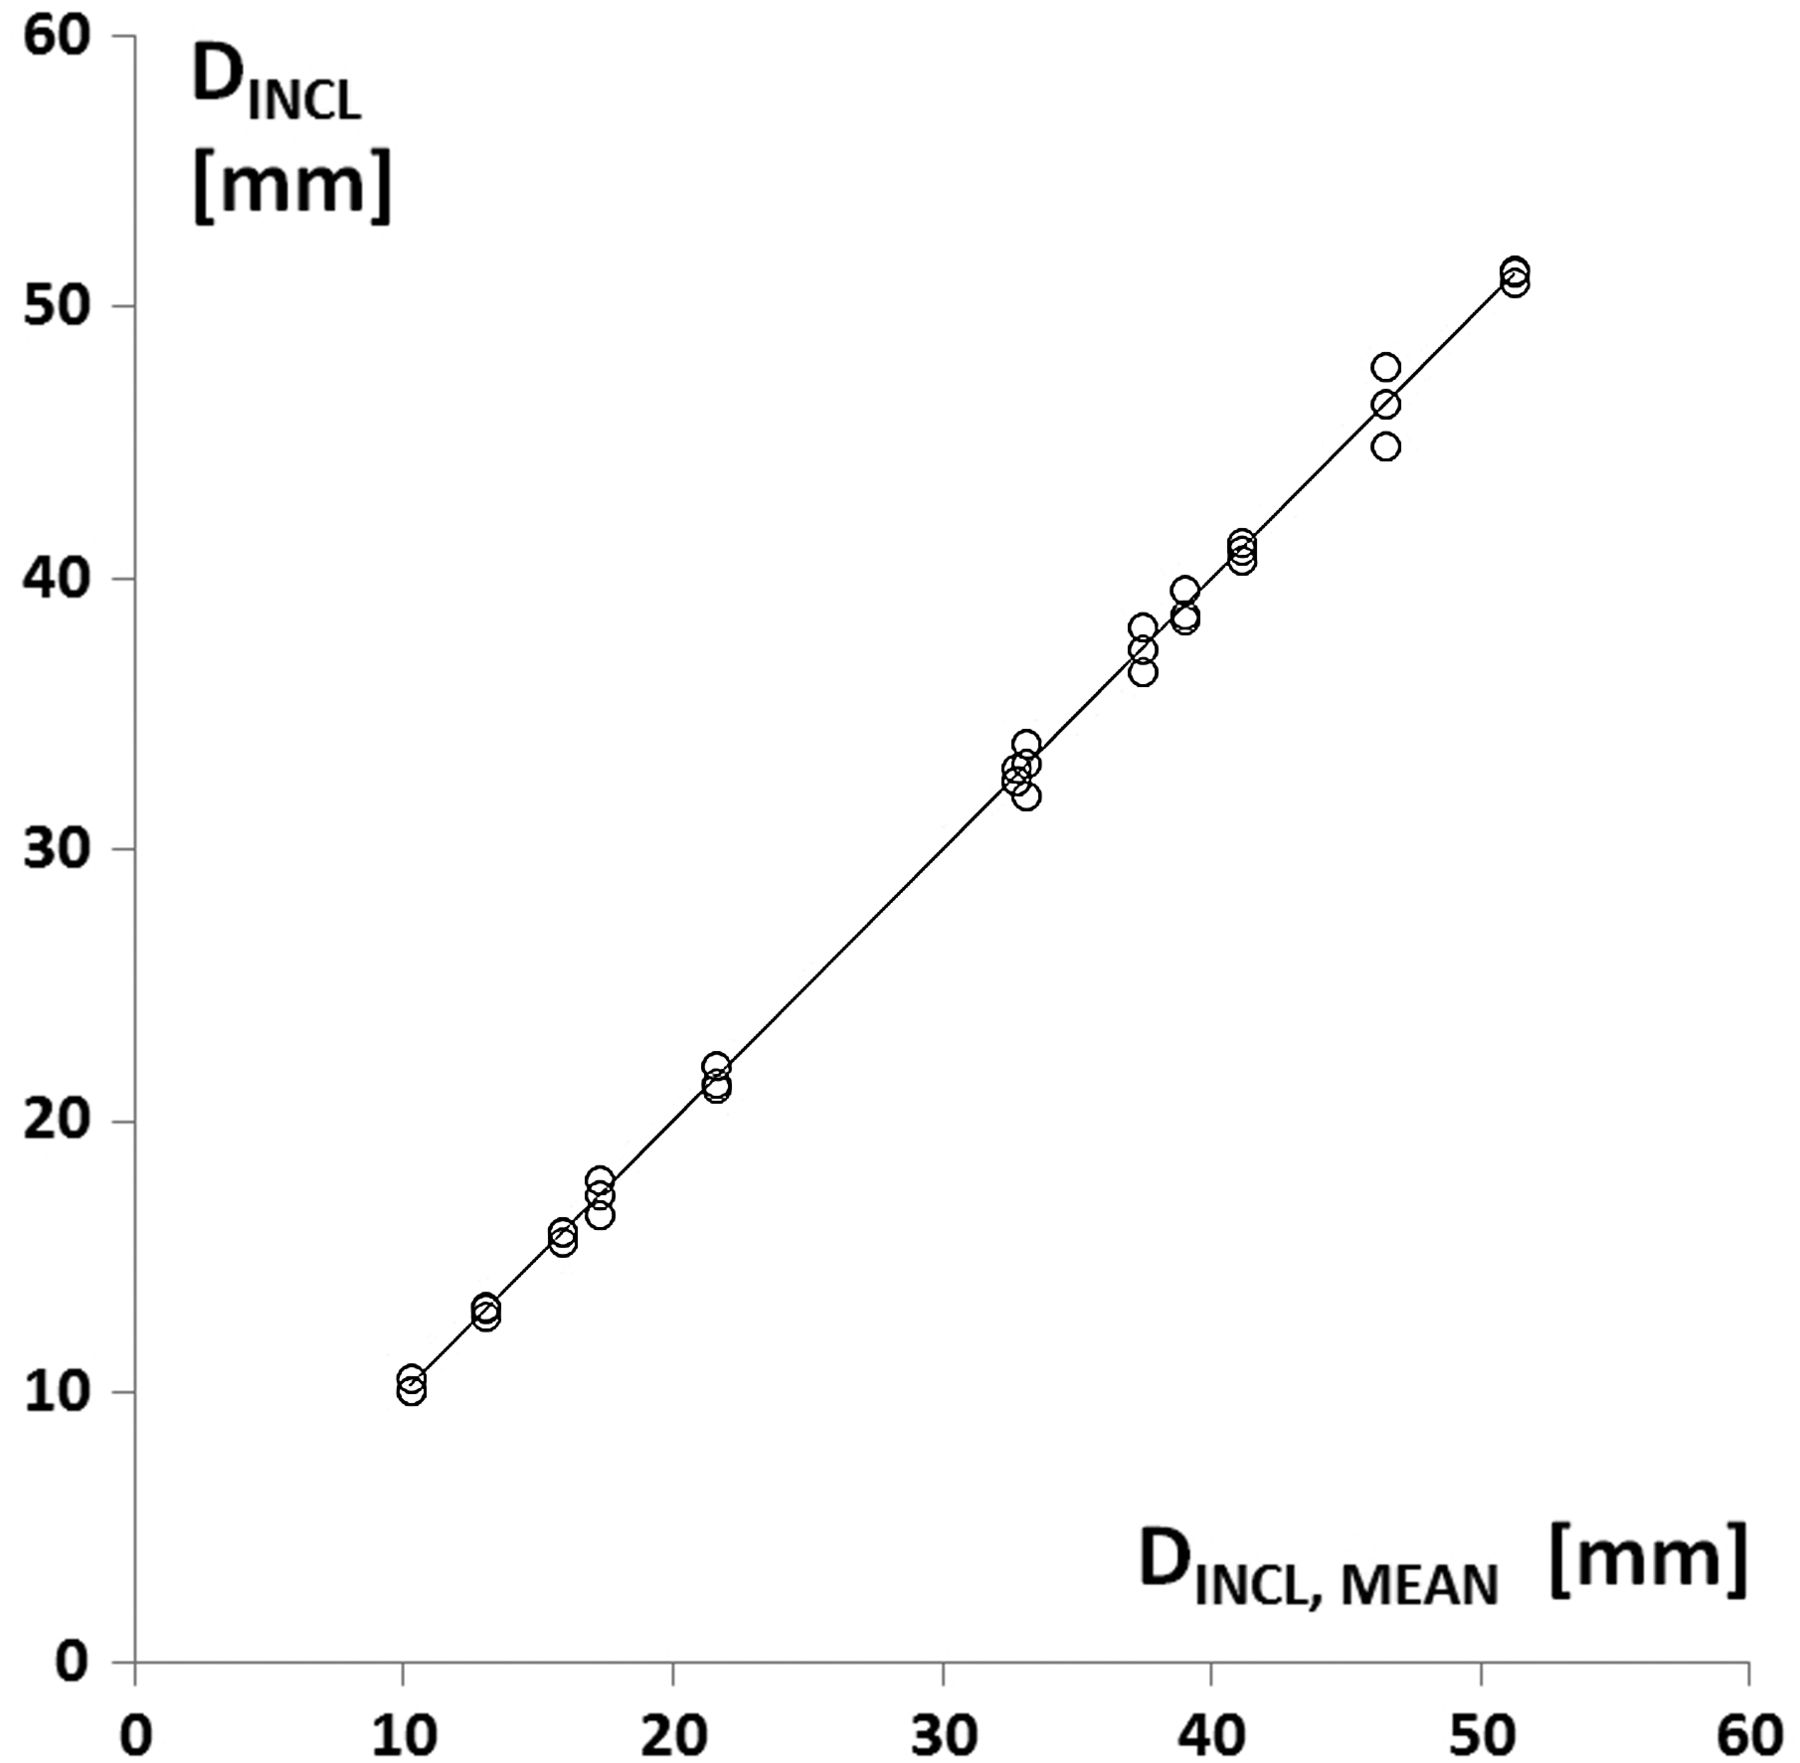
Sums of thicknesses from eight sites measured by the three observers in 12 athletes. The sums D of the individual observers (in a given participant) are displayed over the mean value of the three observers. Sums of SAT thicknesses with the embedded fibrous structures included (DINCL) are shown. R2=0.998 (p<0.01), SEE=0.55 mm, ICC=0.998 (lower 95% CI limit: 0.994; upper 95% CI limit: 0.999). SAT, subcutaneous adipose tissue.
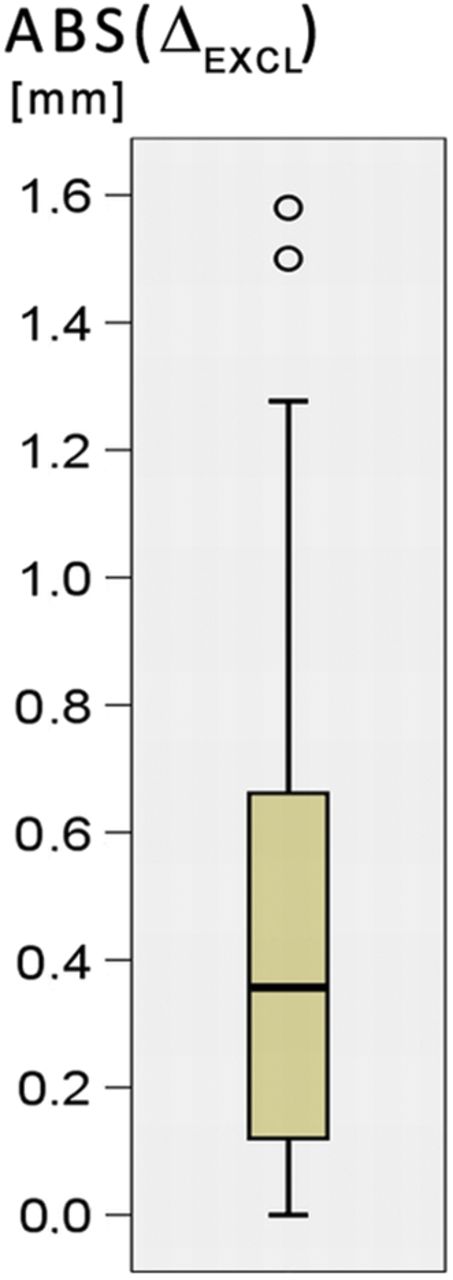
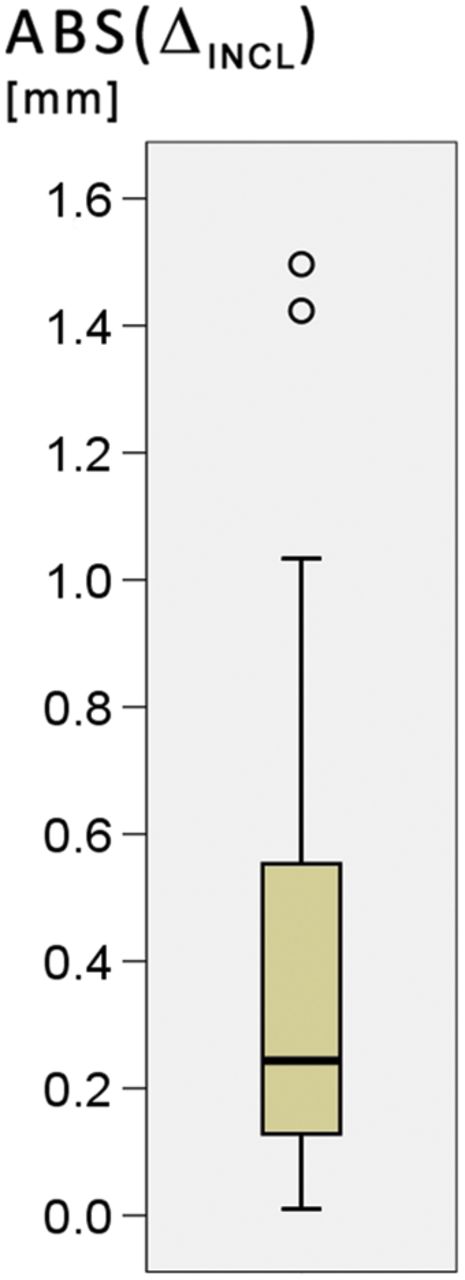
Box plots in figures 6A and 6B represent the absolute values of the individual observer deviations from their means. The three observers measured the sums of eight sites in 12 athletes, resulting in 36 comparisons of SAT thickness sums. Median scores of the absolute deviation values ABS(ΔINCL) and ABS(ΔEXCL) were 0.24 and 0.36 mm, respectively. Maximum deviations of individual observer sums of thicknesses were: ABS(ΔINCL,max)=1.50 mm and ABS(ΔEXCL,max)=1.58 mm. There are two outliers in each box plot. A comparison of the US images from the three observers showed that an intermediate fascia (Camper's fascia) instead of a muscle fascia had erroneously been used by one observer as the lower border of SAT. The SDs of the observer differences from the mean were: SD(ΔINCL)=±0.54 mm, and SD(ΔEXCL)=±0.65 mm, respectively. The 1.96·SD values, representing 95% of measurements, were ±1.1 and ±1.3 mm, respectively (compare with online supplementary figures 9A and 9B).

Observer differences from the mean. Three observer measurements of the sums from the eight sites in each of the 12 athletes (N=36). The absolute values of the observer differences (their individual sums from eight sites DINCL minus the mean of the three observers DINCL,MEAN) are used for this box plot: ABS(ΔINCL)=ABS(DINCL−DINCL,MEAN). Median was 0.24 mm, IQR was 0.46 mm, and maximum deviation from the mean was 1.50 mm.
Absolute values of differences (fibrous structures excluded). The absolute values of the individual observer differences (their individual sums from eight sites DEXCL minus the mean of the three observers DEXCL,MEAN) were used: ABS(ΔEXCL)=ABSD(EXCL−DEXCL,MEAN). Median was 0.36 mm, IQR was 0.57 mm, and maximum deviation from the mean was 1.58 mm.
Box plots in online supplementary figures 9C and 9D represent the distribution of the relative errors Δrel=100·Δ/DMEAN (in per cent). For ΔINCL,rel, the median is 1.0%, maximum is 3.9%. For ΔEXCL,rel, the median is 1.6%, maximum is 5.3%. The SAT thickness sums for DINCL,MEAN ranged in this group of athletes from 10.2 to 51.2 mm, and for DEXCL,MEAN from 7.3 to 46.7 mm.
The analysis of observer differences at the eight individual sites is described and illustrated in online supplementary figure 10A–D.
Discussion
Interobserver reliability of SAT thickness measurements: results obtained with the new set of sites compared to previous results with ISAK sites
Precision is influenced by the viscoelastic movements of SAT depending on the actual body position during marking and during measuring. Standardising the marking and measuring procedure is therefore important to obtain precise results.
Owing to furrowed borders of SAT, precision depends on orientating and positioning the probe at the centre of the site; otherwise, the US image would map another region of SAT (with the high accuracy as discussed in part A) that may have a different thickness, and a different amount of embedded structures. Therefore, it is essential to use measurement sites where the SAT thickness does not change much in the region surrounding the centre of the site. It is of importance that the investigators are trained to find these sites reliably and to apply the method in the standardised way as described in parts A and B of this publication.
Comparison of the interobserver studies with ISAK sites and with the new US sites shows that the new sites resulted in much clearer images and higher precision. A detailed comparison of the interobserver reliability obtained with ISAK sites previously14 ,15 ,26 with the results obtained here can be found in online supplementary appendix, part C. Currently, the new sites are being applied within the framework of a multicentre interobserver variability study under the auspices of the IOC Medical Commission. Comparisons of SAT thickness sums with dual-energy X-ray absorptiometry applied to measure total body fat will also be included in this research.
In the study presented here, the EO site was considered because it is situated close to the ISAK site supraspinale. However, marking of EO requires palpating and identifying anatomical bony landmarks, whereas all seven other sites do not. In some cases, this caused problems when marking the site precisely, particularly for heavy athletes and in obese persons. A promising candidate for replacing EO is LT because at this site interesting information concerning fat patterning in different somatotypes and between men and women can be expected,27–29 and it is easy to mark LT precisely. The LT site also avoids marking problems that can occur at the EO site in participants with very thick SAT layers. The LT site should therefore replace the EO in future investigations.
Summary and conclusions
All eight new site locations are defined relative to the size of the individual, and a minimum of eight sites are measured to account for inter-individual differences in SAT patterning and for obtaining a sum of SAT thickness which ensures high accuracy and reliability. These new sites optimise the acquisition of clear US images. The orientation of the US probe is approximately parallel with the alignment of the underlying muscle fibres.
To obtain high quality data, observers must participate in a structured training programme that consists of site-marking experience, handling the US system, application of the image segmentation and SAT measurement programme, and guided exercises and interobserver comparisons.
In persons with thick SAT layers, lower frequencies are necessary and they are associated with lower tissue border resolution, but the relative error remains small. Combining the very accurate US method with MRI methods that can be applied to quantify volumes of visceral and abdominal SAT may be the key for developing more enhanced body composition reference methods.32–35 Furthermore, validation studies against multicomponent models12 ,30 are necessary to resolve the question whether SAT thickness measurements with the fibrous structures included or excluded will result in better estimates of total body fat.
The main advantages of this novel US technique over other body composition methods are:
The selected sites represent the relevant body segments: upper and lower abdomen, back, upper arm and forearm, and lateral, upper and lower leg
High measurement accuracy of about 0.2 mm (18 MHz linear probe) can be obtained when the tissue's speed of sound is set correctly
Adipose tissue compression is avoided by using a thick layer of US gel (in addition, the person is asked to stop breathing during image capture)
High precision results when measurers are trained to apply the standardised technique appropriately (95% of SAT thickness sums were within ±1 mm)
Visual control of the semiautomatic measurement algorithm eliminates errors of the automatic contour detection
The automatic measurement of many thickness values in one image, and the possibility to include or exclude embedded structures like fibrous tissues in the thickness values and to quantify their depth
Appropriate for use in the field when employing portable US systems
The technique has minimal subject involvement, does not require ionising radiation and can be applied to children, adolescents and adults
Accommodation of a wide range of adiposity from lean to obese participants
Applying this standardised technique will make results of different working groups directly comparable, and will facilitate the collation of a reference database
At this time, the US technique has the following limitations:
As with skinfolds, this US technique only samples the SAT and does not measure fat stored in the deeper regions
Equipment costs are greater than for skinfolds, but decreasing prices of US systems may accelerate the replacement of other field methods commonly used in sports medicine36 ,37
Since this is a new measurement approach, it will take some time until a comprehensive data pool can be collated. Such a data pool is needed to provide a basis for sports medicine decisions and performance optimisation strategies
The marking, image capture and evaluation of eight sites take about 20 min (which is comparable to skinfolds when eight sites are measured in triplicate).
This US method enables highly sensitive SAT comparisons between individuals and between groups. Various kinds of cross-sectional and longitudinal studies can now be conducted such that small adiposity changes can be detected with the sensitivity that this US technique provides.
What are the findings?
The standardised ultrasound (US) measurement technique enables subcutaneous adipose tissue (SAT) patterning studies with very high accuracy and precision. When sound speed is set correctly, thickness measurement accuracy is approximately 0.2 mm (18 MHz linear US probe).
In athletes, the sum of SAT thicknesses of eight sites varies between a few mm and more than 100 mm. In the interobserver study presented here, it was found that the deviations of three observers’ individual measurements from the mean were smaller than ±1 mm in 95% of cases (thickness sums ranged in this group from 10 to 50 mm).Therefore, differences of 2 mm (of the sum from eight sites) could reproducibly be distinguished.
The previously used ISAK sites (International Society for the Advancement of Kinanthropometry), which were defined for skinfold measurements, are not well suited for US imaging of SAT and are therefore replaced by this new set of sites which fulfil the criteria for reproducible and accurate US measurements.
UA (upper abdomen),
LA (lower abdomen),
ES (erector spinae),
DT (distal triceps),
BR (brachioradialis),
LT (lateral thigh),
FT (front thigh),
MC (medial calf).
All new sites overlie muscle with a clearly visible fascia, away from other complex structures, thus easing the acquisition of US images. SAT layers show little variation in thickness in the vicinity of these selected sites; this is an important criterion because the major part of measurement deviations is due to unavoidable position changes of the US probe when measurements are repeated.
Fibrous structures embedded in SAT can also be quantified.
How might it impact on clinical practice in the future?
This new US method is capable of measuring SAT layers without compression and with high accuracy and precision. Therefore, it enables longitudinal studies of fat patterning changes and athlete comparisons with a sensitivity not reached by any other technique.
This US measurement approach will complement other laboratory methods, and it is also applicable for use in the field.
There is potential for US to replace other field methods because of its high accuracy and precision; however, it will take some time until comprehensive reference data of various groups of athletes will be available.
This US technique provides the highest technically obtainable accuracy for SAT thickness measurement, which is limited only by biological factors. The new site definitions improve the application of US and result in good reliability.
The semiautomatic image evaluation also allows the quantitative determination of the amount of fibrous structures embedded in SAT, which varies largely from one site to another and between individuals.
Owing to the high accuracy of image evaluation, this US method can also be applied to optimise the image segmentation algorithms of other imaging techniques like MRI or CT.
This emerging measurement technique has the potential to spread rapidly because prices of high-quality US imaging systems have decreased markedly in recent years.
The eight selected sites can be used as a standard set of sites for pooling data on SAT patterning in athletes (and in untrained persons) which will be valuable for comparisons of SAT layers among individuals and between groups.
Specific training of US imaging and evaluation of SAT is necessary to obtain high reproducibility and accuracy of measurements. Two days of training are sufficient for measurers who have had some prior US imaging experience.
Acknowledgments
The authors would like to thank the IOC Medical Commission for supporting the collaboration of the authors.
References
Supplementary materials
Supplementary Data
This web only file has been produced by the BMJ Publishing Group from an electronic file supplied by the author(s) and has not been edited for content.
- Data supplement 1 - Online supplement
Footnotes
Contributors All authors contributed to the selection and testing of appropriate sites for US measurement of SAT patterning and supported the finalisation of the manuscript. This ultrasound approach to determine SAT patterning and the semiautomatic US image segmentation and thickness evaluation technique was developed in Graz by WM, HA, PK and AF-R. The research was conducted by WM who also prepared the manuscript.
Funding The cooperation of the Adhoc Working Group on Body Composition, Health and Performance was supported by the Medical Commission of the IOC.
Competing interests The evaluation software developed for this US technique for multiple tissue thickness measurements is commercially available, and WM, HA, AF-R and PK will participate in the returns.
Patient consent Obtained.
Ethics approval Ethical Commission of the Medical University of Graz.
Provenance and peer review Not commissioned; externally peer reviewed.