Article Text

Abstract
Objective To develop sex-specific and age-specific international norms for the 20 m shuttle run test (20mSRT) in children and youth (aged 9–17 years), and to estimate the prevalence meeting the FITNESSGRAM criterion-referenced standards for healthy cardiorespiratory endurance (CRE).
Methods A systematic review was undertaken to identify papers explicitly reporting descriptive 20mSRT (with 1 min stages) data on children and youth since 1981. Data were included on apparently healthy (free from known disease/injury) 9–17 years old. Following standardisation to a common metric and for protocol differences, pseudo data were generated using Monte Carlo simulation, with population-weighted sex-specific and age-specific normative centiles generated using the Lambda Mu and Sigma (LMS) method. Sex-related and age-related differences were expressed as per cent and standardised differences in means. The prevalence with healthy CRE was estimated using the sex-specific and age-specific FITNESSGRAM criterion-referenced standards for  .
.
Results Norms were displayed as tabulated centiles and as smoothed centile curves for the 20mSRT using 4 common metrics (speed at the last completed stage, completed stages/minutes, laps and relative  ). The final data set included 1 142 026 children and youth from 50 countries, extracted from 177 studies. Boys consistently outperformed girls at each age group (mean difference±95% CI: 0.86±0.28 km/h or 0.79±0.20 standardised units), with the magnitude of age-related increase larger for boys than for girls. A higher proportion of boys (mean±95% CI: 67±14%) had healthy CRE than girls (mean±95% CI: 54±17%), with the prevalence of healthy CRE decreasing systematically with age.
Conclusions This study provides the most comprehensive and up-to-date set of international sex-specific and age-specific 20mSRT norms for children and youth, which have utility for health and fitness screening, profiling, monitoring and surveillance.
- Endurance
- Children
- Adolescent
Statistics from Altmetric.com
Background
Cardiorespiratory endurance (CRE) is the ability to deliver oxygen to the muscles and to utilise it to generate energy to support muscle activity during exercise.1 ,2 In adults, low CRE is strongly associated with cardiovascular disease and all-cause mortality and morbidity (independent of adiposity),3 ,4 stroke,5 diabetes,6 mental health,7 health-related quality of life8 and cardiometabolic disease risk.6 ,9 In children and youth, CRE is a weak-to-strong predictor of cardiovascular disease risk, cancer and mental health.10 ,11 There is also evidence of an interaction between adiposity and CRE, suggesting that high levels of CRE may attenuate the deleterious effects of being overweight or obese in children and youth, the so-called ‘fat but fit’ phenotype.12 Thus, CRE provides insight into the synergistic capabilities of several bodily systems and organs that are involved in the performance of physical activity and exercise, providing a strong and summative measure of health in children and youth.10 CRE also tracks moderately well from childhood to adulthood,13 ,14 indicating that the measurement and surveillance of CRE in children provides insight into current and future population health statuses. Low fitness in childhood and adolescence is substantially linked with increased cardiometabolic disease risk,15 ,16 obesity,17 reduced quality of life,18 poorer skeletal19 and mental health11 in adulthood. In addition to health implications, CRE is an important determinant of sporting success for many popular youth sports (eg, hockey, basketball, football (soccer), distance running, swimming, rugby).1
The 20 m shuttle run test (20mSRT) is arguably the most popular field-based assessment and estimate of CRE in children and youth worldwide.20–23 It is an excellent tool for population-based surveillance and monitoring because it demonstrates strong-to-very strong test–retest reliability, and moderate-to-strong validity.20 The 20mSRT also has excellent field-based utility due to its low cost, flexibility with testing locations (indoors, outdoors, smaller spaces) and its ability to test multiple individuals simultaneously with minimal equipment and personnel.20 ,24 ,25 In order to extend the utility of the 20mSRT as a surveillance instrument, there is a need for international norms, which, to date, have only been published for a single 20mSRT metric or for selected geographical regions,20 including Europe,26 North America27 and Oceania.28 Olds et al21 cumulated 20mSRT data on children and youth from 37 countries, representing six continents, suggesting that there is an international appetite for assessing CRE in children and youth. Harmonising reference values by creating international normative centiles for the 20mSRT in children and youth would provide opportunity for international surveillance and a means to compare CRE across geographic areas and time.
This study provides a 10-year update of the comprehensive 20mSRT reviews by Tomkinson et al22 and Olds et al,21 which were the first studies to describe a method to harmonise 20mSRT data by standardising for differences in test protocols and performance metrics. The primary aim was to develop the most comprehensive set of sex-specific and age-specific international normative centiles for CRE. The secondary aim was to estimate the proportion of children and youth meeting the FITNESSGRAM criterion-referenced standards for healthy CRE. These data will facilitate the identification of children and youth with very low CRE in order to set appropriate goals and promote positive health-related fitness behaviours, and conversely those with very high CRE, which may be important for sporting or athletic success.
Methods
Data sources
A systematic review of the scientific literature was registered (PROSPERO 2013:CRD42013003622) and completed to locate studies that reported descriptive 20mSRT data on 9–17 years old (see online supplement 1). Studies were identified up until October 2015 using the following bibliographic databases: MEDLINE (1946–2015), PsycINFO (1806–2014), EMBASE (1947–2014), SPORTDiscus (1949–2014) and Cochrane Central Register of Controlled Trials (2005–2014). The search strategy included the following terms: shuttle run*, OR beep test, OR multi-stage, OR aerobic, OR cardio*, OR endurance; with child*, adolescen*, pubescen*, boy, girl, young and youth as search term modifiers. All studies were extracted as text files, imported into Reference Manager (Thompson Reuters, San Francisco, California, USA), and assigned a unique reference identification number. Duplicate studies were first removed using Reference Manager with the remaining duplicates removed manually. Two independent reviewers screened all titles and abstracts for eligibility, with full-text copies obtained for all studies meeting initial screening criteria according to at least one reviewer. These two independent reviewers then examined all full-text articles and discrepancies were resolved by discussion and consensus. A third reviewer examined an article when the two reviewers were unable to reach consensus, with consensus reached for all included articles. Email contact with the corresponding authors of studies occurred when necessary, in order to provide clarification, to avoid ‘double counting’ previously reported data, and/or to request additional descriptive or raw data. The reference lists of all included studies were manually reviewed to identify new studies. Reviewers contacted content experts to obtain grey literature. In addition, the extensive personal libraries of the study authors were examined for relevant studies.
Supplemental material
Inclusion/exclusion criteria
Studies were included if they explicitly reported descriptive 20mSRT data (using the 1 min stage protocol; see Tomkinson et al22 for protocol variants) at the sex by age by country level. Study participants must have been apparently healthy (free from known disease or injury) 9–17 years old who were tested from 1981 onwards—the inception year of Léger's 20mSRT with 1 min stages. Studies were excluded if they reported descriptive data on: (1) other versions of the shuttle run (eg, the 15 m test or estimates of 20mSRT performance based on the 15 m test); (2) duplicate data published in another included study; or (3) on only special interest groups of children who were atypical of their source population (eg, elite athletes, physically or mentally retarded children). Figure 1 shows a flow chart of the included studies.

PRISMA flow chart outlining the identification of the included studies.
Data treatment and statistical analysis
All descriptive data were extracted into Excel (Microsoft Office 2010, USA) using a standardised data extraction table. The following descriptive data were extracted by one author and checked by another for accuracy: authors, country of testing, year of testing, sex, age, 20 m shuttle run protocol, 20 m shuttle run metric, sample size, mean, SD, median, sampling method and the sampling base. All data were examined for anomalies by running range checks and examining sex-specific and age-specific scattergrams. While only data on children and youth aged 9–17 years inclusive were retained for further analysis, individual study by sex by age by country by year groups were excluded when the sample size fell below 40 as the means and SDs for smaller samples were too labile. The final data set included 1896 study by sex by age by country by year groups.
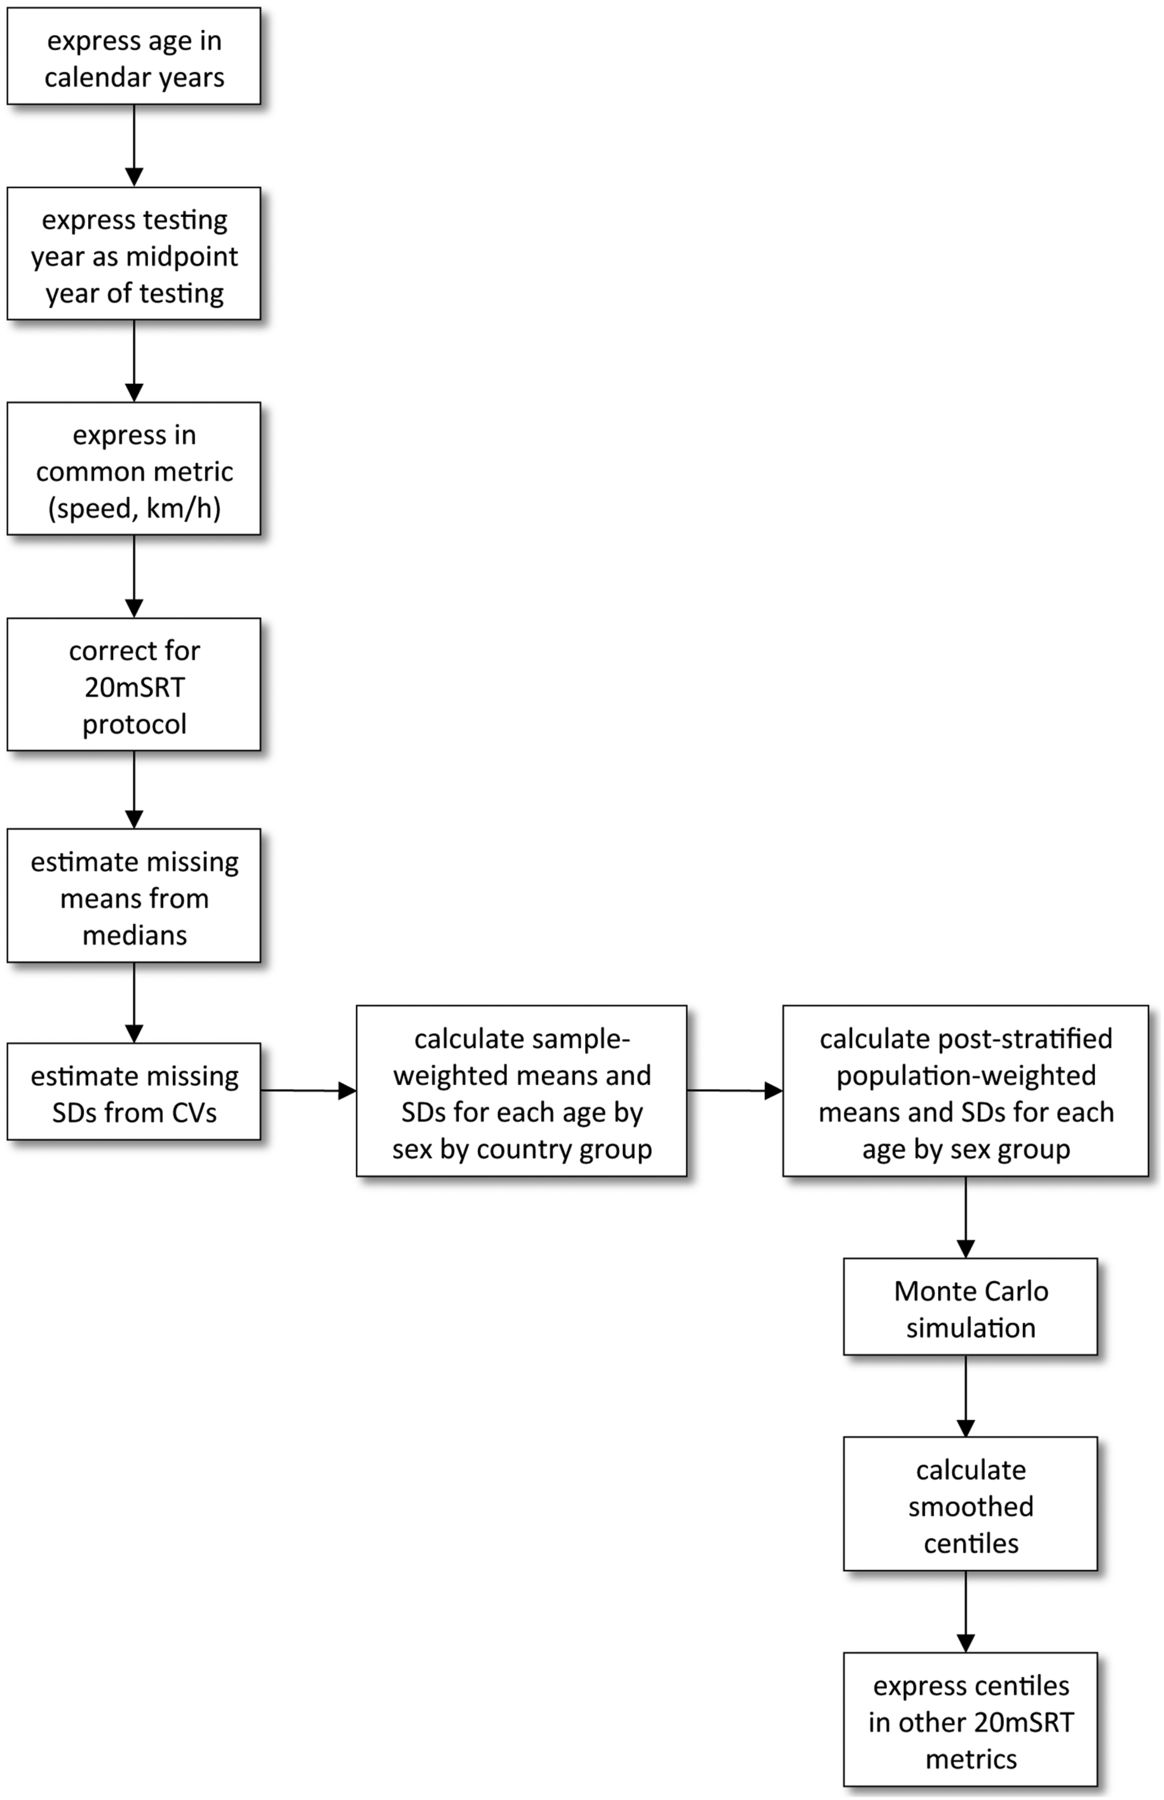
The general procedure used to generate the sex-specific and age-specific normative centiles from extracted data is shown in figure 2. In most studies (76% or 135/177 studies), age was reported as age at last birthday; however, age was also reported in 7% (13/177) of studies as a span of years (maximum range: 3 years) and in 17% (29/177) as mean and SD years. In studies reporting age as a span of years, a new sample size was assigned to each study by sex by age by country group by dividing the reported sample size by the number of age groups (eg, a sample size of 162 was assigned to boys aged 10, 11 and 12 years in the study by Vandongen et al29 which reported testing 486 boys aged 10–12 years). In studies that reported age as mean±SD years, Monte Carlo simulation was used to produce pseudo age data (using a random normal generator) based on reported means and SDs to estimate the sample size in each study by sex by age by country group.

Flow chart showing the methodological procedure used in this study. Results from studies were first expressed in the common metric of running speed (km/h) at the final completed stage and then corrected to Léger's original 1 min protocol according to which protocol they used (Léger, Eurofit or Queen's University of Belfast). Following the estimation of missing means (from reported medians) and SDs (from calculated CVs), poststratified population-weighted means and SDs were estimated for each sex by age group, with pseudo data then generated using Monte Carlo simulation. Smoothed centiles were then generated using the LMS method, with international normative 20mSRT values expressed in several different metrics (speed at the last completed stage, the number of completed full stages/minutes and relative  (ml/kg/min)). 20mSRT, 20 m shuttle run test; CV, coefficient of variation; LMS, Lambda Mu and Sigma; and VO2max peak oxygen uptake.
Testing year was recorded as the midpoint year of testing (eg, 2009.5 was recorded as the measurement year for a study that reported testing children in 2009) in 55% (98/177) of studies, with 34% (60/177) reporting a span of testing years and 11% (19/177) not reporting it at all. The midpoint year was recorded for studies reporting a span of testing years (eg, 2010.0 was recorded for a study reporting testing over the period 2009–2010), with 2 years prior to the publication year assumed for studies when it was not reported, which was the median difference for those studies in which the testing year was known.
To combine data from different studies, all 20mSRT data were standardised to a common metric and for protocol differences. To do this, we used an updated version of the standardisation procedure described in detail by Tomkinson et al.22 Figure 3 shows this updated standardisation procedure and summarises the steps used to express 20mSRT performances in the common metric of speed (km/h) at the last completed stage. All 20mSRT data were then standardised for protocol differences to Léger's original 1 min protocol,30 which starts at a speed of 8.5 km/h and increases in speed by 0.5 km/h each minute.22

Performance metric conversion flow chart adapted from Tomkinson et al.22  , peak oxygen uptake.
As part of the modelling procedure used to generate sex-specific and age-specific normative centiles, means and SDs were required at the study by sex by age by country by year level. If no mean was available (1% or 2/177 studies), then mean values were estimated from the reported median values. This was done by first locating all studies reporting both median and mean values at the study by sex by age by country level, and second, by determining the best-fitting and most parsimonious linear and curvilinear (second and third order polynomials) regression models between median (predictor variable) and mean (response variable) speed values. Median and mean speed values were available for 418 study by sex by age by country groups, with the relationship nearly perfectly described by the following linear regression model: mean=0.9408×median+0.6566 (where r (95% CI)=0.988 (0.985 to 0.990) and SE=0.128). Furthermore, 5% (9/177) of studies did not report SD values. Missing SD values were estimated by first locating all studies reporting both means and SDs at the study by sex by age by country by year level; second, by calculating the corresponding coefficient of variation (CV) values; and third, by calculating the sample-weighted mean CVs for boys and girls separately. Mean and SD speed values were available for 1585 study by sex by age by country groups, with sample-weighted mean CVs (±95% CI) of 10.8±0.1% and 9.2±0.1% for boys and girls, respectively.
Sample-weighted means and SDs (the latter calculated from sample-weighted mean CVs) were then calculated at the sex by age by country level. While these data represent the best available 20mSRT data, in order to best generate internationally representative sex-specific and age-specific normative centiles and to correct for systematic bias associated with oversampling and undersampling, means and SDs were corrected using the poststratification population-weighting procedure described by Levy and Lemeshow.31 This procedure ensures that our population estimates reflect the underlying international age-specific and sex-specific country demographics. Thus, population estimates standardised to the mean measurement year of 2000 were extracted from the United Nations World Population Prospects report.32 Monte Carlo simulation was then used to create pseudo data using a random normal generator based on population-weighted means and SDs at the sex by age level. Monte Carlo simulation assumes that the distributions are approximately normal, which is true of the available raw 20mSRT speed data. Pseudo data sets were repeatedly generated until the calculated mean differed from the reported mean by <0.5%, and the calculated SD differed from the reported SD by <2.5%. These pseudo data sets were then used to generate sex-specific and age-specific normative centiles in LMSchartmaker Pro (V.2.43, The Institute of Child Health, London), which analyses data using the Lambda Mu and Sigma (LMS).33 The LMS method fits smooth centile curves to reference data by summarising the changing distribution of three sex-specific and age-specific curves representing the skewness (L; expressed as a Box-Cox power), the median (M) and the CV (S). Using penalised likelihood, the curves can be fitted as cubic splines using non-linear regression, and the extent of smoothing required can be expressed in terms of smoothing parameters or equivalent degrees of freedom.34 The effective degrees of freedom for 20mSRT speed were 1 (L curve), 4 (M curve) and 3 (S curve) for boys and 1 (L curve), 3 (M curve) and 3 (S curve) for girls. Normative centiles were also expressed in other common 20mSRT metrics, including the number of completed stages/minutes, the number of completed laps and relative peak oxygen uptake ( , mL/kg/min) values using the Léger et al35 prediction equation:
 where speed is the running speed of the last completed stage (km/h) and age is age at last birthday. In a sample of Québec children and youth, this equation had a SE of estimate of 5.9 mL/kg/min or 12.1%.35
The prevalence of children and youth (10–17 years old) with ‘healthy’ CRE was estimated using the new sex-specific and age-specific FITNESSGRAM criterion-referenced standards for  .36 ,37 Differences in mean 20mSRT performance (km/h) between (1) age-matched boys and girls (eg, boys aged 10 years vs girls aged 10 years), and (2) sex-matched children of different ages (eg, boys aged 10 vs 11 years), were expressed as absolute and standardised differences. Positive differences indicated that 20mSRT performances for boys or older children were higher than those for girls or younger children. Standardised differences of 0.2, 0.5 and 0.8 were used as thresholds for small, moderate and large, respectively.38
Results
The final data set included 1 142 026 children and youth aged 9–17 years (1896 study by sex by age by country by year groups extracted from 177 studies) from 50 countries tested over the period 1981–2014 (figure 4, see online supplement 2w39–w190). These 50 countries represented six major geographical regions (Africa, Asia, Europe, Latin America and the Caribbean, Northern America and Oceania),32 including 33 high-income, 9 upper middle-income, 5 lower middle-income and 3 low-income economies.191 Norms are presented as tabulated centiles from 5% to 95% for four common 20mSRT metrics in tables 1⇓⇓–4, with the smoothed centile curves for 20mSRT speed presented in figure 5 and the sex-specific and age-specific LMS values shown in online supplement 3.
Supplemental material
Supplemental material
Twenty-metre shuttle run (speed (km/h) at the last complete stage) centiles by age and sex in 1 142 026 children and youth aged 9–17 years from 50 countries since 1981
Twenty-metre shuttle run (number of completed stages/minutes) centiles by age and sex in 1 142 026 children and youth aged 9–17 years from 50 countries since 1981
Twenty-metre shuttle run (number of laps) centiles by age and sex in 1 142 026 children and youth aged 9–17 years from 50 countries since 1981
Relative peak oxygen uptake ( , mL/kg/min) centiles by age and sex in 1 142 026 children and youth aged 9–17 years from 50 countries since 1981

World map representing the 50 countries (shown in black) for which 20mSRT data on 9–17 years old were available. 20mSRT, 20 m shuttle run test.

Smoothed centile curves (P10, P50 and P90) for the 20mSRT (speed (km/h) at the last completed stage) performance of (A) boys and (B) girls. 20mSRT, 20 m shuttle run test.
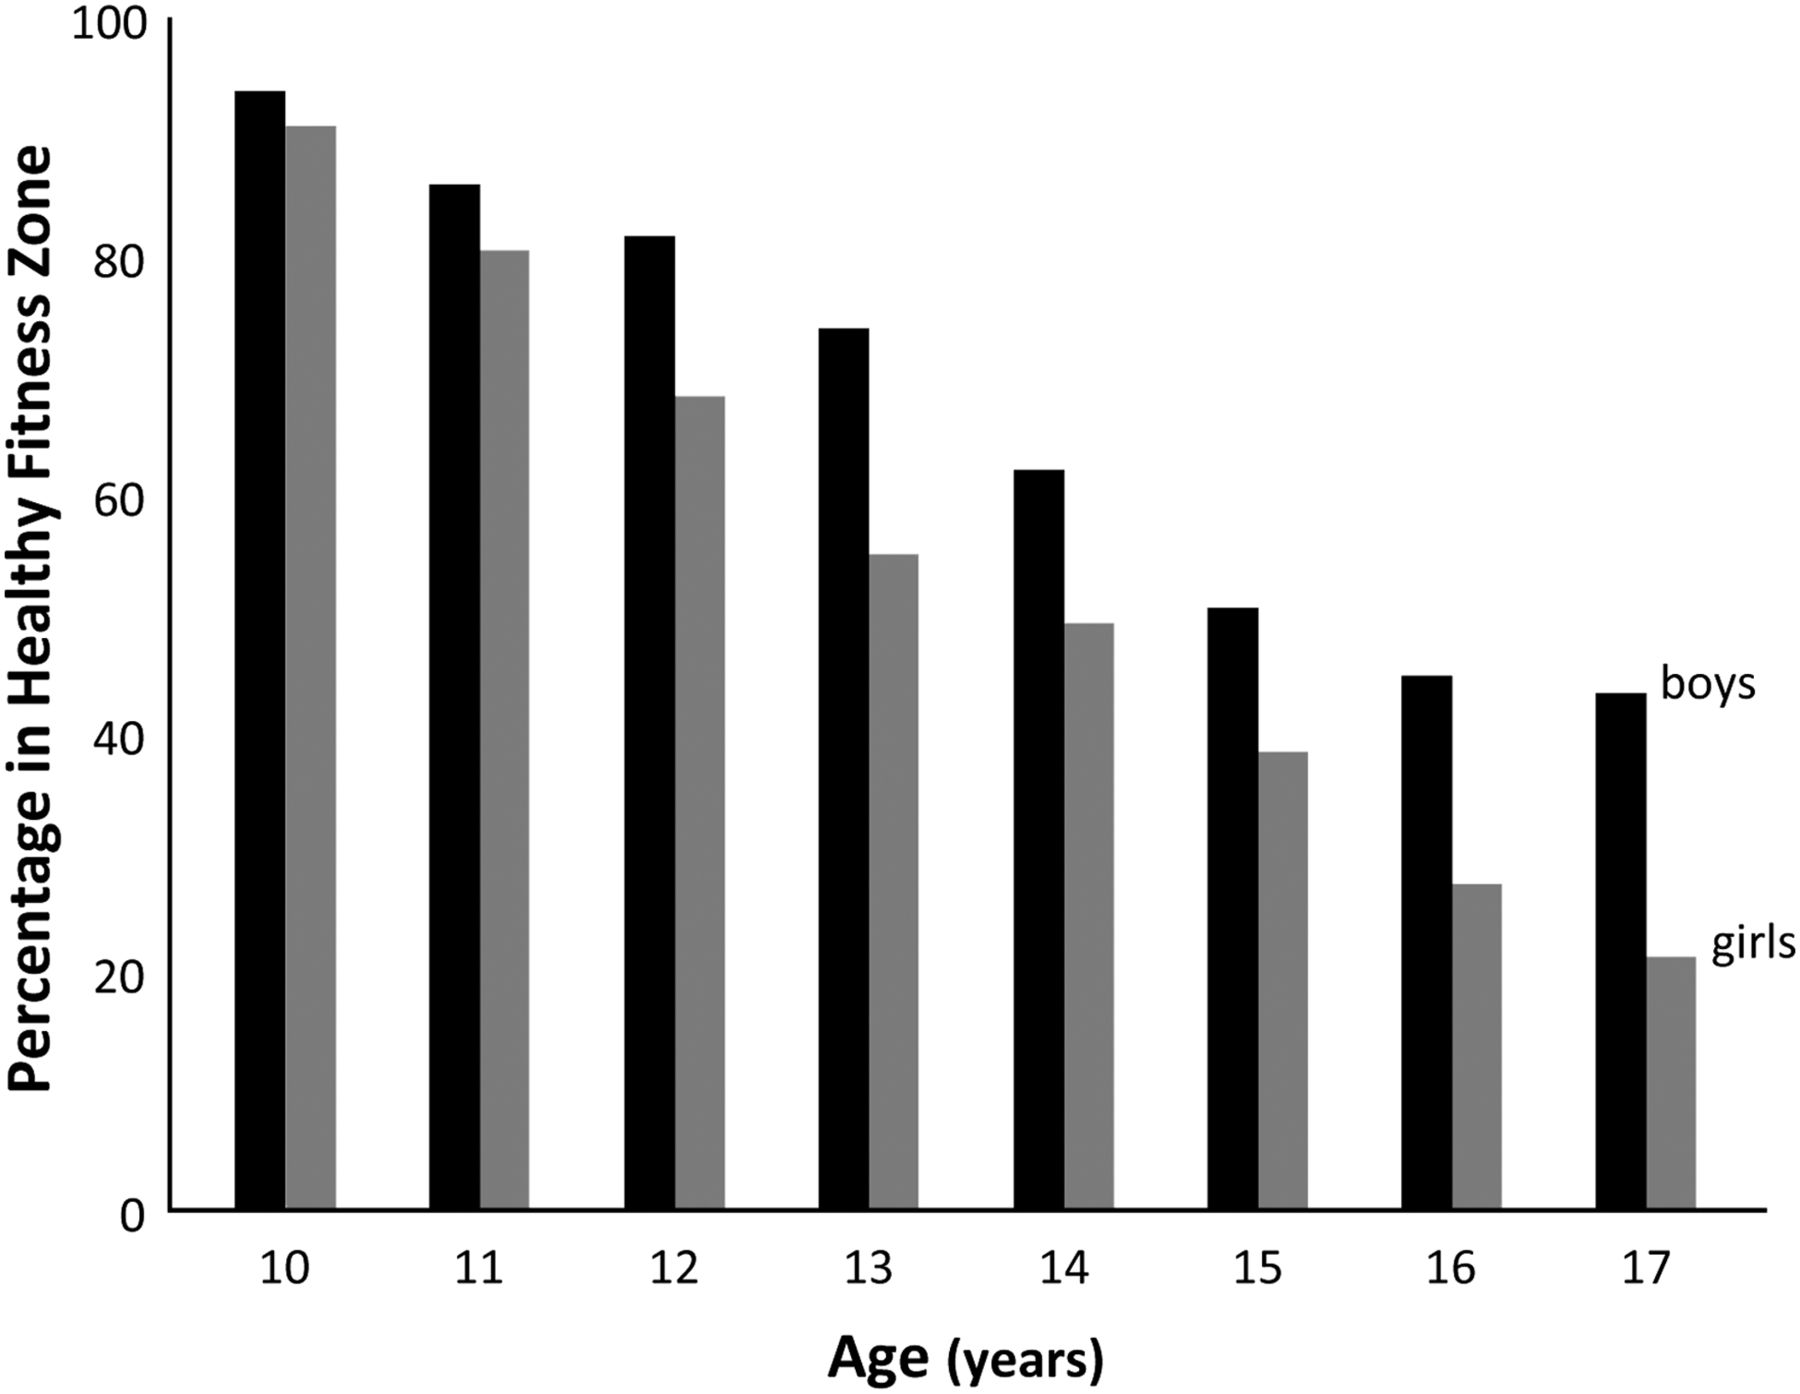
On average, approximately two-thirds of boys (mean±95% CI: 67±14%) and half of the girls (mean±95% CI: 54±17%) had healthy CRE, with the prevalence of healthy CRE decreasing by about 8% (boys) and 10% (girls) with every increasing year from age 10 to 17 years (figure 6).

Prevalence of 10–17 years old from 50 countries meeting the FITNESSGRAM Healthy Fitness Zone (V.10) thresholds for  (mL/kg/min).
  , peak oxygen uptake.
Boys consistently outperformed girls at each age group (mean difference±95% CI: 0.86±0.28 km/h or 0.79±0.20 standardised units), with the sex-related differences increasing with age from a small difference at age 9 years (difference in means±95% CI: 0.32±0.01 km/h or 0.40±0.01 standardised units) to a large difference at age 17 years (difference in means±95% CI: 1.46±0.02 km/h or 1.20±0.02 standardised units; figure 7A). From age 9 to 17 years, boys' performance improved at the rate of 0.17 km/h (or 0.15 standardised units) per year, with the largest rate of increase occurring at age 12 years (0.27 km/h or 0.23 standardised units). Girls' performance steadily improved at the rate of 0.03 km/h (or 0.03 standardised units) per year (figure 7B). These age-related changes were cumulatively large for boys and small for girls.
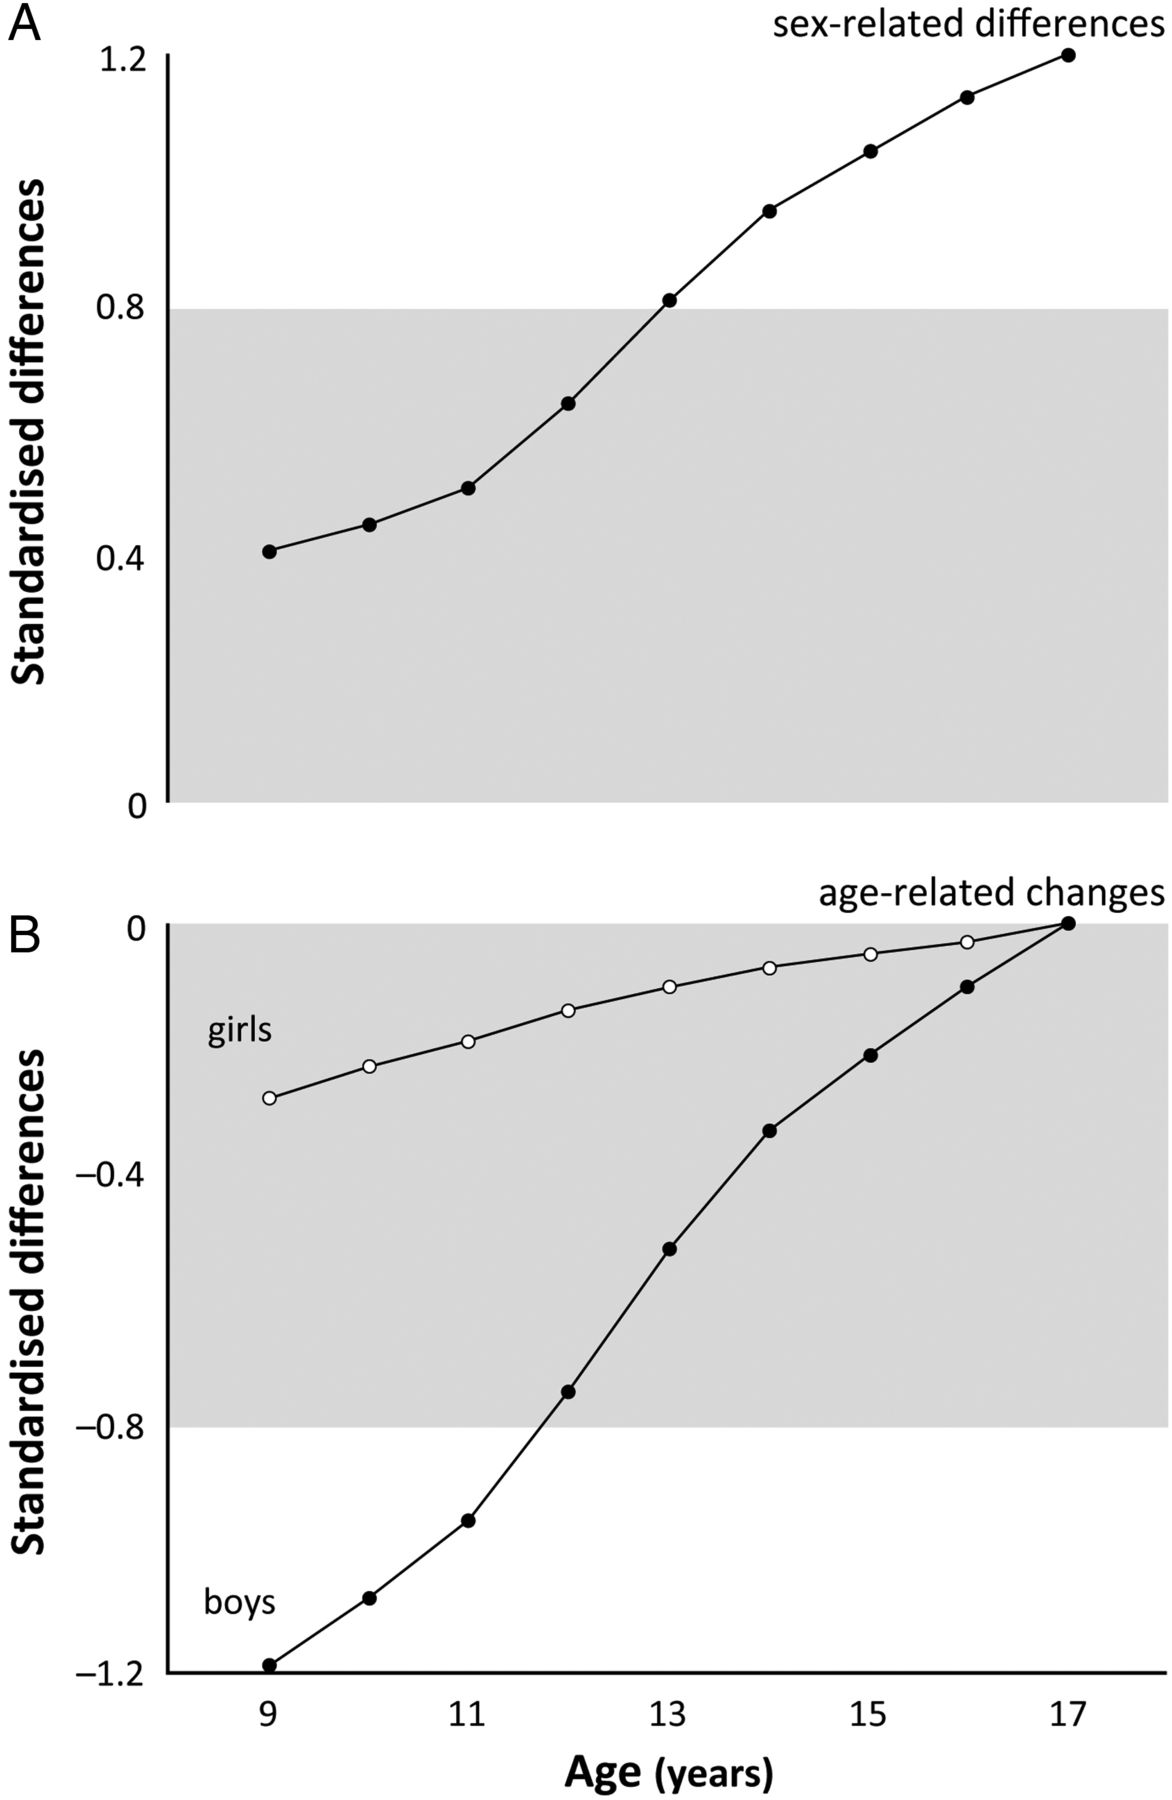
Standardised differences in mean 20mSRT performance (speed (km/h) at the last completed stage) between (A) age-matched boys and girls and (B) sex-matched children of different ages (anchored to age 17 years=0). Positive differences indicate that 20mSRT performances were higher for boys than for girls (top panel) or for older children than for younger children (bottom panel). The limits of the grey zone represent the thresholds for a large standardised difference (0.8 or −0.8). 20mSRT, 20 m shuttle run test.
Discussion
This study systematically analysed 20mSRT data on 1 142 026 children and youth aged 9–17 years to generate the most comprehensive and up-to-date set of international sex-specific and age-specific norms for CRE. These international norms have utility for health and fitness screening, athlete profiling, and monitoring and surveillance in health, clinical, educational or sporting settings. They complement a growing body of literature reporting national, regional and international growth centiles across a range of cardiometabolic disease risk factors, including adiposity (eg, body mass index192 ,193 and waist circumference194–198), blood pressure,199 ,200 cholesterol,200 triglycerides,200 glucose200 and health-related fitness.28 ,50 ,126 ,201–203
Using a quintile framework, children in the bottom 20% can be classified as having ‘very low’ CRE; between the 20th and 40th centiles as having ‘low’ CRE; between the 40th and 60th centiles as having ‘moderate’ CRE; between the 60th and 80th centiles as having ‘high’ CRE; and above the 80th centile as having ‘very high’ CRE. Single measures of 20mSRT performance taken in health, clinical, educational or sporting settings can then be qualitatively interpreted using these quintile-based thresholds, with longitudinal changes (eg, due to growth or exercise training interventions) monitored by tracking changes against centile bands. For example, Armstrong et al1 estimated that in children an appropriate 12-week CRE training programme will induce, on average, an 8–9% increase in  independent of sex, age and maturation, equivalent to an increase of ∼0.5 standardised units or ∼20 centile points, which should be enough for a child to shift upwards from one quintile band to the next or above the relevant criterion-referenced standard for low cardiometabolic risk.204
While these norms are not criterion-referenced in that they do not indicate whether children have healthy CRE or low cardiometabolic risk, this study does provide an estimate of the prevalence with healthy CRE according to the new FITNESSGRAM (V.10) standards, which have been shown to discriminate with moderate accuracy between youth with and without metabolic syndrome.37 There are currently no agreed on international criterion-referenced standards for CRE, and while we estimated prevalence using the US-based FITNESSGRAM standards, other national and regional standards have been published elsewhere.26 ,205–211 It is important to note that the differences between published standards are (in some cases) substantial, with the new FITNESSGRAM (V.10) standards generally higher for girls and lower for boys relative to other standards,26 ,205–211 meaning that our prevalence estimates would be substantially different if calculated using other standards. In contrast,  can be estimated using different test protocols and prediction equations, and special care must be taken when comparing
  values with standards that were estimated using different test protocols and prediction equations.212 For example, we predicted
  from 20mSRT performance using the Léger et al35 equation, whereas the new FITNESSGRAM standards were developed using predicted
  from a laboratory-based treadmill test.37 To our knowledge, at least 17 prediction equations (from 10 studies of apparently healthy children and youth37 ,213–221) are currently available to estimate
  from 20mSRT performance, equations that differ in validity and can result in substantially different estimates of
  and hence the prevalence of healthy CRE. Future studies need to build on multinational efforts (eg, the HELENA study in Europe) in order to develop the most valid international normative-referenced and criterion-referenced standards for CRE.222
Using a cross-sectional approach, this study quantified the sex-related and age-related differences in 20mSRT speed, showing that boys consistently outperformed girls and experienced larger age-related changes. Given that longitudinal data are required to determine the true developmental patterns of CRE (because they control for within-participant changes in timing and tempo), and that larger age-related increases have been observed in children followed longitudinally than in those examined cross-sectionally,223 it is possible that our data underestimate the true developmental patterns. While the developmental patterns of children's  has been well studied in non-representative longitudinal samples,224–226 other aspects of CRE (eg, mechanical efficiency, fractional utilisation,
  kinetics, etc) are less well understood, making it difficult to describe the mechanistic causes underlying the developmental patterns in 20mSRT performance. Given that relative
  and
and  vary linearly with speed and peak speed, changes in 20mSRT speed should therefore reflect changes in underlying
  (ie, the oxygen cost of the activity). Interestingly, however, this study observed decreases in boys' relative
  throughout childhood and adolescence, rather than the expected plateau.227 This unexpected developmental pattern may be due in part to
  prediction error or the fact that the developmental patterns were calculated using pooled cross-sectional data. In contrast, the premise of a plateau in boys' relative
  throughout childhood and adolescence is largely based on progressive treadmill or cycle testing of volunteer recruits who were athletically inclined, non-obese and motivated to exercise.226 ,228 This unexpected finding in the developmental pattern in boys'
  might reflect current maturational development, or our use of a large, internationally representative sample of children and youth.
Strengths and limitations
This study brings together 20mSRT data from 177 studies in what is to date the largest international CRE database in the world. We conducted a systematic review, using a strict set of inclusion and exclusion criteria, applied rigorous data treatment procedures to systematically control for bias (eg, differences in test protocols and performance metrics), a poststratification population weighting procedure, a novel pseudo data method and the LMS method, to generate international sex-specific and age-specific smoothed centiles (across four performance metrics) for CRE. While it is not the first comprehensive study of children's 20mSRT performance, it updates the comprehensive reviews of Olds et al21 and Tomkinson et al22 by: (1) extending the data coverage from 2003 to 2014 through a rigorous systematic review process, (2) producing sex-specific and age-specific international normative centiles and (3) estimating the international prevalence of children and youth with healthy CRE.
Unfortunately, there are several sampling-related and methodology-related limitations to this study. First, it pooled data from studies that used different sampling methods which raises the issue of representativeness, with some studies using probability sampling (eg, stratified proportional, stratified random or cluster sampling) and others non-probability sampling (eg, convenience sampling; see online supplement 2). Second, differences in sampling base also exist across national, state/provincial and local/city/school levels. Third, differences in testing conditions (eg, environmental conditions such as climate or altitude, practice and running surfaces) and measurement errors (eg, calibration and type of equipment, methodological drift and diurnal variation) are inherent to any large data synthesis, but the very large number of data points captured should minimise these issues. Fourth, the vigorous nature of the 20mSRT may result in difficulties in test administration in, or exclusion of individuals with physical disabilities and diseases. The absence of data from these populations is likely to have inflated our normative values within the lower centile range.
The 20mSRT data were also collected at different times over the period 1981–2014, and given convincing evidence of international declines in children's CRE in recent decades,1 ,23 ,229 our norms may be biased. With a mean measurement year of 2000, and assuming an international decline of ∼5% per decade since 1975,1 ,23 our normative data may overestimate values in 2014 by ∼7.5% (equivalent to ∼0.65 standardised units or ∼24 centile points) and represent a better health-related picture than what would be true today. However, without time trend data for all included countries and evidence of recent improvements in children's CRE in some included countries (eg, Australia,28 Japan229 and Spain230), time-based corrections of our normative data are not recommended. Despite relying predominantly on data from high-income economies, there is no good evidence that 20mSRT performance is meaningfully related to a country's affluence or distribution of wealth,21 ,231 so our norms are unlikely to be biased. Future studies need to examine CRE in low-income and middle-income economies and at multiple stages of the CRE transition. It must also be remembered that the 20mSRT is affected by factors other than underlying construct CRE.20 ,232 Validity data show that a moderate-to-large (35–70%) amount of the variance in 20mSRT performance is explained by the variance in underlying  ,20 ,232 ,233 indicating that other physiological (eg, mechanical efficiency),234 fractional utilisation,235
  kinetics,236 lactate threshold,237 anaerobic capacity,238 physical (eg, fat mass)239 and psychosocial factors (eg, motivation, effort and self-efficacy20) also contribute.
Recommendations
Over the past few decades, the 20mSRT has been widely used to assess the CRE of children and youth, and yet data pooling is nearly impossible due to the difficulty with standardising performances (eg, because of differences in protocols, performance metrics, the way in which age is expressed, etc). To facilitate data pooling in the future, and to assist with the eventual update of 20mSRT norms, we make the following recommendations:
The test protocol used should be thoroughly and accurately reported;
Care should be taken to minimise and report factors that affect 20mSRT performance (eg, testing conditions and measurement errors);
Best practice should include 20mSRT results that are reported as the running speed (km/h) at the last completed stage;
Descriptive statistics (sample sizes, means and SDs) should be reported at the sex by age (at last birthday) level; and
The year(s) of testing should be reported;
Furthermore, because the 20mSRT is a maximal effort test, in order to ensure that a child has performed with ‘good effort’ (ie, they have tried very hard), perceptual (eg, ratings of perceived exertion) and/or physiological (eg, heart rate) effort should be measured in addition to performance effort.240 Any adverse events (or lack thereof) associated with maximal effort tests such as the 20mSRT should also be reported.241
Conclusion
CRE is considered to be an excellent marker of current and future health. The 20mSRT is arguably the most popular measure of CRE because it is suitable for mass testing, is simple, cheap, easy, reliable, reasonably valid and is part of widely used health-related fitness test batteries (eg, Assessing Levels of PHysical Activity and fitness (ALPHA),242 Canadian Assessment of Physical Literacy (CAPL),243 Eurofit,244 FITNESSGRAM245 and even the PREFIT battery (Assessing FITness in PREscholers)).246 ,247 Using a systematic review and analytical approach, this study used the best available 20mSRT data to: (1) provide the most comprehensive and up-to-date set of international sex-specific and age-specific norms for children and youth; and (2) estimate the prevalence with healthy CRE according to the FITNESSGRAM standards. These data have utility for health and sport promotion given that they help to identify children and youth with: (1) very low CRE in order to set appropriate fitness goals, monitor longitudinal changes and promote positive health-related fitness behaviours; and (2) very high CRE in the hope of recruiting them into elite sporting or athletic development programmes.
What are the findings?
This study provides the most comprehensive and up-to-date set of sex-specific and age-specific international norms for the 20 m shuttle run test in children and youth.
This study estimates the international prevalence of children and youth with healthy cardiorespiratory endurance according to the FITNESSGRAM standards.
These international norms have utility for health and fitness screening, profiling, monitoring and surveillance.
How might it impact on clinical practice in the future?
International sex-specific and age-specific 20mSRT norms for children and youth are important for health and fitness screening, profiling, monitoring and surveillance.
Acknowledgments
The authors would like to thank the authors of the included studies for generously clarifying details of their studies and/or for providing raw data.
References
- ↵
- ↵
- ↵
- ↵
- ↵
- ↵
- ↵
- ↵
- ↵
- ↵
- ↵
- ↵
- ↵
- ↵
- ↵
- ↵
- ↵
- ↵
- ↵
- ↵
- ↵
- ↵
- ↵
- ↵
- ↵
- Melo X,
- Santa-Clara H,
- Almeida JP, et al
 using the 20-m multistage-shuttle run-test in 8-10-year-old children. Eur J Appl Physiol 2011;111:839–49. doi:10.1007/s00421-010-1708-z
 - ↵
- ↵
- ↵
- ↵
- ↵
- ↵
- ↵
- ↵
- ↵
- ↵
- ↵
- ↵
- ↵
- ↵
- ↵
- Pienaar C,
- Coetzee B,
- Monyeki AM
in a cohort of adolescents: the PAHL study. Ann Hum Biol 2015;42:135–43. doi:10.3109/03014460.2014.930173- ↵
- ↵
- ↵
- ↵
- ↵
- ↵
- ↵
- ↵
- ↵
- ↵
- ↵
- ↵
- ↵
- ↵
- ↵
- ↵
- ↵
- ↵
- ↵
- ↵
- Moreira C,
- Santos R,
- Ruiz JR, et al
equations in the ability to discriminate the metabolic risk in Portuguese adolescents. J Sci Med Sport 2011;14:79–84. doi:10.1016/j.jsams.2010.07.003 - ↵
- ↵
- ↵
- Barnett A,
- Chan LYS,
- Bruce IC
in Hong Kong Chinese students. Pediatr Exerc Sci 1993;5:42–50. - ↵
- ↵
- ↵
- ↵
- Mahar MT,
- Welk GJ,
- Rowe DA, et al
from PACER 20-m shuttle run performance. J Phys Act Health 2006;3:S34–46. - ↵
- Ruiz JR,
- Ramirez-Lechuga J,
- Ortega FB, et al
from the 20 m shuttle run test in adolescents. Artif Intell Med 2008;44:233–45. doi:10.1016/j.artmed.2008.06.004 - ↵
- ↵
- Pitetti KH,
- Fernhall B,
- Figoni S
using the 20-m shuttle run for children and adolescents. Pediatr Exerc Sci 2002;14:125–34. - ↵
- ↵
- ↵
- ↵
- ↵
- ↵
- ↵
- ↵
- ↵
- ↵
- ↵
- ↵
- ↵
- ↵
- ↵
- ↵
- ↵
- ↵
- ↵
- ↵
- ↵
- ↵
- ↵
- ↵
- ↵
- ↵
- ↵


Footnotes
Contributors GRT, JJL and MST developed the systematic review research question and objectives. GRT, JJL, AGL and KB created the search strategy and provided guidance on review methodology. GRT, JJL, MD, AGL and KB screened and extracted the data. GRT and JJL led data analysis, synthesis and writing of the manuscript. All authors contributed to interpretation of the results, edited, reviewed and approved the final manuscript.
Competing interests None declared.
Provenance and peer review Not commissioned; externally peer reviewed.