Article Text

Abstract
Background Course setting has often been discussed as a potential preventative measure in the World Cup ski-racing community. However, there is limited understanding of how it is related to injury risk.
Objective This study was undertaken to investigate the effect of increased horizontal gate distance on energy-related and injury mechanism-related variables.
Methods During a video-based three-dimensional (3D)-kinematic field measurement, a top world-class racer performed giant slalom runs at two course settings with different horizontal gate distances. A full-body segment model was reconstructed in 3D and selected biomechanical parameters were calculated.
Results For the analysed turn, no significant differences were found in turn speed for increased horizontal gate distance. However, a large effect size was observed for speed reduction towards the end of the turn. Turn forces were by tendency higher at the beginning and significantly higher towards the end of the turn. Additionally, significant differences were found in higher inward leaning, and large effect sizes were observed for a decreased fore/aft position after gate passage.
Conclusions On the basis of the data of this study, no final conclusion can be made about whether, for a section of consecutive turns, increasing horizontal gate distance is an effective tool for speed reduction. However, this study pointed out two major drawbacks of this course setting modification: (1) it may increase fatigue as a consequence of loading forces acting over a longer duration; (2) it may increase the risk of out-of-balance situations by forcing the athlete to exhaust his backward and inward leaning spectrum.
- Injury Prevention
- Biomechanics
- Ski injuries
This is an open-access article distributed under the terms of the Creative Commons Attribution Non-commercial License, which permits use, distribution, and reproduction in any medium, provided the original work is properly cited, the use is non commercial and is otherwise in compliance with the license. See: http://creativecommons.org/licenses/by-nc/3.0/ and http://creativecommons.org/licenses/by-nc/3.0/legalcode
Statistics from Altmetric.com
Introduction
Injuries in alpine skiing have been a serious concern since the very beginning of the sport. Assessed over many decades, incidence, severity, aetiology and injury prevention strategies for recreational skiers are well documented.1–13 In contrast, there are only a few papers addressing the area of elite competitive ski racing.14–18
Data by the International Ski Federation (FIS) Injury Surveillance System (ISS) illustrated an alarmingly high injury risk for World Cup (WC) alpine ski racers. Over the WC seasons 2006/2007 and 2007/2008 injury rates of 36.7 per 100 athletes were reported.15 The most commonly injured body part was found to be the knee (35.6%), and the rupture of the anterior cruciate ligament (ACL) was the most frequent specific diagnosis.15 Recently, three distinctive mechanisms of ACL injuries in WC ski racing were identified: ‘slip-catch’, ‘dynamic snowplough’ and ‘landing back weighted’.17 Characteristically, for the ‘slip-catch’ and ‘dynamic snowplough’ mechanisms, the racer initially lost balance backward and inward. Then, while trying to regain grip, the inside edge of either the outer or inner ski caught abruptly in the snow, forcing the knee into valgus and internal rotation. In order to reduce the risk of these injury mechanisms, measures that can reduce the energy involved in the injury situations, may be effective prevention clues.17 ,18 Moreover, high skiing speeds, large forces and critical factors that contribute to out-of-balance situations were suggested to play a central role in ACL injury mechanisms.17 ,18
One potential preventative measure that approaches the energy involved and that is widely discussed among the ski racing community, is course setting.19 Course setting has already been shown to influence skiers’ energy in an earlier study of alpine skiing technique in slalom.20 In the context of injury prevention, course setting became even more important with the introduction of side cut to racing skis, which allowed the racers to carve tighter turns with less friction and to retain speed in situations where previously they skidded and lost speed.21 In an attempt to keep speed within a safe range in giant slalom (GS), horizontal gate distances became apparently greater over the last decade and the racers had to turn more out of the direction of the fall line. However, it is neither obvious how increased horizontal gate distance influences energy-related variables such as turn speed, nor how it effects injury mechanism-related variables like acting forces and uncontrolled backward and/or inward leaning. The current study is the first study to address this topic in the context of injury prevention; therefore, the purpose of this explorative case study was to investigate the effect of increased horizontal gate distance on energy-related and injury mechanism-related variables in GS.
Methods
Data collection
During a three-dimensional (3D) kinematic field measurement using a system of five panned, tilted and zoomed video cameras (50 Hz, time synchronised by a gen-lock signal) a top world-class racer performed a total of 12 runs on an injected 15 gate course. After six gates accelerating the racer up to average GS speeds, the racer entered a five-gate section with constant slope inclination of 27.5°. Within this section, gate distances were modified after the first six runs. Initial gate distances were 26 m in vertical direction with an offset of 12 m and were changed for another six runs to 26/10 m (figure 1). These two course settings represent the two extremes of the horizontal gate distance spectrum, common for similar conditions in WC ski racing. In order to determine the skier's 3D position data, a total of 78 reference points were geodetically measured and used to calibrate a capture volume corridor of 52×12×2 m around the analysed turn, which was situated in the middle of the modified five-gate section (figure 1). A 28-point body segment model and the three best visible geodetic measured reference points were manually digitised in each frame of each camera. Joint centres of the segment model were defined according to de Leva.22 Finally, the skier's segment model was reconstructed in 3D, using the software PEAK MOTUS and a direct linear transformation (DLT)-based Panning Algorithm by Drenk.23
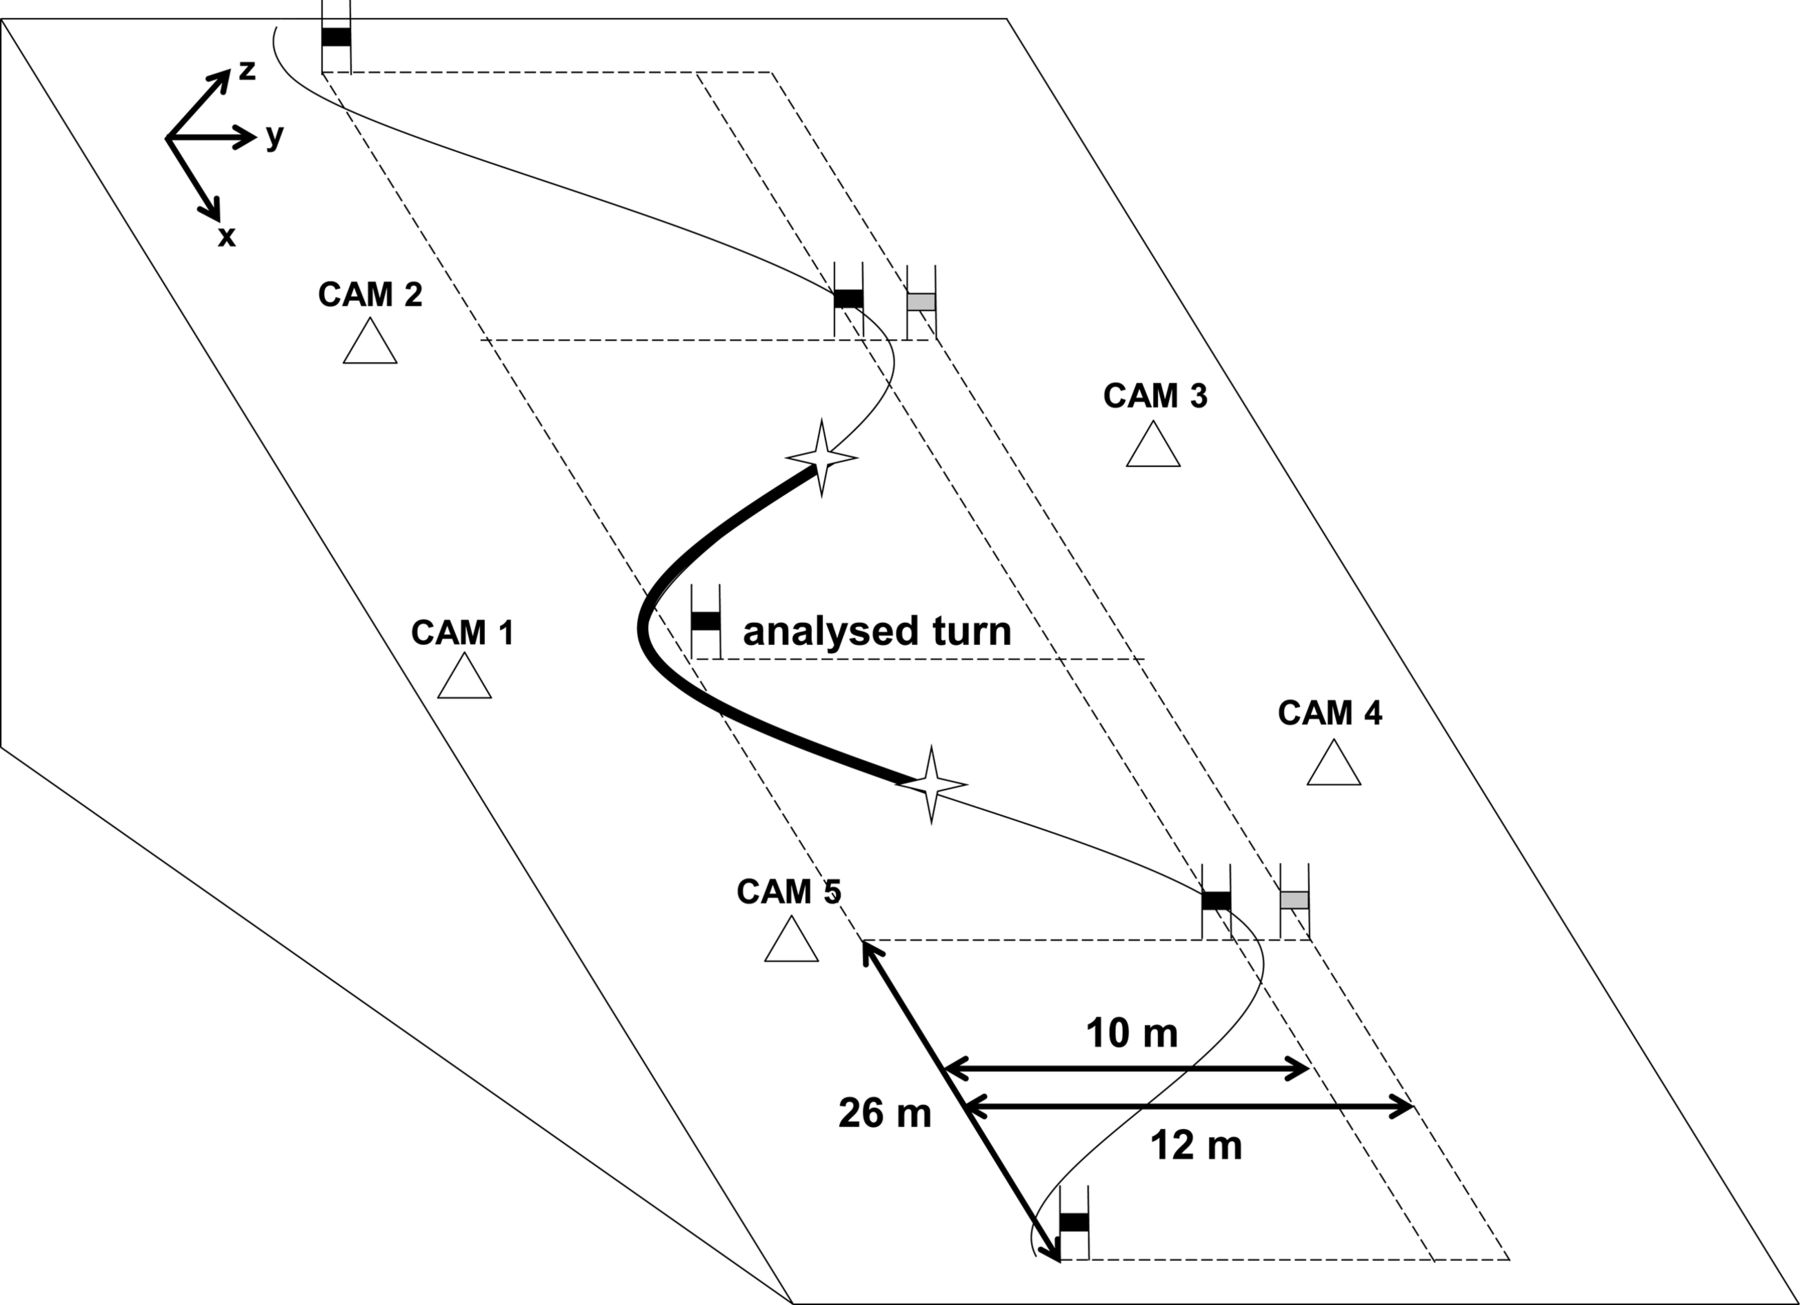
Schema of the measurement setup (CAM 1–5: positions of the panned, tilted and zoomed camcorders).
Parameter calculation
Parameter calculation was performed using the software MATLAB R2009b. Centre of mass (COM) was calculated based on the model of Clauser et al,24 adapted with the skiing equipment. Based on the COM line deviations, COM turn radius (RCOM) and COM speed (vCOM) were calculated numerically.25 As proposed by Supej et al,26 the crossing points of the COM line projected to the slope plane and the ski line were defined as the beginning (a) and end (e) of the turn (figure 2). Furthermore, the first point where RCOM was ≤30 m (b), the point where the COM passed the gate (c) and the last point where RCOM was ≤30 m (d) were defined according to Reid et al27 with the RCOM-criterion adapted for GS. Based on these five characteristic points of the COM line and ski line, turns were divided into four turn phases and their percentages during the whole turn cycle were calculated: Initiation (a→b), COM Direction Change I (b→c), COM Direction Change II (c→d) and Completion (d→e) (figure 2). For the calculation of the lean angle (λLean) and fore/aft position (dFore/Aft), a local coordinate system (x′y′z′) at the ankle joint of the outside ski was used, as proposed by Schiefermüller et al28 (figure 3). x′ was defined by the joint ankle and the direction of the longitudinal axis of the ski. z′ was defined to be perpendicular to the slope plane and y′ was defined as forming a right-handed triad with x′ and z′. λLean was then calculated as the angle between the z-axis and the ski-COM vector projected to the y−z plane (figure 3). dFore/Aft was defined as the cosine of the fore/aft angle, which is the angle between the z-axis and the ski-COM vector projected to the x−z plane (figure 3). Instant relative centripetal force (Fcp) was calculated based on vCOM and RCOM.

Definition of characteristic line points and turn phases: (COM) centre of mass; (a) beginning of the turn (crossing points of the COM line projected to the slope plane and the ski line); (b) first point where COM turn radius ≤30 m; (c) point where the COM passes the gate; (d) last point where COM turn radius ≤30 m; (e) end of the turn (crossing points of the COM line projected to the slope plane and the ski line).

Parameter definition using a local coordinate system at the ankle joint of the outside ski: COM, centre of mass; λLean, lean angle; dFore/Aft, fore/aft position.
Statistical analysis
Owing to the explorative character of this study, the following steps of statistical analysis were performed: (1) turn average and peak values of the selected parameters were described with mean±SD, and differences between the two course settings were determined using several unpaired t tests (p<0.05) and effect sizes (Cohen's d); (2) the uncertainty around the estimate of the mean was visualised as the area between the SE boundaries, and potential differences were located with respect to the specific functional phases of the turn; (3) potential differences in specific functional turn phases were tested for significance using several unpaired t tests (p<0.05) and effect sizes (Cohen's d).
Results
Differences over the entire turn cycle
The statistics comparing the two course settings with regard to parameter differences over the entire turn cycle are presented in table 1. Regarding vCOM, no significant differences in turn averages and peak values were found for the analysed turn. However, for increased horizontal gate distances, a medium effect for higher vCOM turn averages was observable. Furthermore, on the 26/12 m course, large effect sizes were observed for higher average Fcp, lower average dFore/Aft and lower minimum dFore/Aft. A significant difference was found in higher average λLean. With respect to vCOM, the difference between exit speed and entrance speed (vout−vin) differed by 0.32 m/s in mean (26/10 m: 0.41±0.58; 26/12 m: 0.09±0.71, d=0.476).
Mean±SD and Cohen's d for turn averages and peak values of selected parameters related to injury risk at two different course settings
Differences in parameter progressions
The progressions of the selected parameters for the two course settings cycle are presented in figure 4. For an increased horizontal gate distance, the following potential differences in the selected parameters may exist: (1) decreased vCOM during Completion; (2) increased Fcp during Initiation and Completion and (3) decreased dFore/Aft and increased λLean during the turn phases after gate passage (COM Direction Change II and Completion).
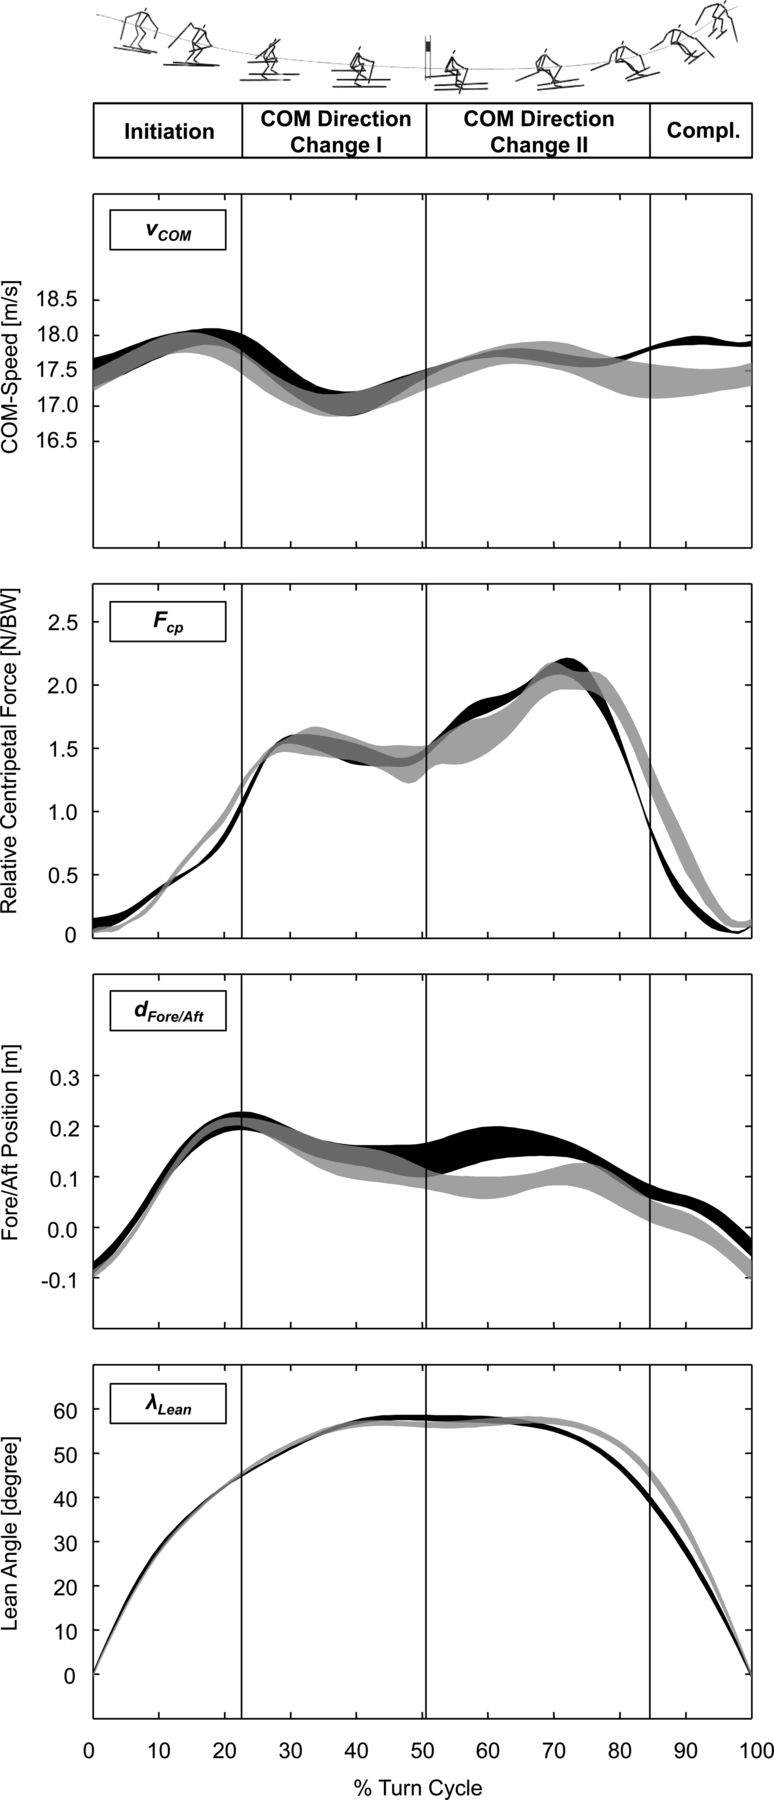
Areas of uncertainty around the estimate of the mean (±SE) for selected parameters related to injury risk at two different course settings; grey: 26/12 m course; black: 26/10 m course. COM, centre of mass; dFore/Aft, fore/aft position; Fcp, relative centripetal force; vCOM, COM speed; λLean, lean angle.
Differences over specific turn phases
The statistics comparing the two course settings with regard to parameter differences over specific turn phases are presented in table 2. Regarding vCOM, a large effect for a lower phase average was observed during Completion on the 26/12 m course. A medium-to-large effect for higher average Fcp was found during Initiation. Moreover, Fcp was significantly increased during Completion. For the turn phases after gate passage, a large effect was found for decreased dFore/Aft on the 26/12 m course and λLean was significantly increased.
Mean±SD and Cohen's d for turn phase averages of selected parameters related to injury risk at two different course settings
Differences in turn cycle structure
The horizontal course setting modification changed the athlete's turn cycle structure significantly (figure 5). On the 26/12 m course, the percentage of the turn cycle where RCOM was ≤30 m (COM Direction Change I&II) was higher than on the 26/10 m course (26/10 m: 58.5±1.9; 26/12 m: 64.8±2.5**, d=2.777).

Turn cycle structures as a measure for the athletes timing at the two different course settings. COM, centre of mass.
Discussion
The main findings for increased horizontal gate distances were as follows: (1) vCOM was not significantly reduced over the analysed turn cycle; however, a large effect towards speed reduction during Completion was observed; (2) Fcp was by tendency higher during Initiation (medium−large effect) and Fcp was significantly increased during Completion; (3) large effect sizes were found for a decreased dFore/Aft during the turn phases after gate passage and for minimum dFore/Aft; (4) λLean was significantly increased during the turn phases after gate passage and (5) the turn cycle structure was significantly changed towards a longer COM Direction Change.
Course setting and speed control
Despite a substantial increase in horizontal gate distance, vCOM was not significantly reduced over the analysed turn cycle (table 1). However, looking at the progression of vCOM within the turn cycle, it is obvious that during Initiation and COM Direction Change I&II, vCOM remained more or less unchanged, while during Completion, vCOM was reduced (figure 4 and table 2). Consequently, the differences in vCOM might be negligible for the analysed turn, although they might have more influence on the following section. Under the assumption that, for the following turns, speed would be reduced by the same rate of vout−vin as in the analysed turn (0.32 m/s), a substantial speed reduction would be already accumulated after a couple of gates. However, recent studies showed that, owing to tactical reasons, skiers with high vin were losing disproportionally more speed than skiers with low vin while turning.29 ,30 As a result, it is questionable as to whether the observed effects in vCOM would be accumulated over several consecutive turns. Hence, based on the current data, it remains speculative as to whether the analysed course setting modification is able to reduce speed substantially or not. However, further studies with wearable measurement systems capturing several turns per run may provide a deeper understanding of this important question.
Course setting and parameters related to ACL injury mechanisms
While the increase in horizontal gate distance had only a marginal effect on Fcp peak values (table 1), Fcp was by tendency higher during Initiation and Fcp significantly increased during Completion on the 26/12 m course (table 2.) In the context of injury risk, this means that due to a longer substantial change of direction high loading forces are acting over a longer duration of the turn cycle, which might increase the athlete's fatigue. Since high external loads and fatigue are known to have a negative impact on balance control,31 ,32 this may increase the risk for an out-of-balance situation or a fall to occur.
Out-of-balance situations, backward and/or inward, are known to lead to ACL-injury mechanisms.17 Regarding balance control in the direction fore/aft, dFore/Aft was not significantly different; however, it did show a clear trend towards a reduced forward position during the turn phases after gate passage and in minimum values at the end of the turn on the 26/12 m course (table 2). Concerning the lateral direction, λLean was significantly higher during the turn phases after gate passage for the 26/12 m course setting intervention (table 1). Consequently, there are fewer buffers to critical backward and inward positions on the ‘tighter’ 26/12 m course set, and the racer is forced to use his full backward and inward leaning capacities. Based on these findings, the risk for an out-of-balance situation backward and/or inward tends to be higher for the 26/12 m course than for the 26/10 m.
However, maintaining balance in a biomechanical sense is, from the perspective of motor control, not a static, but rather a dynamic task. Therefore, a deeper understanding of the events leading up to an out-of-balance situation might be found in the variability of the motor system. From a dynamic systems perspective, balance may be ensured best by maintaining a central/front position with low variability of COM changes (control variable) while having high variability regarding the joint movements and segment positions (input variables).33 ,34 An interesting finding in this context is that towards the end of the turn, wider areas of uncertainty around the estimate of the mean (±SE) were observed for vCOM, Fcp and dFore/Aft on the 26/12 m course (figure 4). This may be interpreted as a trend for higher variability in the racer's movement pattern on the course with increased horizontal gate distances. Hence, looking at variability aspects of movement might be a promising approach for further studies in the context of injury mechanisms related out-of-balance situations in alpine ski racing.
Course setting and athlete's timing characteristics
Although on a first view the athlete's timing characteristics seem not to be directly related to injury risk, the differences in turn cycle structure may provide a deeper understanding of the mechanisms underlying the selected parameters related to injury risk. On the 26/12 m course, turn cycle structure was significantly changed towards a higher percentage of the turn cycle where RCOM was ≤30 m (COM Direction Change I&II). This change of the athlete's strategy might explain the fact that vCOM remains more or less unchanged over a wide section of the turn cycle, while during Completion, speed was lower for increased horizontal gate distance (figure 4). Owing to a longer COM Direction Change I&II the racer might be able to compensate for the course setting changes without having to change the average amount of energy dissipation over a wide range of the turn cycle. However, towards the end of the turn, the later termination of COM Direction Change II and the shorter distance to the next gate may force the athlete to perform more at his limit, making him more susceptible to technical mistakes. Furthermore, at the end of the turn, the shorter duration where RCOM is >30 m (Completion) may limit the racer's speed uptake due to a shorter straight transition of COM. Hence, these aspects may serve as an explanation for the lower speed towards the end of the turn and the higher variability in vCOM, Fcp and dFore/Aft on 26/12 m course.
Methodological considerations
Study design
At first glance, one limitation of the present study might be the fact that for the analysis, the focus was only on one subject. This choice can be considered from two different perspectives: On the one hand, analysing more subjects would strengthen the possibilities for generalising the results. On the other hand, using a single subject design reduced the variability between the single trials; therefore, it increased the power to detect differences between the two course settings. Furthermore, it has to be pointed out that different course settings can be adapted by athletes with different individual strategies regarding line and timing. This directly influences the variables related to injury risk. An individual-subject-analysis design is needed when the variations in movement are the result of different strategies to perform the same task by individual subjects, and not the result of more or less variations among individuals.35 Accordingly, the use of an individual-subject-analysis design can be argued to be appropriate for the present explorative research question.
Data collection
The reliability and accuracy of the method that was used for collecting kinematic data in the field have been shown to be comparable to laboratory conditions in an earlier study.36 However, measuring 3D kinematics in alpine ski racing under field conditions is affected by changing snow conditions and an athlete's fatigue due to repetitive runs, wind, temperature and solar radiation. This limits the time where the environmental conditions are constant and, therefore, the maximal number of reliable trials. However, the time period of 3 h used in this study had nearly constant meteorological conditions and the total of 12 trials on the same course was, therefore, in an acceptable range regarding these limitations.
Statistical analysis
A further limitation of the study was the small data sample that was used for the statistical analysis of differences between the two course settings. However, provided that the variability between the trials was small and that for the interpretation of the results effect sizes (Cohen's d) were also considered, this procedure may be justified for the purpose of an explorative case study.
Conclusion
On the basis of the data of this study, no final conclusion can be made whether, for a section of consecutive turns, increasing horizontal gate distance is an effective tool for speed reduction. Therefore, further studies using wearable measurement systems should investigate this aspect more systematically for several gates, different gate combinations and/or under race conditions. Nevertheless, the current study illustrated that as long as the course setting changes are not substantial enough, speed might not be reduced considerably, since racers are still able to adapt and partly compensate by changing their timing strategy. Moreover, the study pointed out two major safety drawbacks of controlling speed by consecutively increasing horizontal gate distances: (1) it may increase fatigue due to a longer substantial change of direction and high loading forces acting over a longer duration of the turn cycle and (2) it may increase the risk of out-of-balance situations by forcing the athlete to exhaust his backward and inward leaning spectrum. Hence, course settings that locally slow down a racer (perhaps in a substantial manner) before terrain changes or key sectors, or alterations in vertical gate distance might be a more appropriate way to reduce speed without the aforementioned drawbacks.
What this study adds
-
For a considerably speed reduction by increasing the horizontal gate distances, substantial course setting changes might be needed, since racers are able to adapt and partly compensate by changing their timing strategy.
-
There might be two safety drawbacks of controlling speed by increased horizontal gate distances: (1) increased fatigue and (2) higher risk of out-of-balance situations.
References
Footnotes
-
Contributors All authors fulfil the criteria of authorship and were involved in: (1) conception and design, acquisition of data or analysis and interpretation of data; (2) drafting the article or revising it critically for important intellectual content and (3) final approval of the version published.
-
Funding This study was financially supported by the International Ski Federation (FIS) Injury Surveillance System (ISS).
-
Competing interests None.
-
Ethical approval This study was approved by the Ethics Committee of the Department of Sport Science and Kinesiology at the University of Salzburg.
-
Provenance and peer review Not commissioned; externally peer reviewed.
-
▸ References to this paper are available online at http://bjsm.bmjgroup.com