Article Text

Abstract
Objectives The purpose of this study was to calculate exposure-based bicycling hospitalisation rates in Canadian jurisdictions with different helmet legislation and bicycling mode shares, and to examine whether the rates were related to these differences.
Methods Administrative data on hospital stays for bicycling injuries to 10 body region groups and national survey data on bicycling trips were used to calculate hospitalisation rates. Rates were calculated for 44 sex, age and jurisdiction strata for all injury causes and 22 age and jurisdiction strata for traffic-related injury causes. Inferential analyses examined associations between hospitalisation rates and sex, age group, helmet legislation and bicycling mode share.
Results In Canada, over the study period 2006–2011, there was an average of 3690 hospitalisations per year and an estimated 593 million annual trips by bicycle among people 12 years of age and older, for a cycling hospitalisation rate of 622 per 100 million trips (95% CI 611 to 633). Hospitalisation rates varied substantially across the jurisdiction, age and sex strata, but only two characteristics explained this variability. For all injury causes, sex was associated with hospitalisation rates; females had rates consistently lower than males. For traffic-related injury causes, higher cycling mode share was consistently associated with lower hospitalisation rates. Helmet legislation was not associated with hospitalisation rates for brain, head, scalp, skull, face or neck injuries.
Conclusions These results suggest that transportation and health policymakers who aim to reduce bicycling injury rates in the population should focus on factors related to increased cycling mode share and female cycling choices. Bicycling routes designed to be physically separated from traffic or along quiet streets fit both these criteria and are associated with lower relative risks of injury.
- PUBLIC HEALTH
- EPIDEMIOLOGY
- PREVENTIVE MEDICINE
This is an Open Access article distributed in accordance with the Creative Commons Attribution Non Commercial (CC BY-NC 4.0) license, which permits others to distribute, remix, adapt, build upon this work non-commercially, and license their derivative works on different terms, provided the original work is properly cited and the use is non-commercial. See: http://creativecommons.org/licenses/by-nc/4.0/
Statistics from Altmetric.com
Strengths and limitations of this study
This study was the first to compare exposure-based injury rates between jurisdictions with different helmet laws and cycling mode shares in one country. It allowed analyses in a setting with smaller cultural and transportation policy differences than in international comparisons.
The study used the same data sources in all jurisdictions for the numerator (hospitalisations) and denominator (bicycling trips). The focus was the most serious cycling injuries, those requiring an inpatient hospital stay. Bicycling trip data were from a series of national surveys that asked for recall of leisure, work and school trips over a 3-month period.
Separate analyses were performed for all injury causes (including transport and sport cycling) and for traffic-related injury causes (focusing on transport cycling). The denominator for traffic-related causes was most likely incomplete, so we could not compare absolute traffic-related injury rates to all-cause injury rates. Within each cause, rates were comparable and these comparisons were the study focus.
We found that females had lower bicycling hospitalisation rates than males in analyses of all injury causes, consistent with results found elsewhere and for other travel modes, an effect often attributed to conservative risk choices.
We found that hospitalisation rates for traffic-related injuries were lower with higher cycling mode shares, a “safety-in-numbers” association consistent with results elsewhere and for other modes of travel.
Helmet legislation was not associated with reduced hospitalisation rates for brain, head, scalp, skull or face injuries, indicating that factors other than helmet laws have more influence on injury rates.
These results provide a useful context about population-level policies that may or may not affect bicycling hospitalisation rates.
Introduction
Bicycling offers personal health benefits because physical activity reduces the risk of many chronic diseases.1 ,2 Bicycling as a mode of transport is inexpensive and reduces traffic congestion, noise, air pollution and greenhouse gas emissions.1 ,3 These benefits have led governments to consider ways to increase transport cycling, but population surveys consistently show that injury-related safety concerns are the major deterrent.4–6
To address these concerns, it is important to understand exposure-based injury risk (ie, the injury rate calculated as injuries per number of bike trips or per distance travelled by bike). This measure allows between-jurisdiction comparisons of cycling safety, useful for assessing the value of different cycling conditions or laws that could guide future policy choices. Some characteristics that differ between jurisdictions include helmet laws, cycling infrastructure and the proportion of all trips made by bike (“mode share”). All of these may be related to cycling injuries. Bicycling injury research is dominated by helmet research; it shows that helmet use is associated with reduced odds of head injuries among those injured in a crash.7 ,8 Studies examining the effect of helmet legislation have shown more mixed results.9–13 Research on cycling infrastructure is less common, but has been growing in the last decade. Results are not always consistent, but most often show that routes with bike-specific infrastructure are safer than routes without.14–17 Research on cycling mode share has repeatedly shown that places with more cycling have lower injury and fatality rates, though the causal pathway is debated.18–21
In a 2008 paper, Pucher and Buehler22 compared jurisdictions with large differences in helmet legislation, cycling infrastructure and mode share. In the USA, the focus of safety policy was promotion or legislation of helmet use, but bike-specific facilities were rare, and the proportion of trips by bicycle was about 1%. In the Netherlands, Denmark and Germany, cycling facilities separated from traffic were common, helmet use was rare, and 10–27% of trips were by bicycle. They also compared injury rates from 2004 to 2009.23 The USA had fatality rates 3–5 times higher and injury rates 7–21 times higher than the northern European countries, lending support to the European policy choices. Others have argued that cultural and multifaceted transportation policy differences between European and American jurisdictions make it difficult to draw conclusions.24
We report a comparison of injury rates within a country that has smaller cultural and transportation policy differences than those between the USA and northern Europe. Canada is a federation of 10 provinces and 3 northern territories whose transportation policies are set at national and provincial levels, resulting in broad similarities in traffic laws and infrastructure but also some differences. Default traffic speeds are 50 km/h in cities and 80 km/h in rural areas; intersections of arterials typically feature traffic lights rather than roundabouts; right turns on red lights are usually permitted; and drunk driving laws usually specify a blood alcohol limit of 0.08%. Despite these similarities, there are differences in bicycling infrastructure, cycling mode shares and helmet laws between provinces and territories, providing an opportunity to examine differences in injury rates. Two data sources with comparable data across all provinces and territories were used to provide descriptive information and calculate injury rates: hospital discharge data for bicycling injuries; and national health survey data for bicycling trips. Since hospital discharge data include all bicycling injuries, whether incurred during bicycling as a mode of transport or in bicycling sports (eg, road racing, mountain biking, cyclo-cross, BMX, trick riding), the subset of injuries designated as traffic-related were examined separately. Inferential analyses examined whether cycling mode share or helmet legislation were related to injury rates.
Methods
This analysis used administrative data on bicycling hospitalisations and trips matched as closely as possible to the 6-year period from 2006 to 2011 inclusive. This period was chosen because it is bracketed by census years (census data were used for some study variables), included the most recent complete hospitalisation data, and represented a period of stability in helmet laws nationwide. The study was restricted to individuals aged 12 years or older because data on bicycling trips were available only for these ages.
Hospitalisations
In Canada, a hospitalisation record is generated when a patient is “admitted” to hospital for at least one overnight stay in a department other than the emergency department. These data include deaths after admission to hospital, though they represent a small proportion of all hospitalisations9 and are not separately reported here. Data on all hospitalisations for bicycling injuries in Canada in the 6-fiscal-year period from 1 April 2006 to 31 March 2012 (all years combined) were obtained from the Discharge Abstract Database (all inpatient admissions to acute care hospitals in Canada) managed by the Canadian Institute for Health Information (CIHI).25 Bicycling injuries were specified as those with International Classification of Diseases, Tenth Revision, Canada (ICD-10-CA) external cause codes V10–V19 inclusive.26 The fiscal year starting 1 April 2006 was the first in which ICD-10 coding was consistently used by all hospitals in Canada. Hospital transfers were not included, so each hospitalisation was counted once only—at the initial admission.
Tabulated data were received from CIHI stratified by jurisdiction, sex, age group, injury cause and injured body region (data format, see online supplementary file 1). Jurisdiction was specified as the location of the hospital of first treatment, to maximise the likelihood that the jurisdiction of hospitalisation was where the injury occurred. Jurisdiction included 11 categories (10 provinces, and the 3 territories—Yukon, Northwest, Nunavut—in one group). Age groups were adult (18+) and youth (12–17). Injury causes and injured body regions were determined using ICD-10-CA codes. Injury causes included all causes and the subset, traffic-related causes. Ten injured body region groups were defined: brain; head, scalp or skull; face; neck; torso; upper extremities; lower extremities; brain, head, scalp, skull or face; torso or extremities; and any body region (codes, see online supplementary file 2). Up to 25 injuries are coded per patient, but within each body region group, a hospitalisation was counted once only.
Bicycling trips
Data on bicycling trips for the years 2006–2011 inclusive were estimated from the Canadian Community Health Survey (CCHS) 2005, 2007/2008, 2009/2010, and 2011/2012 cycles. The CCHS is conducted by Statistics Canada and each cycle samples 130 000 people 12 years of age and older who live in private dwellings (98% of the population) in all jurisdictions and health regions.27 Prior to 2007, the CCHS was conducted over a 1-year period every 2 years. From 2007 forward, it was conducted throughout a 2-year cycle, with 65 000 people surveyed each year. Samples are drawn from a geographic sampling frame using a two-stage stratified design, and from telephone number or random digit dialling sampling frames using simple random sampling within health regions. Interviews are conducted using computer-assisted in-person and telephone interviewing, at randomly selected times from January to December to avoid seasonal bias. Bicycling trip data were extracted from the CCHS public release data sets, stratified by jurisdiction, sex and age group, as for hospitalisations.
The following questions were used to tally leisure cycling trips:
“To begin with, I'll be dealing with physical activities not related to work, that is, leisure time activities. Have you done any of the following in the past 3 months, that is, from (date 3 months ago) to yesterday? Bicycling?”
If yes, “In the past 3 months, how many times did you participate in bicycling?”
Leisure cycling trips per year in each jurisdiction, sex and age group stratum were calculated as the sum of all self-reported times bicycling in the past 3 months multiplied by four for an annual count.
The following questions were used to tally work and school cycling trips:
“Other than the (X) times you already reported bicycling was there any other time in the past 3 months when you bicycled to and from work or school?”
If yes, “How many times?”
Work and school cycling trips per year in each jurisdiction, sex and age group stratum were calculated using the same methods as for leisure cycling trips.
The CCHS data collected in 2005 used a sampling design by Statistics Canada meant to be representative of the entire population and their health behaviours for a 2-year cycle (2005 and 2006). These data were used to calculate annual leisure cycling trips for 2006. Annual work and school cycling trips were estimated from the 2007 survey data, as these were not queried on the 2005 survey.
Total bicycling trips were calculated as the sum of leisure, work and school trips. Unlike the hospitalisation data, which were complete population data, bicycling trip data were estimated from survey samples. Counts were therefore weighted to demographic strata using the Statistics Canada survey sampling weights to account for the sampling design and generate population-based estimates. We followed the Statistics Canada bootstrapping protocol (500 replicates) to calculate confidence limits for the estimate of total bicycling trips.
Hospitalisation rates
Two sets of hospitalisation rates were calculated for injuries to each body region. The first set used data for injuries from all injury causes. Hospitalisation rates were calculated by dividing the total number of hospitalisations over the 6-year period by the total estimated number of bicycling trips (leisure, work and school) for the period. For each body region, rates were calculated for 44 strata: 11 jurisdictions × 2 age groups × 2 sexes.
The second set of hospitalisation rates was calculated for the subset of injuries that were traffic related, since in all jurisdictions with helmet legislation, the law applies to public roads, the same location used in injury coding for ‘traffic-related’. Trips to work or school are more likely than leisure trips to require use of public roads, so work and school trip data were used as the denominator for this rate calculation. Hospitalisation rates were calculated by dividing the total number of traffic-related hospitalisations over the 6-year period by the estimated number of bicycling trips to work or school for the period. Since traffic-related injuries were only about half of all injuries, these data were not stratified by sex, to minimise the number of strata with zero hospitalisations. For each body region, rates were calculated for 22 strata: 11 jurisdictions × 2 age groups.
Other data sources
Data on population size were obtained from the 2006 and 2011 Censuses (each conducted on a single date in mid-May).28 Data on cycling mode share were averaged from the 2006 Census long form and the 2011 National Household Survey29 ,30 and represent the proportion of the total employed labour force that did not work at home and reported their usual mode of transportation to and from work as the bicycle.
Information about helmet laws was retrieved from a previous publication31 and from the legislation itself. Data on helmet use in all jurisdictions were available from the 2009/2010 CCHS via the following questions: “In the past 12 months, have you done any bicycling?” and if yes, “When riding a bicycle, how often do you wear a helmet?” The proportions who reported wearing a helmet always or most of the time were calculated for the same strata as hospitalisation rates.
To provide a sense of cycling conditions by jurisdiction, a summary metric, Bike Score, is reported for the most populous city with available data in each jurisdiction. For Canadian cities, it is based on hilliness, density of amenities, road connectivity, and density of bike lanes, bike paths and local street bikeways (Matt Lerner, CTO, Walk Score, Seattle, Washington, USA, 4 May 2012, personal communication).
Associations between hospitalisation rates and cycling mode share, helmet legislation, age group, sex
For injuries to any body region and to the brain, head, scalp, skull or face, the associations between cycling mode share and hospitalisation rates for all injury causes (44 strata) and for traffic-related injury causes (22 strata) were examined using scatter plots.
For inferential analyses, the hospitalisation rate variables for each injury cause and body region group were transformed using the logit (ln(r/(1-r)), where r=hospitalisation rate). This transformation of the bounded (0,1) rates ensured that the dependent variable was normally distributed (p>0.05, Shapiro-Wilk goodness of fit test, all hospitalisation rate variables). Exponentiated coefficients for the independent variables were reported as ORs.
Simple linear regression was used to examine associations between mode share and the logit of hospitalisation rates for injuries to any body region and to the brain, head, scalp, skull or face, for all injury causes (44 strata) and for traffic-related injury causes (22 strata). Similar analyses were conducted to examine associations between hospitalisation rates and helmet legislation, though these were extended to separately examine each body region group potentially associated with helmet legislation (brain, head, scalp, skull or face; brain; head, scalp or skull; face; neck). Helmet legislation was categorised as:
No helmet law (all ages in Manitoba, Newfoundland and Labrador, Quebec, Saskatchewan, and the three territories; adults in Alberta and Ontario);
Helmet law (all ages in British Columbia, New Brunswick, Nova Scotia and Prince Edward Island; youths in Alberta and Ontario).
Multiple regression was used to examine the association between the logit of hospitalisation rate for all injury causes (44 strata) and helmet legislation, cycling mode share, sex and age group (all as fixed effects), for injuries to any body region and to the brain, head, scalp, skull or face. Jurisdiction was offered as a random effect to adjust for within-jurisdiction correlation not explained by the fixed effects in the model, but removed if it was not a substantial (>20%) or statistically significant component of variance. The same modelling was repeated to examine associations between traffic-related hospitalisation rates (22 strata) and helmet legislation, cycling mode share and age group.
The helmet legislation results of the above models were checked via separate analyses of each body region group potentially impacted by helmet legislation (brain, head, scalp, skull or face; brain; head, scalp or skull; face; neck). In addition, since some jurisdictions without provincial legislation had helmet by-laws in municipalities, these analyses were repeated, substituting the proportions using helmets in study strata for the helmet legislation variable.
For some body region groups, one or more strata had zero hospitalisations. Omitting strata with zero hospitalisations from the analyses would be biased, so we calculated the hospitalisation rate for these strata using a numerator of 0.1 injuries. Of the four main analyses, only one included a single stratum with a zero injury count requiring this substitution (all-cause injuries to the brain, head, scalp, skull or face).
CCHS data were generated using SAS V.9.4 (SAS Institute Inc, Cary, North Carolina, USA), rate calculations and all other analyses were performed using JMP 11 (SAS Institute Inc, Cary, North Carolina, USA).
Results
In Canada over the period 2006–2011, there was an annual average of 3690 hospitalisations for injuries incurred during bicycling among people 12 years of age and older. Table 1 lists the causes of the injury events. A slight majority (53%) of adult injuries were traffic-related, but only 41% of youth injuries were. Almost all collisions with motor vehicles (ICD-10 codes V12–V14) were traffic related. For youths and adults, a majority of injuries were non-collision transport accidents (V18), and most of these were not traffic related.
Annual average number of hospitalisations for bicycling injuries and per cent that were traffic related, by cause of injury and age group, in Canada in the period from 2006 to 2011
Figure 1 shows hospitalisations in Canada by body region injured. The affected body regions followed very similar patterns in youths and adults; upper extremities were the most frequently injured, followed by lower extremities, torso, brain, head or scalp or skull, face and neck. Torso or extremity injuries were incurred by 82% of those hospitalised; brain, head, scalp, skull or face injuries by 25%; and neck injuries by 5%. Many people experienced multiple injuries, both within broad body regions (eg, brain and head) and across any body region (eg, head and extremities). The majority of those injured were male (88.6% of youths, 73.4% of adults).
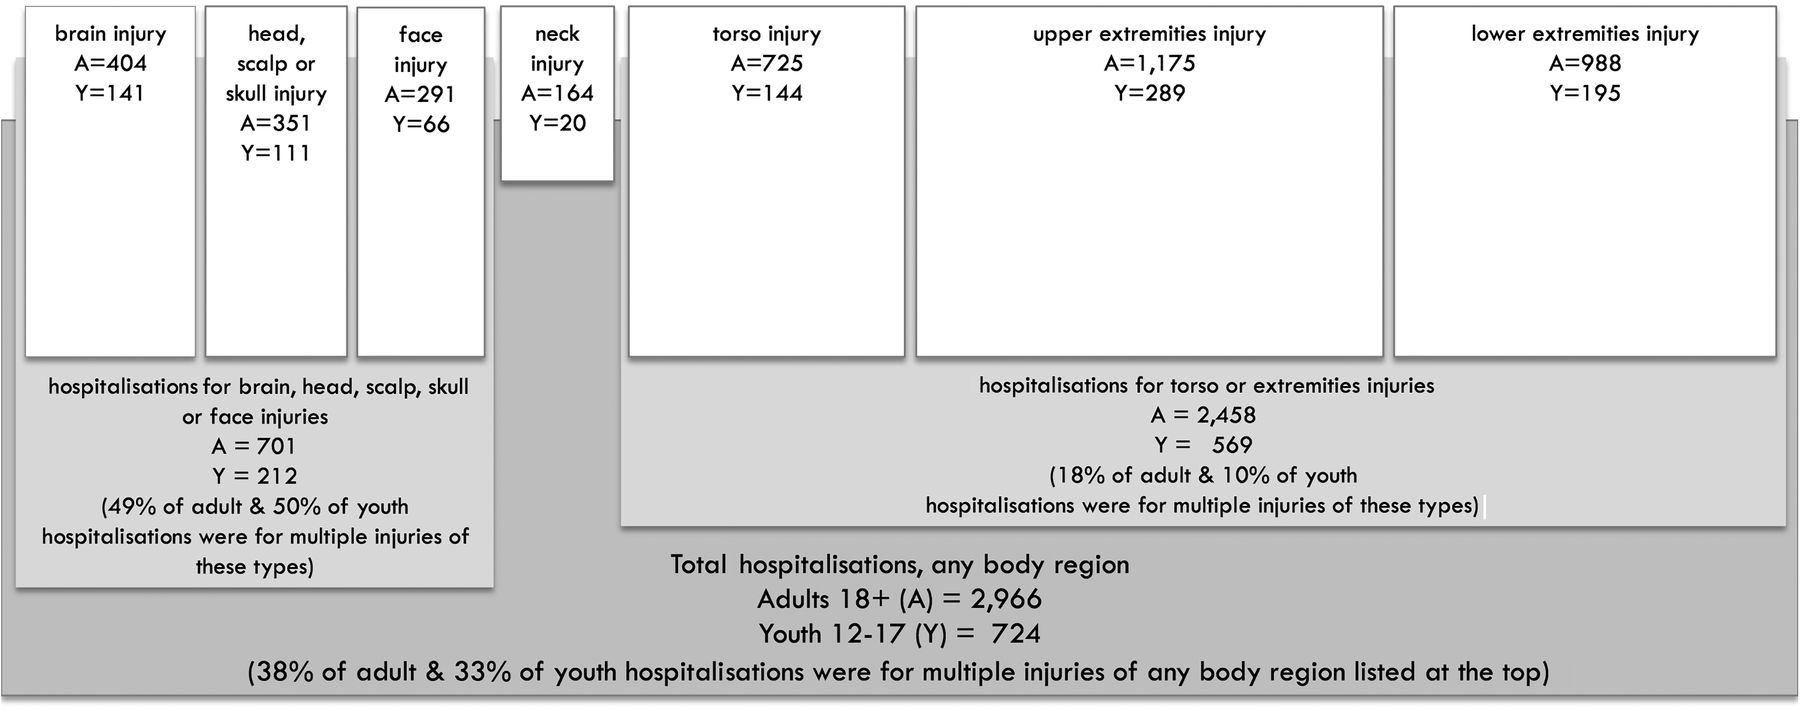
Annual average number of hospitalisations for bicycling injuries, by body region and age group, in Canada from 2006 to 2011.
Table 2 provides data on the 11 jurisdictions included in this study, illustrating the differences in bicycling conditions in their most populous cities, as well as in cycling mode share on a jurisdiction-wide basis. Although their regional coverage differed, provincial cycling mode share was positively correlated with Bike Score in the most populous city. Table 2 also provides data on the annual average number of bike trips by youths and adults, a total of 593 million trips (95% CI 583 to 604 million trips). The proportions of bicycling trips for work or school commutes were low, though they differed by age group and jurisdiction. More trips were made by males than females (71.0% by male youths, 63.5% by male adults).
Characteristics of Canadian provinces and territories during study period of 2006–2011: population, Bike Score, cycling mode share, bicycling trips for all purposes and per cent that were trips to work or school
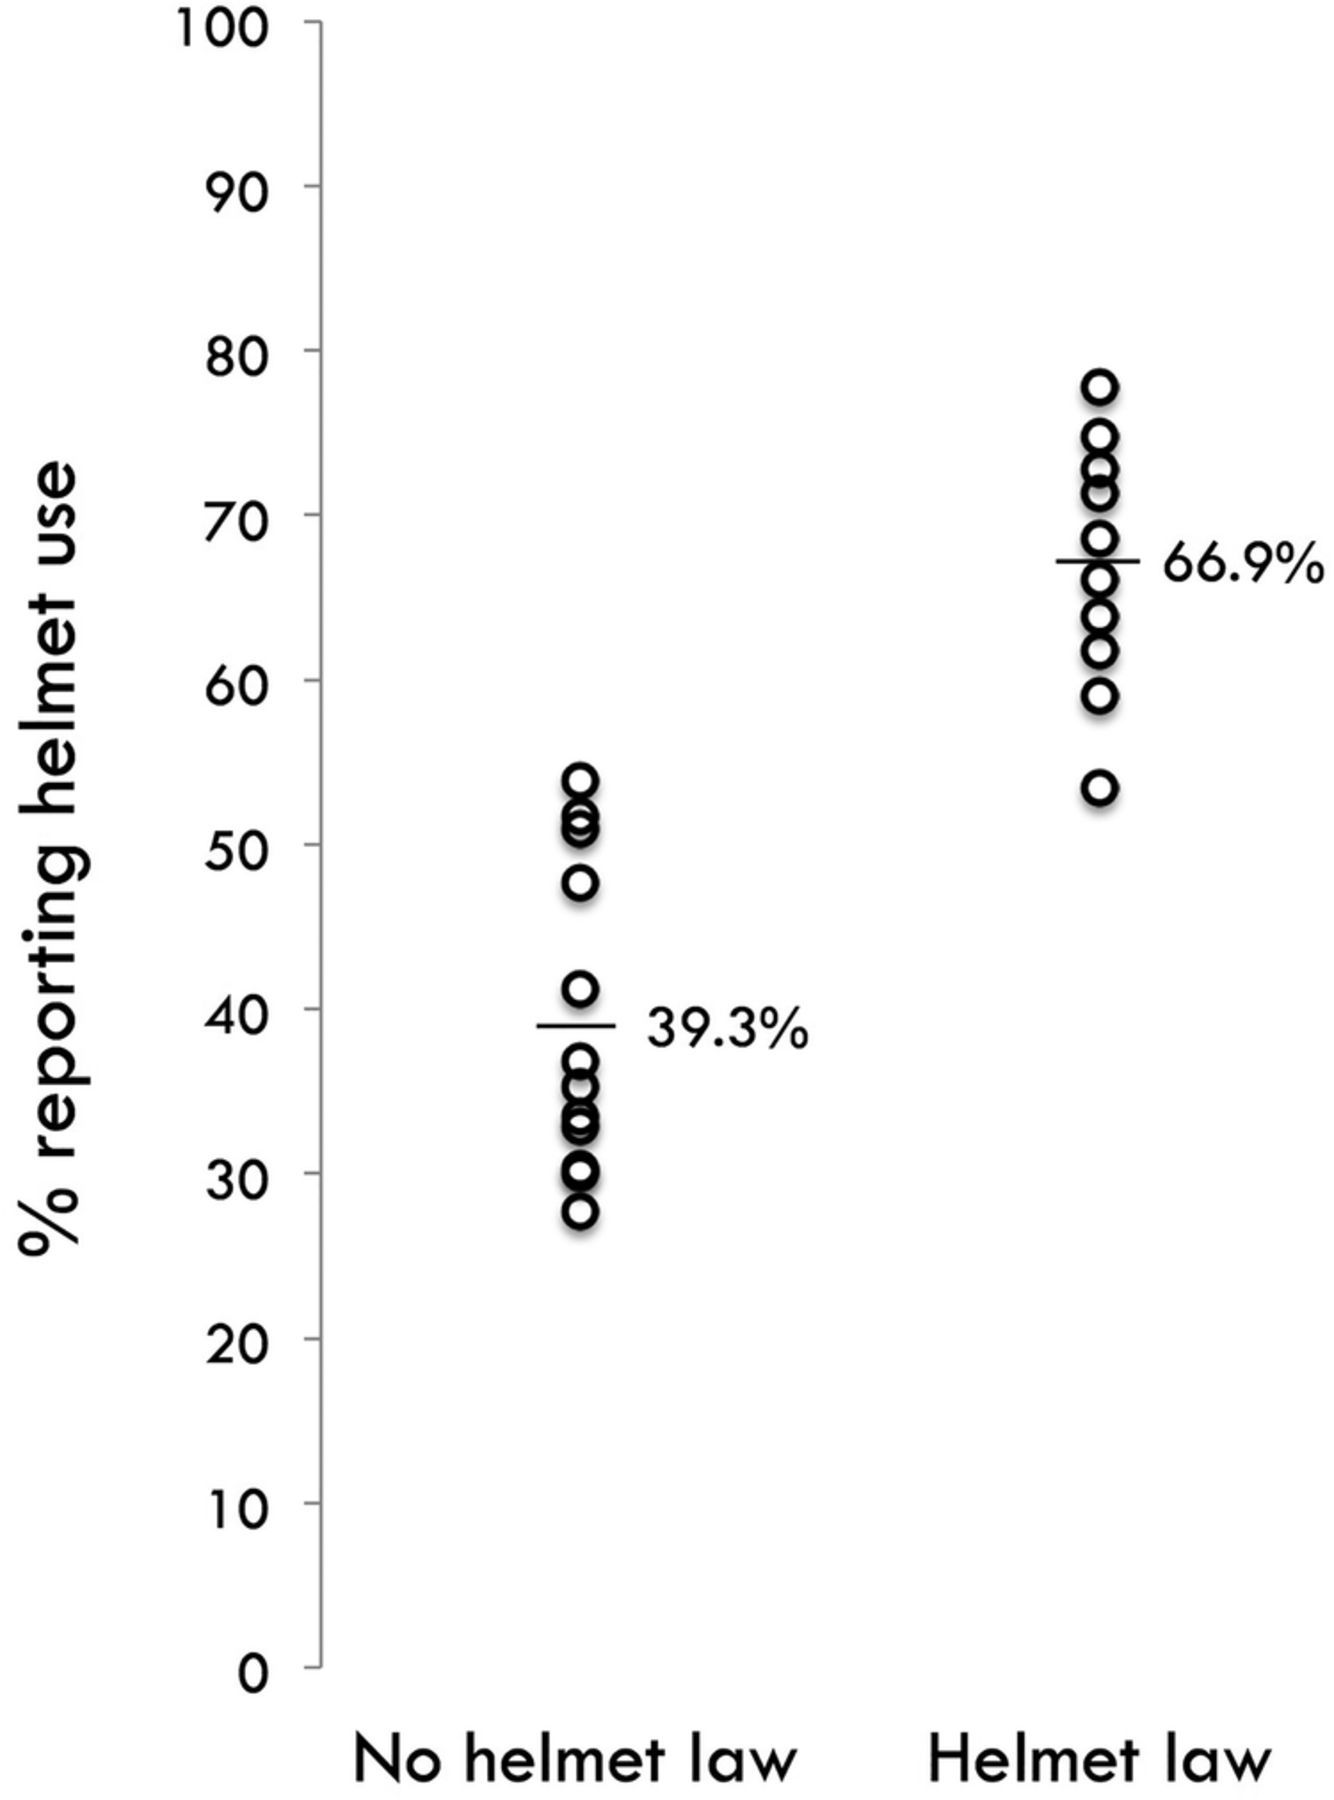
Table 3 outlines differences in helmet legislation by jurisdiction. Four provinces had legislation that applied to all ages and two had legislation that applied to children only (ie, age 17 and under). These helmet laws came into force between 1996 and 2003, at least 3 years prior to the start of the study period in all jurisdictions. All provincial helmet laws are pursuant to traffic or motor vehicle acts and applied to bicycling on public roads. This application is not publicised and may not be well known. Figure 2 presents the helmet use data in table 3 graphically and illustrates that helmet use was higher with helmet laws than without.
Helmet legislation and helmet use, stratified by age group, in Canadian provinces and territories

Per cent of youth and adult bicycle users in each province reporting helmet use always or most of the time (2009 Canadian Community Health Survey), by helmet law or not. Thin bars denote means.
In the study period, the cycling hospitalisation rate for youths and adults combined was 622 hospitalisations per 100 million trips (95% CI 611 to 633), with a slightly lower rate for youths than adults (545 vs 644, respectively). This reflects a lower hospitalisation rate for injuries to the torso and extremities for youths than adults (428 vs 534, respectively), whereas rates for brain, head, scalp, skull or face injuries were very similar for the two age groups (159 vs 152, respectively).
Figures 3A and 3B show the hospitalisation rates in 44 age group, sex and jurisdiction strata. Hospitalisation rates for the torso or extremities were highly correlated with those for any body region (Pearson r=0.98), so only the latter are shown. Rates for brain, head, scalp, skull or face injuries were less correlated with those for any body region (r=0.81), so they are shown separately. Figures 3C and 3D show the rates for traffic-related injury causes (ie, those on public roads) using work or school trips as the denominator (22 age group and jurisdiction strata).

Hospitalisation rates and cycling mode share during the study period, by injury cause and body region (rates for 44 strata for all injury causes and for 22 strata for traffic-related injury causes). Note that jurisdictions can be identified via their mode share, reported in Table 2. A and B show hospitalisation rates for all injury causes; A for injuries to any body region and B for injuries to the brain, head, scalp, skull or face. C and D show hospitalisation rates for traffic-related causes; C for injuries to any body region and D for injuries to the brain, head, scalp, skull or face.
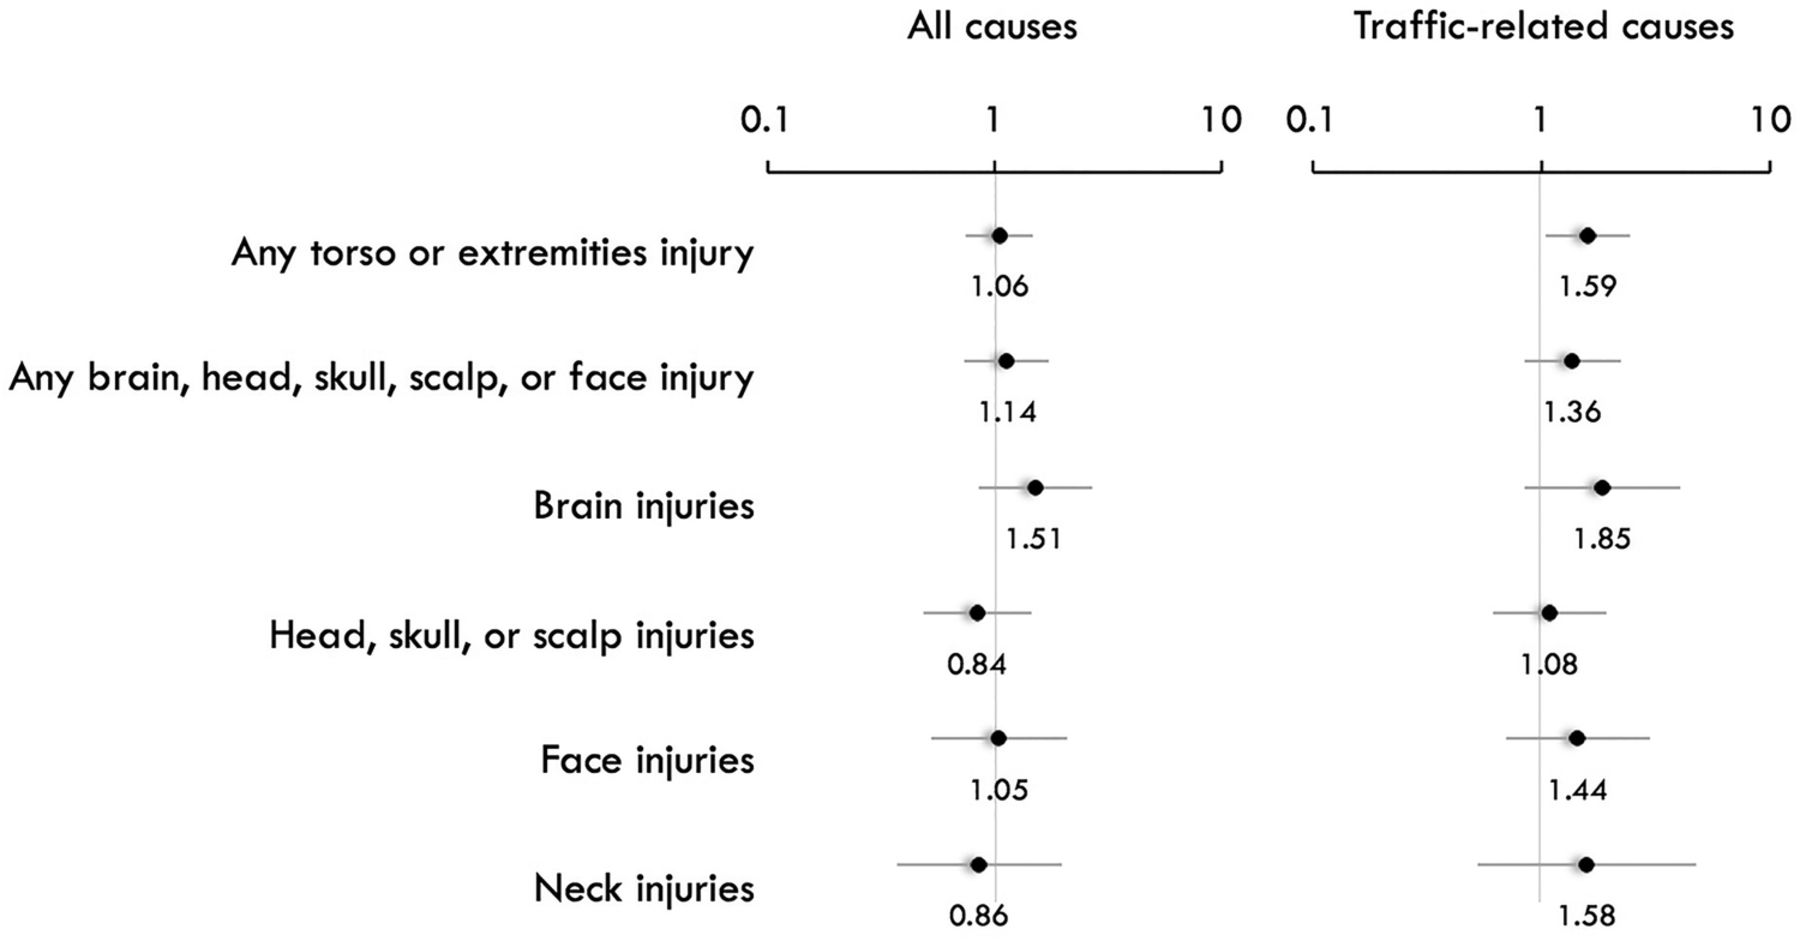
In figure 3A–D, cycling mode share in the jurisdiction is the X-axis. In simple linear regression, hospitalisation rates for traffic-related injuries (logit-transformed) were significantly associated with mode share (figure 3C, D). Higher mode shares were associated with lower hospitalisation rates. The figure also denote whether the stratum was subject to helmet legislation. Figure 4 summarises the results of analyses examining associations between hospitalisation rates and helmet laws. No associations were found for body regions potentially affected by helmets (any brain, head, scalp, skull or face; brain; head, scalp or skull; face; neck).

ORs (and 95% CIs) for associations between hospitalisation rates and helmet legislation, for potentially associated body regions and for torso or extremity injuries as a comparison. Reference group in each case is no helmet law (OR=1).
Table 4 shows the results of multiple regression models examining associations between hospitalisation rates and sex, age group, helmet legislation and cycling mode share. For all injury hospitalisations, sex was significantly associated with hospitalisation rate; females had substantially lower hospitalisation rates than males. Age, helmet legislation and cycling mode share were not related to hospitalisation rate.
ORs (95% confidence limits) for associations between various characteristics and hospitalisation rates for injuries to any body region and injuries to the brain, head, scalp, skull or face, for all injury causes and traffic-related injury causes
For traffic-related injury hospitalisations, sex was not available as a variable (table 4). A significant association was observed for injuries to any body region and cycling mode share. Higher cycling mode share was associated with lower hospitalisation rates. A nearly identical association between hospitalisation rates and mode share was observed for injuries to the brain, head, scalp, skull or face. Neither helmet legislation nor age was associated with traffic-related hospitalisation rates.
In separate models for each body region group expected to be impacted by helmets (brain, head, scalp, skull or face; brain; head, scalp or skull; face; neck), helmet legislation was not associated with hospitalisation rates. To check whether the absence of associations between helmet laws and hospitalisation rates might be an artefact of municipal helmet by-laws in jurisdictions without helmet legislation (table 3), models were rerun to examine the relationships between hospitalisation rates and the proportions using helmets in study strata. Coefficients were all positive—opposite to expectation.
Discussion
In Canada during the study period, the 3690 annual hospitalisations for bicycling injuries among youths and adults were mainly among males (76%). Most (51%) were traffic related (on public roads) but only 18% resulted from collisions with motor vehicles. Chen et al32 described 70 000 emergency department visits for bicycling injuries in the USA from 2001 to 2008. The most injured body parts were similar to those observed in our study: 70% the torso or extremities; 16% the face; and 13% the head. Similar to our results, most injuries were to males (73%) and slightly more than half of the cases were injured on roads (56%), but a much higher proportion resulted from collisions with motor vehicles (58%).32
We calculated a hospitalisation rate for all injury causes of 622 per 100 million trips, or 1 hospitalisation per 161 000 trips. We found only one other study that reported bicycling hospitalisation rates with a trip denominator. Blaizot et al33 reported a rate of 443 per 100 million trips in France, using data from a road trauma registry and a trip diary survey. Beck et al34 and Teschke et al35 calculated police-reported injury rates of 1461 and 1398 per 100 million trips in the USA and Canada, respectively. These included injuries not requiring hospitalisation, but most likely included only injuries incurred in motor vehicle collisions.
The main purpose of this study was to calculate exposure-based injury rates in Canadian provinces and territories and to examine whether they were related to differences in helmet legislation and cycling mode shares. Hospitalisation rates per 100 million trips varied substantially across the jurisdiction, age and sex strata examined, but only two characteristics explained any of this variability.
For all injury causes, sex was the only significant explanatory variable. Females had lower hospitalisation rates than males. Lower bicycling injury and fatality rates for females has been shown elsewhere,34 ,36–38 though not always.33 ,38 A pattern of lower injury and fatality rates for females has been observed in other transport modes including driving34 ,36 and walking33 ,34 ,36 and is often attributed to a lower propensity for risk-taking. For example, research shows that women are less likely than men to ride on major city streets or rural roads without bike facilities, infrastructure that has been shown to have higher injury risk.16 ,39–41 Other lower risk behaviours of females include slower riding,16 ,39 ,40 and less participation in sport cycling (eg, mountain biking).42 In our study, in most strata, females had a somewhat higher helmet use proportion, but this variable was not associated with lower hospitalisation rates. The only other demographic variable we examined, age group, was not significantly associated with hospitalisation rates in our study. Other studies do not show consistent patterns with age.33 ,34 ,36 ,37
For traffic-related injury causes, cycling mode share was the only explanatory variable (sex not available for modelling). It was negatively associated with hospitalisation rate, significantly so for injuries to any body region (in simple and multiple regression) and to the brain, head, scalp, skull or face (in simple regression). This association is consistent with observations in other jurisdictions: with higher mode shares, injury and fatality rates are lower.18–20 The “safety-in-numbers” association has also been observed for walking.18 ,19 The causal pathway of this association is not established and is likely to be multifactorial and complex. Arguments have been made that more cyclists make drivers more alert to them, and more cycling means less motor vehicle traffic.18–21 It is also possible that the relationship is in the opposite direction, for example, safer infrastructure results in more bicycling. There is consistent evidence that safer bicycling infrastructure attracts more people to use it.43 ,44 This may result in a virtuous circle, if more cyclists mean a larger constituency calling for further safety improvements.
In our study, the safety-in-numbers association was not observed for all injury causes. This may be because all causes included injuries incurred during transport cycling and sport cycling. In some Canadian provinces, mountain biking is a popular sport that involves riding on steep slopes, through densely wooded trails, and jumping obstacles and cliffs. It involves considerably higher injury risk than transport cycling.45 Two Canadian studies reported that 19% and 38% of all serious injuries were incurred during mountain biking (study hospitals were in Alberta and British Columbia, respectively).42 ,46 These injuries would not be expected to be related to transport cycling mode share. This may in part explain the very different pattern of hospitalisation rates by mode share for all injury causes versus traffic injury causes (figure 3). Particularly notable is the change for British Columbia—this jurisdiction has the highest commuter cycling mode share and is also renowned for its mountain biking terrain.
Helmet legislation was not associated with hospitalisation rates for all injury or traffic-related injury causes. We separately examined potential associations for each body region expected to be protected by helmet use (brain, head, scalp, skull or face; brain; head, scalp or skull; face) as well as for the neck which, in some studies, has had elevated odds of injury with helmet use.7 ,8 There was variation in helmet use with helmet legislation, and this may have been related to municipal by-laws mandating helmet use within some provinces or territories without helmet laws (table 3). We therefore also examined the relationship between hospitalisation rates and helmet use proportions in the strata, and again did not find the expected protective effect. Studies among those injured in a cycling crash consistently show lower odds of head, brain or face injuries among those who wore a helmet,7 ,8 though the potential for uncontrolled confounding in observational studies of a health behaviour suggests that confidence in the effect estimates should not be unquestioning.47 Before–after studies of the impact of helmet legislation have shown weaker and less consistent effects. Some have found reductions in brain or head injuries of 8–29% related to legislation,10–13 whereas others have found no effect for some or all outcomes.9 ,11 ,13 Differences may be attributable to study design features including location, the selection of a control group unexposed to helmet legislation, whether baseline trends in injury rates were modelled, and whether surrogates were used for cycling rates and if so, which ones. Our study compared bicycling hospitalisation rates across jurisdictions rather than within a jurisdiction before and after legislation, and used exposure-based denominators to control for differences in cycling rates.
Our study is the first to examine exposure-based injury rates between jurisdictions within a single country with similar transportation cultures but different helmet laws. The fact that we did not find an effect of helmet legislation for injuries to any body region is not surprising, since most injuries were not head injuries. Even studies of helmet use have not found an effect for serious injuries to any body region.48 After a crash, injuries to the torso, extremities and neck cannot be mitigated by a helmet, and injuries to these body regions were incurred in 87% of the hospitalisations in this study. The lack of a protective effect of legislation on brain and head injury rates is more unexpected. Helmet legislation in Canada has resulted in higher helmet use, so this cannot explain the results. The difference in helmet use proportions was not 100% vs 0% (ie, yes vs no, as in helmet use studies), but on average ∼67% where helmet laws apply versus ∼39% where they do not. This narrower difference would suggest a lesser impact of helmet legislation than individual helmet use, but not the results we found: effect estimates for helmet legislation were most often opposite to expectation or close to the null. These results also indicate that insufficient power is not an explanation. Perhaps helmet laws simply influence injury severity, shifting the injury burden from deaths to hospitalisations. Our data included deaths after admission to hospital (estimated to be about 0.4% of all hospitalisations9 or 15 per year in our data set). Although deaths prior to admission were not included in our data, bicycling deaths are rare—those involving motor vehicles averaged 57 per year in the study period49—and unlikely to have an impact on our results, given the 3690 hospitalisations per year. A potential explanation for the lack of an effect of helmet legislation is that our study examined injury risk, including both the chance of being in a crash, as well as the chance that the crash caused a head injury. Helmets are designed to reduce the latter. But what about the effect of helmet use or legislation on the chance of being in a crash? This has been the basis for a great deal of debate, for example, if helmet legislation discourages cycling and the causal pathway of “safety in numbers”, at least in part, is from numbers to safety, then injury risk may rise with reduced cycling.10 ,19 Others have considered the impact of helmet use on risk-related behaviours. Such studies are not always consistent, but some have findings that could help explain our results. For example, one study found that new male (but not female) helmet users tended to increase their cycling speed and one found that drivers approached a cyclist more closely when he was wearing a helmet.50 ,51
In our view, the most important implication of our results is that factors other than helmet legislation influenced bicycling hospitalisation rates, whereas helmet legislation did not. Females had lower rates in our study and they have been shown to cycle more slowly, and to choose routes on quiet streets and with bike-specific infrastructure.16 ,39–41 We also found lower traffic-related hospitalisation rates with higher cycling mode shares. Here too there is a reasonable link to safer bicycling infrastructure, since it has been shown to draw more people to bicycling.43 ,44
Strengths and limitations
The main strength of this study is comparison of injury rates calculated using the same data sources in all jurisdictions for the numerator (hospitalisations) and denominator (bicycling trips). International comparisons of injury rates are much more difficult because of uncertainty in the comparability of each of these components.
The injury data set was a full enumeration of inpatient discharge data from all acute care hospitals in the country. These injuries required a hospital stay, so the study focus was more serious cycling injuries. The coding of injury causes did not allow separation of transport and sport cycling, but it did allow identification of the subset of traffic-related injuries. This subset is defined as injuries on public roads, the same locations to which provincial helmet legislation applies.
Bicycling trip data were derived from large surveys conducted by Statistics Canada, with a sampling design that covers the full year and thus every season. Its main limitations are that it asks each respondent to recall a 3-month period and asks about “times” bicycling rather than trips. Unlike Canada, many countries conduct national trip diary surveys that query transport behaviour over a period of 1 week or less, and provide careful definitions of a trip.34–37 Although the denominator data available in Canada are less ideal, this study is notable in that it is one of a few34–38 to provide exposure-based bicycling injury rates. The bicycling data from the CCHS covered leisure trips and trips to work or school. This should include cycling for sport and for transport, therefore providing an appropriate exposure denominator for hospitalisations for all injury causes. For traffic-related injuries, there was no clearly parallel bicycling exposure definition. We chose to restrict the denominator for these hospitalisations to work and school commute cycling trips since they are very likely to require use of public roads. It is reasonable to expect that some unknown proportion of leisure trips will also use public roads, so our absolute estimates of traffic-related hospitalisation rates are overestimates. The rates we calculated for traffic-related injuries were much higher than for all injuries, opposite to what Palmer et al45 found in a study that had complete denominator data for sport and transport cycling. We were interested in comparing rates within traffic-related injury strata, rather than comparing rates for all injuries to traffic-related injuries, and for this purpose we believe our choice of denominator was reasonable.
The 6 years of numerator and denominator data did not match perfectly on the temporal scale. Hospitalisation data compiled by the Canadian Institutes for Health Information are provided by all Canadian hospitals for a fiscal year starting in April rather than a calendar year; this created a 3-month discrepancy at either end of the 6-year study period (6 of 72 months). In addition, prior to 2007, the CCHS data were collected during 1 year biennially, so leisure trips for 2006 were estimated from the 2005 data collection meant to represent that 2-year period. Work and school trip data were not collected in the CCHS prior to 2007, so 2007 data were used to estimate these 2006 trips. Differences in the number of trips by survey period did not suggest a temporal trend and were small, especially compared with the large differences in bicycling trips between the age, sex and jurisdiction strata. We pooled 6 years of numerator data and 6 years of denominator data to calculate the hospitalisation rates and feel that these provided reasonable estimates, despite the partial temporal mismatch.
Conclusions
In our study comparing exposure-based injury rates in 11 Canadian jurisdictions, we found that females had lower hospitalisation rates than males. This difference in injury rates is consistent with other bicycling studies and studies of other transportation modes. We found that lower rates of traffic-related injuries were associated with higher cycling mode shares, a finding also reported elsewhere. We did not find a relationship between injury rates and helmet legislation.
These results suggest that policymakers interested in reducing bicycling injuries would be wise to focus on factors related to higher cycling mode shares and female cycling preferences. Bicycling infrastructure physically separated from traffic or routed along quiet streets is a promising fit for both and is associated with a lower relative risk of injury.
References
Supplementary materials
Supplementary Data
This web only file has been produced by the BMJ Publishing Group from an electronic file supplied by the author(s) and has not been edited for content.
- Data supplement 1 - Online supplement
- Data supplement 2 - Online supplement
Footnotes
Contributors KT and JD conceived the study and all the authors contributed to its design and/or interpretation. KT drafted the manuscript and all the authors participated in the revision process and have approved this submission for publication. KT and MK conducted the analyses. KT takes responsibility for the hospitalisation rate analyses and MK for the bicycling trip and helmet use analyses.
Funding This research received no specific grant from any funding agency in the public, commercial or not-for-profit sectors.
Competing interests None declared.
Provenance and peer review Not commissioned; externally peer reviewed.
Data sharing statement Hospitalisation data used in this study can be requested from the Canadian Institute for Health Information. The authors can provide the content and format of their data request. Bicycling trip data can be retrieved from the Canadian Community Health Survey public release data sets.