Article Text

Abstract
Objectives Using a prospective cohort study design, to establish the incidence and nature of time-loss injuries in English community rugby and to assess the differences between different playing levels.
Setting English community rugby clubs.
Participants Injury information for 4635 matches was collected during seasons 2009/2010 (46 clubs), 2010/2011(67 clubs) and 2011/2012 (76 clubs). Clubs were subdivided into groups A (semiprofessional), B (amateur) and C (recreational) for analysis.
Primary and secondary outcome measures Any injury resulting in 8 days or greater absence from match play was reported by injury management staff at the clubs. The primary outcome measure was injury incidence (per 1000 player match-hours) and the secondary outcome measure was severity (ie, days absence).
Results Overall match injury incidence was 16.9 injuries per 1000 player match-hours. Incidence was higher for group A (21.7; 95% CI 19.8 to 23.6) compared with group B (16.6; 95% CI 15.2 to 17.9) and C (14.2; 95% CI 13.0 to 15.5, both p<0.001). The mean time-loss was 7.6 weeks absence, with knee and shoulder injuries the most severe with mean absences of 11.6 and 9.3 weeks, respectively. Half of all injuries occurred to the lower limb, with knee and ankle joint/ligament injuries the most common diagnoses. Shoulder joint/ligament injuries were the most common and severe upper limb injuries. Contact events accounted for 80% of all injuries and tackles accounted for 50%. Running was the most common non-contact injury event, of which 56% were hamstring injuries.
Conclusions More time-loss injuries occur at higher levels of community rugby. Injury prevention strategies should focus on good technique in the tackle and conditioning exercises for the knee, ankle, hamstrings and shoulder.
- EPIDEMIOLOGY
- SPORTS MEDICINE
- Sports Injury
This is an Open Access article distributed in accordance with the Creative Commons Attribution Non Commercial (CC BY-NC 3.0) license, which permits others to distribute, remix, adapt, build upon this work non-commercially, and license their derivative works on different terms, provided the original work is properly cited and the use is non-commercial. See: http://creativecommons.org/licenses/by-nc/3.0/
Statistics from Altmetric.com
Strengths and limitations of this study
-
This is the largest prospective cohort study of injuries in community level rugby union.
-
Definitions are consistent with appropriate consensus documents allowing comparison of data from this study with studies of other levels of rugby (eg, elite/professional, youth).
-
Exposure is not individually calculated, but is based on 15 players being on the pitch for all minutes of all matches.
-
The resolution of severity reporting is 8 days rather than 1 day due to the nature of the community rugby environment.
Rugby union is one of the world's most popular sports and the playing population in England is the largest of all rugby playing countries. In common with other full-contact sports, rugby union is characterised by opposing players engaging in frequent physical confrontations as well as high-intensity running. As a result, rugby union has a relatively high risk of injury compared with other team sports, but there is a growing body of literature showing that injury incidence in rugby union1–8 is similar to that of other full contact sports such as rugby league,9 American football10 and Australian Rules Football.11
Research to date has focused primarily on international,2–4 professional1 ,7 and youth12 ,13 rugby union. However, the vast majority of male senior rugby players participate at the community level. There is limited information specific to community rugby union8 ,14 and because injury incidence has been shown to increase with competitive level15 ,16 it cannot be assumed that incidence and types of injury in the elite game are representative of those in the community game. Differing physical and skill attributes of professional full-time players compared with part-time semiprofessional and amateur players likely impact on the physical demands of the game and subsequently injury frequency, type and severity at the different levels of match play. In addition, elite-level players are likely to have greater access to medical support following an injury, likely influencing the management of, and subsequent time loss due to, a given injury. Of course, within the community game there is a range of playing standards and for the reasons described above there are likely to be differences in injury risk between those in higher versus lower leagues.
The aim of this study was to describe the nature of injuries resulting from match play within English community rugby union, including a comparison between different levels of play. Outcome measures included the match injury incidence, severity, type and match events associated with injuries.
Methods
Participants
Senior male first team squads at English community-level clubs participating in the Rugby Football Union (RFU) league structure within playing levels 3–9 were invited to participate in the study, which was conducted over three seasons (2009/2010, n=46 (61 clubs at start of season); 2010/2011, n=67 (90 clubs at start of season); 2011/2012, n=76 clubs (104 clubs at start of season)). To facilitate comparisons across playing levels, clubs were classified as group A (RFU levels 3 and 4; highest level of English community rugby with many semiprofessional players), group B (levels 5 and 6; mainly amateur clubs) and group C (levels 7, 8 and 9; mainly recreational and social clubs). It is accepted that these definitions are approximate and there will be varied practice/approaches across clubs. Having been provided with information about the study, individual players could opt-out from participation by informing club medical staff who omitted information on that player.
Injury management staff (holding an accredited sports therapist qualification as a minimum) at participating clubs completed and returned injury forms. Any injury incurred during a first team match resulting in an absence from participation in match play for 1 week or more from the day of the injury was defined as a ‘time-loss’ injury. The date of the match on which the player was fit for selection was recorded as the return to play date, and injury severity was defined by the number of weeks missed. Therefore, the least severe injuries are ‘moderate’ (8–28 days absence) according to the International Rugby Board (IRB) consensus statement for injury definitions.17
For all time-loss injuries, information was recorded on the type, injury event, treatment, time of injury and severity (number of weeks missed through injury) using a standard report form. Details on the type of injury were recorded using the Orchard Sports Injury Classification System V.818 by the injury management personnel in discussion with the player with regard to the inciting event. For 1.5% of all injuries, the inciting event was unknown. Only injuries incurred during match play at the participating clubs were recorded and therefore absences from match play due to illness or injuries incurred through any other activity (including rugby training) were not included.
Data analysis
Playing positions were grouped as forwards and backs, then subdivided into front row (props and hooker), second row, back row (flankers and No. 8), scrum halves, inside backs (fly half and centres) and outside backs (wingers and full backs). Data are combined for all seasons. Injury incidence was recorded as the number of injuries/1000 player-hours of match exposure. Player-hours of match exposure was calculated by the number of matches×number of players per team×match duration (hours), and it was assumed for the purpose of the exposure calculations that no players have opted out from participation. Logistic regression was used to obtain rates of injuries with 95% CI. Significant differences in rates of injuries due to groups, levels, positions and injury type was assessed by comparing the fit (via changes in deviance) of a series of models.19 Differences were deemed statistically significant if p<0.05.
Results
Overall incidence and severity
Total match exposure, injury incidence and incidence for moderate and severe injuries are shown in table 1. Overall match injury incidence was 16.9 injuries per 1000 player match-hours. Incidence was higher for group A (21.7; 95% CI 19.8 to 23.6) compared with group B (16.6; 95% CI 15.2 to 17.9) and C (14.2; 95% CI 13.0 to 15.5, both p<0.001) and higher for group B than group C (p<0.05). No fatal or catastrophic injuries were reported. Mean number of weeks missed per injury for all levels combined was 7.6 (95% CI 7.2 to 8.0) and was not different between groups A (7.5; 95% CI 6.8 to 8.2), B (7.9; 95% CI 7.3 to 8.5) and C (7.2; 95% CI 6.6 to 7.8).
Match exposure, overall injury incidence and injury incidence for moderate (8–28 days) and severe (>28 days) injuries for all groups combined and each playing group
Injury site
Injury incidence in the lower limb was higher as compared to other body regions and also higher for group A compared with group B (p=0.003) and group C (p<0.001; figure 1). When considering specific body sites, knee injuries resulted in the highest injury incidence and greatest number of weeks missed (table 2). There were also significant differences in the rates by site between forwards and backs (p<0.001), with significantly more thigh injuries in backs than forwards (p=0.004), and higher incidence of head/neck injuries in forwards (3.0; 95% CI 2.5 to 3.5) as compared to backs (2.2; 95% CI 1.8 to 2.7; p=0.012).
Injury incidence for top 10 injury sites for all groups and mean weeks missed (95% CI)
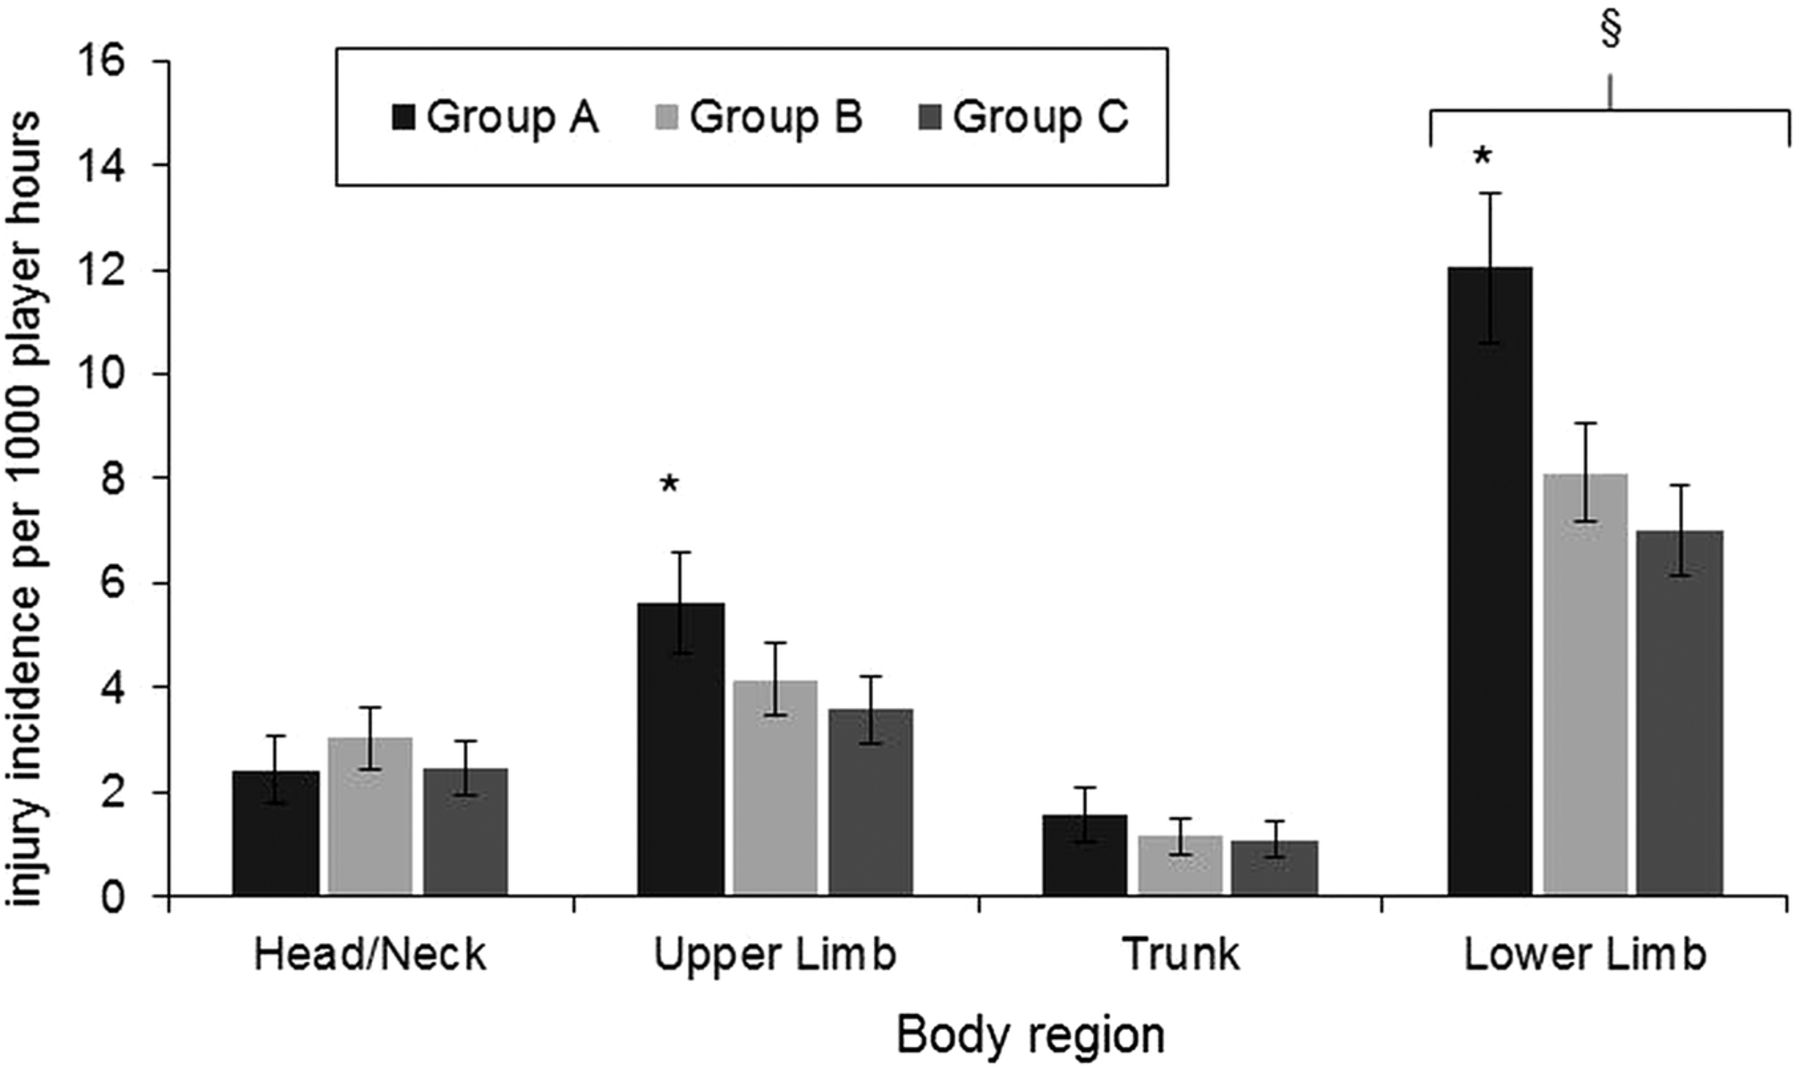
Injury incidence of all groups by body region. *Significantly higher injury incidence in group A compared with groups B and C. §Significantly higher incidence in the lower limb compared with all other body regions.
Injury type
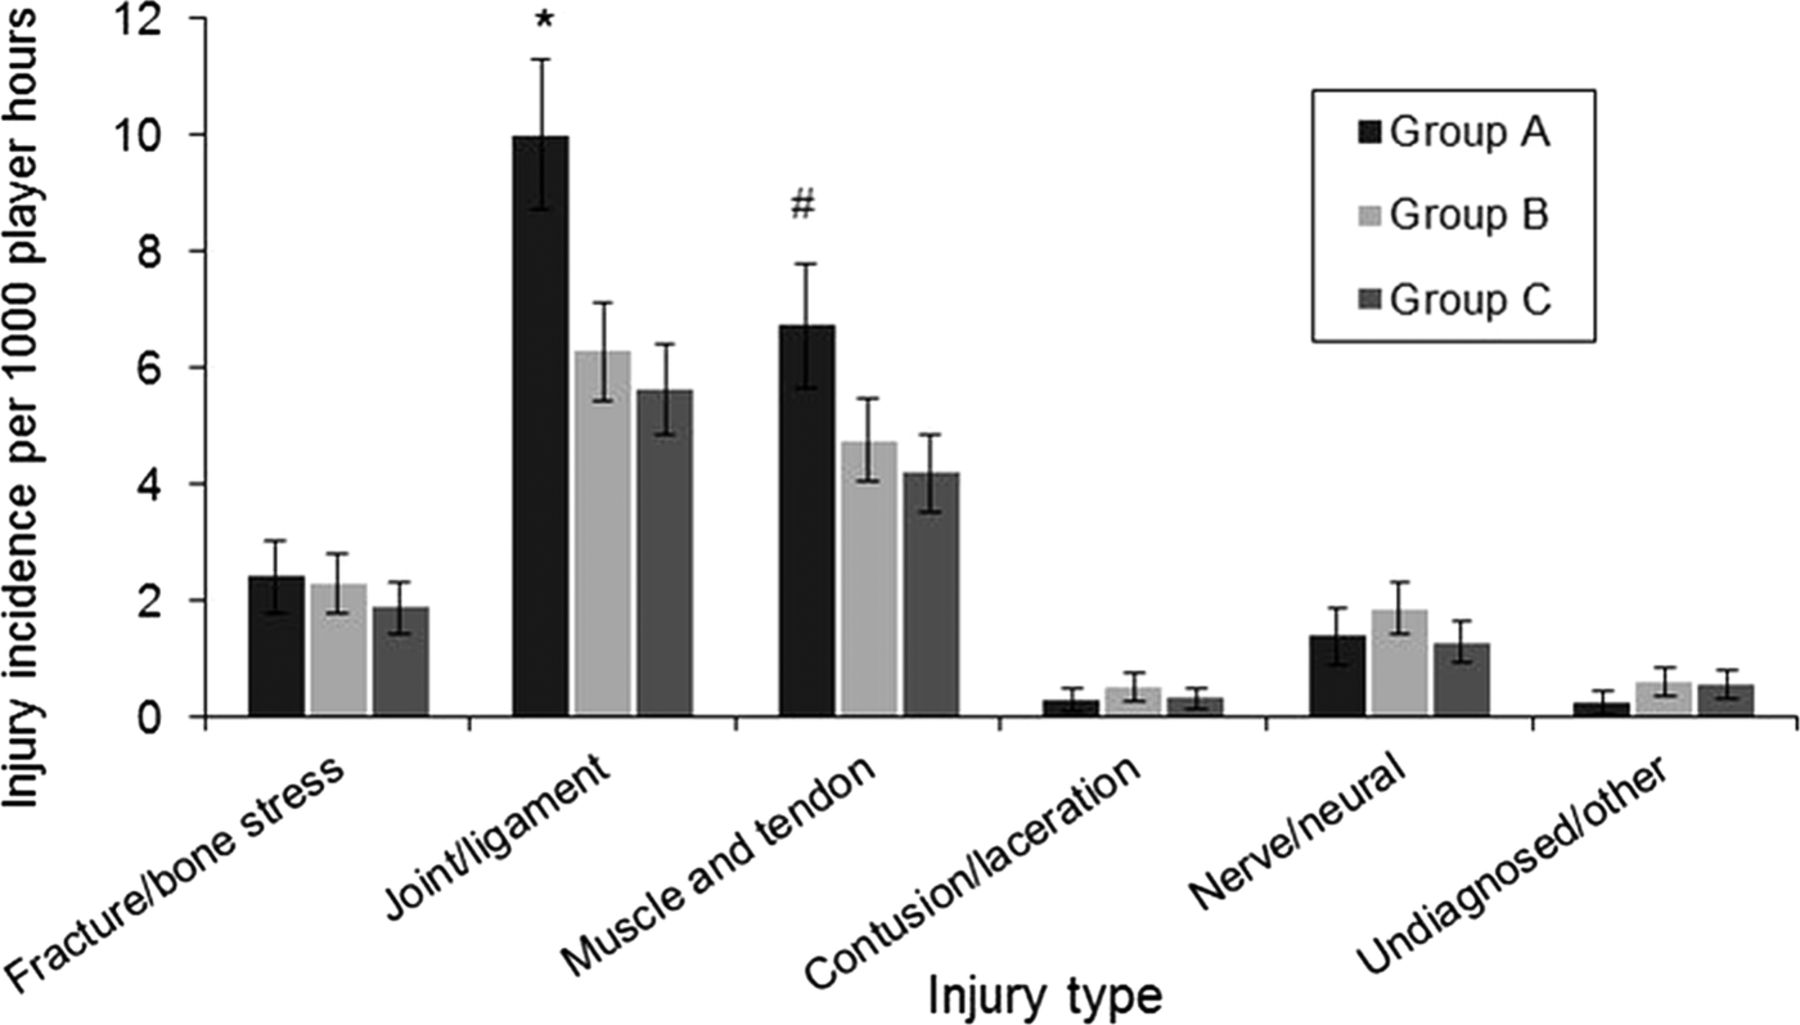
There was a higher incidence of joint/ligament injuries in group A compared to groups B and C and more muscle and tendon injuries in group A compared with group C (figure 2). For all groups the most severe injuries were fracture/bone stress (11.2 weeks absence), joint/ligament (9 weeks absence) and muscle and tendon injuries (5.8 weeks absence). The top five specific injuries in terms of incidence with their severity for all groups combined are shown in table 3.
Top five specific injuries according to injury incidence (95% CI)

Injury incidence of all groups by injury type. *Significantly higher injury incidence in group A compared with groups B and C; #significantly higher injury incidence in group A compared with group C.
Injury event
Contact events accounted for 80% of all injuries, and had a higher injury rate as compared to non-contact injuries (p<0.001). An interaction (p=0.006) revealed a higher rate of contact injuries in group A (17.7; 95% CI 16.0 to 17.4) than in groups B (12.7; 95% CI 11.5 to 13.9) and C (11.1; 95% CI 10.0 to 12.2). There was a significant interaction (p<0.001) indicating forwards to have higher overall incidence of contact injuries compared with backs and significantly higher rates in the ruck (p=0.017) as compared to backs, who in turn had a higher rate of injury in the tackle (p=0.029).
For all groups the tackle was the most prevalent injury event with a higher incidence for the ball carrier (4.8; 95% CI 4.3 to 5.2) as compared to the tackler (3.6; 95% CI 3.2 to 4.0; p<0.001; figure 3). Tackle injury incidence was higher for the ball carrier for backs (6.2; 95% CI 5.5 to 7.0) as compared to forwards (4.5; 95% CI 3.9 to 5.1; p<0.001) but not different for the tackler. Tacklers sustained 76% of injuries to the head/neck and upper limb, while 61% of ball carrier injuries were to the trunk and lower limb. Tackle events also resulted in a higher severity compared with all other contact events except the lineout (figure 3).

Representation of relative magnitude of injury incidence and severity (matches missed) for different injury events (all groups combined). Vertical and horizontal bars represent 95% CIs for severity and incidence, respectively.
Running was the most common non-contact injury event (10% of all injuries) with a higher incidence than twisting/turning injuries (p<0.001; figure 3). A significant interaction (p<0.001) revealed forwards to experience a lower overall incidence of non-contact events than backs but a higher rate of twisting/turning injuries. Hamstring injuries accounted for 54% of all running injuries, and there was a higher incidence for backs (1.4; 95% CI 1.1 to 1.8) as compared to forwards (0.5; 95% CI 0.3 to 0.7). For all players combined, there was a higher hamstring injury incidence in the first match quarter (1.9; 95% CI 1.4 to 2.5) as compared to the third (1.1; 95% CI 0.7 to 1.6; p=0.026).
Recurrences
For all groups combined, 18% of injuries were recurrences of previous injuries with no difference in the mean severity (8 weeks; 95% CI 7.1 to 8.9) as compared to non-recurrent injuries (7.5 weeks missed; 95% CI 7.1 to 7.9). There was a higher incidence of recurrent injuries in group A (4.3; 95% CI 3.5 to 5.2) compared with groups B (3.1; 95% CI 2.5 to 3.6; p=0.016) and C (2.2; 95% CI 1.7 to 2.7; p<0.001) and group B compared with group C (p=0.021).
Playing position
There was no overall difference in injury incidence between forwards (17.3; 95% CI 16.1 to 18.5) and backs (16.5; 95% CI 15.2 to 17.7; p=0.310) but there was a higher incidence for back row forwards (20.4; 95% CI 18.3 to 22.4) as compared to outside backs (16.0; 95% CI 14.2 to 17.8; p=0.002), second row (14.5; 95% CI 12.4 to 16.6; p<0.001) and front row forwards (16.1; 95% CI 14.2 to 17.9; p=0.002; figure 4). A significant interaction (p=0.009) revealed higher injury incidence for forwards as compared to backs within groups B and C but lower in group A. When comparing between playing levels, there was a lower injury rate for group C forwards (14.9; 95% CI 13.2 to 16.6) as compared to groups A (19.7; 95% CI 17.2 to 22.3; p=0.002) and B (18.2; 95% CI 16.2 to 20.1; p=0.005) and a higher injury rate for group A backs (24.0; 95% CI 21.0 to 26.9) compared with groups B (14.7; 95% CI 12.8 to 16.5; p<0.001) and C (13.4; 95% CI 11.6 to 15.2; p<0.001). In group A, injury incidence was higher for inside and outside backs compared with groups B (p=0.008) and C (p=0.040).

Representation of relative magnitude of injury incidence and severity for different playing positions (all groups combined). Vertical and horizontal bars represent 95% CIs for severity and incidence, respectively.
Timing
Overall, injury incidence was lower in the first match quarter compared with all others (p<0.001) and in the second match quarter compared with the fourth (p=0.018). For all groups combined, there was a higher injury incidence during September and October (first quarter of season) as compared to all other months (p<0.001).
Discussion
We performed the largest study of time-loss injuries in community level rugby. We demonstrated that within the community game, injury incidence decreased with decreasing level of play. Contact events were associated with 80% of all time-loss injuries, the majority of which occurred in the tackle while most non-contact injuries were hamstring strains sustained while running. There was no difference in injury rates between forward and backs, but back row forwards showed a higher injury rate as compared to front row forwards, second row forwards and outside backs.
Incidence of time-loss injuries (at least moderate severity according to the IRB consensus statement)17 in the current study (16.6 injuries per 1000 player-hours) is lower than that of the English Premiership1 (48 injuries per 1000 player-hours). However, the incidence of 21.7 injuries per 1000 player-hours in the highest playing level (group A) in the current study is similar to the 25 injuries per 1000 player-hours for the same injury definition at the highest levels of New Zealand community club rugby (Premier grade).8 The greater incidence of time-loss injuries in higher level clubs in the current study supports the findings of previous studies that injury incidence increases at higher playing levels.15 ,16 Such differences have been suggested to be associated with greater match play intensity, skill and fitness attributes15 resulting in different match play demands comprising more contact events per match with potentially higher energy transfer in impacts. However, it has not yet been demonstrated whether there are more contact events in higher levels of community level match play and whether injury risk per individual contact event differs.
Most time-loss injuries occurred to the lower limb, which is consistent with findings from the majority of the rugby injury literature.4 ,5 ,14–16 The most prevalent of these were ligament/joint injuries to the knee and ankle, with knee injuries resulting in the longest absence from playing and consequently the greatest total number of weeks missed compared with other body sites. The lower limb was the only body region where there was a higher injury incidence in group A compared with groups B and C, with higher injury incidence across the thigh, knee and ankle. Studies which include less severe injuries within their injury definition criteria, for example, including minor medical attendances, commonly report highest incidence for bruising/haematoma injuries.4 ,8
The prominent event associated with injury in the current study is the tackle, which is consistent with the findings of rugby injury epidemiology studies across a range of playing levels.5–8 While the tackled player (ball carrier) sustained the higher proportion of tackle injuries in the current study, more injuries occurred to the tackler in New Zealand premier grade rugby8 with another study finding no difference between the ball carrier and tackler players.15 It might be anticipated that players at a higher level would have greater technical expertise in the tackle, but the injury incidence for this event was higher in group A clubs as compared to groups B and C. In any case, tackling proficiency was not associated with injury risk in professional rugby league players.20 This suggests that any superior technique and/or physical strength may be offset by greater collision speeds and energy transfer in the contact or indeed by a greater exposure to tackle events. Irrespective, injury prevention measures should focus on both the coaching of technique in contact (primarily the tackle and ruck). Furthermore, whether exercises designed to improve neuromuscular function in the stabilising muscles crossing body joints impacts on contact injury incidence should be explored.
Compared with the tackle, there was a relatively low injury incidence in the scrum and lineout which may be due to lower velocity impacts and the players having more time to prepare in the moments before making contact. In contrast, tackles made in open play represent a less predictable skill with less reaction time for players before contact. Moreover, the greater number of injuries incurred during the tackle and ruck could be due to a higher number of these events during match play. A study of contact events in English Premiership rugby demonstrated that the majority of injuries were sustained in the tackle but only because this was the most prevalent match event and the injury risk per contact event was greatest for the scrum and collisions.21 To date, risk per contact event has not been investigated in community rugby.
Hamstring strains were the most common non-contact injury type. The higher incidence in backs compared with forwards could be due to the greater sprint and high-intensity running loads (and therefore higher deceleration loads) undertaken by this positional group.22 ,23 Most hamstring injuries were sustained in the first match quarter, indicating that an appropriate prematch warm-up may be particularly important. Strategies to reduce hamstring injuries should be given particular consideration as these injuries are likely to be influenced by intrinsic factors, which are potentially modifiable with appropriate training interventions24 and match warm-up exercises.
Concussions accounted for 50% of all head injuries and 7% of all injuries, which is comparable with the English Premiership (7%),1 New Zealand premier (6%)8 and New Zealand community (8%)14 rugby. However, the incidence rate of 1.2 injuries per 1000 player-hours, is lower than in English Premiership rugby (4.1 injuries per 1000 player-hours) and the highest level of community rugby in New Zealand8 (2.9 injuries per 1000 player-hours). Concussion injuries may be under-reported in prospective injury surveillance studies due to lack of expertise in diagnosing the injury and attempts to avoid mandatory stand-down periods14 ,25 by not complying to the return to play guidelines.25 ,26 However, in the current study, a mean of 3.4 weeks (median of 3 weeks) were missed for a concussion, which suggests reasonable adherence to the IRB guidelines during the period of this study of a mandatory 3 weeks stand down before return to play for concussions where the return to play process is not fully managed by a medical practitioner (doctor)/health professional.27 This severity is greater than the 13 days reported for English Premiership rugby,25 but under IRB guidelines, elite players with access to appropriate medical support can complete an accelerated graduated return to play within 7 days.
In the current study, injury incidence was higher in the earlier phase of the season. This bias is demonstrated in other community rugby studies8 ,14 ,28 and while it has been suggested that ground hardness may underpin this finding,29 this has not been substantiated.30 Another potential explanation is a survival effect whereby players prone to injury are injured earlier in the season thus reducing their match exposure for further injury,30 while there is also the possibility that community level rugby players are not sufficiently prepared at the beginning of the season for competitive match play.
Conclusion
This study provides the first detailed information on the nature of injuries in English community senior-level rugby union match play. While the findings show that overall injury incidence is lower than elite level, there is a progressively higher incidence in higher standards of community rugby. The tackle is the main event associated with injury, while the greatest overall injury time-loss through a combination of severity and incidence is from injuries to the lower limb, notably for knee ligament joint/injuries. Injury prevention strategies for the community game should focus on coach and player education around the tackle event, and exercises that can improve the function of the lower limb and shoulder.
Acknowledgments
The authors would like to sincerely thank injury management staff at all English community clubs who participated in this study.
References
Footnotes
-
Contributors SPR, KAS, GT and ME conceived and designed the study. SPR collected the data and wrote the first draft of the manuscript. SPR, GS, KAS and GT analysed the data. SPR, KAS, GT, ME and GS provided substantial contributions to the redrafting of the manuscript. All authors read and approved the final version of the manuscript.
-
Funding The Rugby Football Union (RFU) Injured Players Foundation (IPF).
-
Competing interests None.
-
Ethics approval Research Ethics Advisory Committee for Health, University of Bath.
-
Provenance and peer review Not commissioned; externally peer reviewed.
-
Data sharing statement No additional data are available.