Article Text

Abstract
Background Electrically assisted bicycles (e-bikes) have become increasingly popular and may facilitate active commuting and recreational cycling.
Objective To evaluate the physical activity levels and usage characteristics of e-bikers and conventional cyclists under real-world conditions.
Methods We conducted a prospective observational study in Germany to examine the effects of e-biking compared with conventional cycling on reaching the World Health Organization (WHO) target for physical activity—at least 150 min of moderate-to-vigorous physical activity (MVPA) per week. Study participants (1250 e-bikers and 629 conventional bike users) were equipped with activity trackers to assess the time, distance and heart rate during cycling over four consecutive weeks. Questionnaires were used to assess any traffic accidents incurred over 12 months.
Results The proportion of participants reaching 150 min of MVPA per week was higher for conventional bike users than for e-bike users (35.0% vs 22.4%, p<0.001). In a multiple regression model, the odds of reaching the physical activity target were lower for e-biking than for conventional biking (OR=0.56; 95% CI 0.43 to 0.72) with age, sex, comorbidities and bike usage patterns as confounding factors. No significant differences were observed between bike groups for traffic accidents, yet when controlled for cycling time and frequency of cycling e-bikers had a higher risk of a traffic accident (OR=1.63; 95% CI 1.02 to 2.58).
Conclusion E-bikes are associated with a lower probability of reaching WHO targets for MVPA due to reduced duration and a reduced cardiovascular effort during riding. However, e-bikes might facilitate active transportation, particularly in older individuals or those with pre-existing conditions.
- physical activity
- accelerometer
- prevention
- environment
- cycling
Data availability statement
Data are available upon reasonable request. Data will be shared with researchers who provide a methodologically sound proposal to achieve aims in the approved proposal. Proposals should be directed to sportmedizin@mh-hannover.de to gain access, data requestors will need to sign a data access agreement.
This is an open access article distributed in accordance with the Creative Commons Attribution Non Commercial (CC BY-NC 4.0) license, which permits others to distribute, remix, adapt, build upon this work non-commercially, and license their derivative works on different terms, provided the original work is properly cited, appropriate credit is given, any changes made indicated, and the use is non-commercial. See: http://creativecommons.org/licenses/by-nc/4.0/.
Statistics from Altmetric.com
WHAT IS ALREADY KNOWN ON THIS TOPIC
Electrically assisted bicycles may help to increase physical activity, yet data on usage in everyday life and the intensity of e-biking are limited and inconclusive.
WHAT THIS STUDY ADDS
E-bikers generally cycled less frequently, for a shorter overall duration and at lower intensities than conventional bike users.
E-bikers used their bikes mainly to alleviate physical strain during cycling and promote health. They were more likely than conventional bike users to replace their cars with e-bikes for different journeys.
The risk for road traffic accidents and near-accidents was similar between bike groups.
HOW THIS STUDY MIGHT AFFECT RESEARCH, PRACTICE OR POLICY
In general, the expected health effects of cycling might be higher for bicycle users than for e-bike users. Yet, e-bikes might enable regular cycling for individuals who are limited by age- or illness-associated constrictions and would not otherwise consider conventional cycling.
Introduction
Tackling climate change is a major public health issue of the present day. In this context, facilitating electromobility has become a key political objective.1 Bicycles that provide electric assistance only when the rider pedals (e-bikes) have become increasingly popular in recent years. Around 3.4 million e-bikes were sold in the European Union in 2019, compared with only 98 000 in 2006.2 This number is expected to increase further to 62 million by 2030.1 A similarly rapid increase throughout Europe is also anticipated in Asia and the USA.3 4
E-bikes and other forms of electromobility are connected with the hope of partly replacing CO2-emitting vehicles and contributing to reduced car traffic and congestion.5 In addition to this potential ecological and infrastructural impact, e-bikes may promote active commuting and recreational cycling,5 6 and thereby help to reduce physical inactivity, a condition observed in many industrialised countries.7 Conventional cycling induces various health benefits,8 which from a public health perspective largely outweigh the risk of exposure to air pollution and traffic accidents.9 10 However, even though comparable benefits might be expected, the overall effect of e-biking might differ from traditional cycling due to the active motor support. Objectively assessed activity data from larger samples would extend already published data11 12 and help to better assess the impact of e-biking versus conventional cycling on cycling-related and overall physical activity levels. Policymakers will also benefit from further information on socioeconomic characteristics, purchase motives,13 replacement of other transport modes,14 and traffic accident rates,15 16 to assess the potential of e-bikes as an effective public health measure.
We conducted an observational study in Germany to compare the success rate of e-bike and conventional bicycle users in reaching the World Health Organization (WHO) recommendation for physical activity (150 min/week of moderate-intense physical activity or 75 min/week of vigorous-intense physical activity) using a bicycle. Furthermore, we assessed cycling-related accident rates, subject characteristics and replacement of other transport modes among e-bike users versus conventional bike users.
Methods
Study design and participants
This was a prospective observational study conducted across Germany. Between February 2017 and December 2019, 2370 volunteers registered for the study by phone, email or on the study website. Of those, 464 could not be included as they did not meet the inclusion/exclusion criteria or did not sign written consent. Of the remaining 1906 participants, 20 from the e-bike group and seven from the bicycle group could not be evaluated because of missing data. Finally, 1250 e-bikers and 629 conventional cyclists were included in the analysis.
This study was carried out following the Declaration of Helsinki. The institutional ethics review board of Hannover Medical School approved the study (No 7237), and written informed consent was obtained before the inclusion of participants.
Recruitment of participants, inclusion and exclusion criteria
To recruit participants, we provided information material to local bicycle shops across Germany cooperating with the largest bike association in Germany (bike shopping cooperative (ZEG)). In addition, the study was advertised in print media and on a specially designed website (http://www.ebike-gesundheit.de/). According to the prestudy defined criteria, we included female and male volunteers aged 18 years or older who had their main residence in Germany. Exclusion criteria were orthopaedic, cardiovascular or other diseases restricting bicycle use or participants with no access to a smartphone or computer with internet access for data transmission. Competitive cyclists were also excluded from the study. Those interested in the study could register by phone, email or directly on the study website. During registration, the following were recorded: full name, gender, contact details, type of bicycle, date of bike purchase, and the response to questions concerning the exclusion criteria.
Group allocation
After registration for the study, eligible participants were sent a declaration of consent, information on data privacy and a medical history questionnaire by post. When meeting the study criteria and signing informed consent, volunteers were included according to their bike use in the e-bike group or the conventional bike group.
Questionnaires
We distributed questionnaires for the evaluation of the health-related quality of life (Short Form 36),17 for daily physical activity (Freiburger Physical Activity questionnaire),18 as well as a medical history questionnaire, a specially designed bicycle-specific user questionnaire and an accident documentation form (for more information on questionnaires see online supplemental information).
Supplemental material
Observational period and procedures
After inclusion, participants started a consecutive 4-week observational period. All participants received an examination package consisting of the study-related questionnaires and an activity tracker (a smartwatch: Forerunner 35, Garmin, Garching, Germany) with a user manual and individual access data. The package also contained a sticker to attach to the bike to remind users to start and stop the tracking of cycling activities and a flyer with general safety information for cyclists in road traffic.
Participants were asked to record every bicycle ride by selecting and starting the bicycle profile on the smartwatch. Once started, the tracker records the riding time, the travelled distance (by GPS), and the heart rate (HR) via photoplethysmography. After stopping the cycling trip on the tracker, all activity data were saved on the tracker and transmitted to the manufacturer’s server (Garmin). Data were then extracted from the Garmin server, pseudonymised, depleted from GPS information about the exact location of the ride, and directly forwarded via an interface (API) to a server at Hannover Medical School, according to current privacy policy legislation. The resulting data were stored and analysed by the Institute of Biometry at Hannover Medical School.
The primary endpoint was the proportion of participants reaching the WHO recommendation for moderate to vigorous physical activity (MVPA) (≥150 min/week moderate intensity or ≥75 min/week vigorous intensity, or a combination of both) by cycling. Based on the recommendation of the American College of Sports Medicine (ACSM),19 moderate intensity was defined as an activity with a heart rate of 64–76% of the maximum heart rate (HRmax), and vigorous intensity as an activity with a heart rate above 77% of HRmax. The HRmax was calculated for each participant according to Whaley et al 1992,20 considering age, sex, smoking status, body weight and the resting heart rate of participants. Where not all parameters were available, the maximum heart rate was estimated by a simplified calculation (HRmax=208–0.7 x age).21 For each participant, recorded activity, moderate and vigorous intensity levels were determined at 1 s intervals. Overly long activities (>12 hours/day), very short tracked activities (<10 s) as well as activities with implausible heart rates or speed (mean heart rate ≤60 bpm or ≥200 bpm, mean speed ≤5 km/h or ≥40 km/h) were excluded from the analysis. According to the applicable WHO recommendations at the time of study initiation,22 a tracked activity was only counted as MVPA if the heart rate stayed above the lower threshold of the respective intensity level (moderate or vigorous) for at least 10 consecutive minutes. If the heart rate fell below the lower threshold for more than 1 min, we considered the preceding and subsequent physical activity to be separate activities. Vigorous activities counted double for the calculation of cycling-related MVPA minutes per week.
Statistical analysis
In the primary analysis, the difference between the study groups in reaching the success rates (cycling at least 150 min/week at MVPA) was tested by Χ²-test with a one-sided significance level of 2.5% and a non-inferiority margin of −7.5%. In addition, we performed a sensitivity analysis according to the ‘2020 WHO guidelines’23 that states that every MVPA activity counts (regardless of the criterion of at least 10 consecutive minutes). Subgroup analyses were performed for the following subgroups: sex (male/female), age (<53/≥ 53 years), comorbidities (yes/no), body mass index (<25/≥25 kg/m2), use of heart rate lowering drugs (yes/no), smoking status (yes/no), monthly net income and main purpose of use (every day use; commuting, leisure time, sports-related). Univariate binary logistic regression models were used to identify potential prognostic factors and confounders (p<0.1) influencing the success rate of reaching the physical activity target. In multiple binary logistic regression analyses, we used backward selection to drop independent variables with the highest p value until only those covariates and factors that were significantly associated with reaching the physical activity target remained in the model (p<0.05).
In secondary analyses, categorical and continuous outcomes (such as the average heart rates during cycling, the frequency of cycling (number of cycling trips per week)), and overall cycling time (all cycling activities independent of cycling intensity) were compared between the study groups with a Χ²-test and a two-sample t-test, respectively. Analyses were performed using SAS version 9.4 (SAS Institute Inc., Cary, North Carolina, USA) and R version 4.1.0 (R Foundation for Statistical Computing, Vienna, Austria). Data are given as absolute/relative frequencies per category or mean±SD
The sample size calculation was based on a previous feasibility study24 among workers from companies located in the Hannover area. The study showed that 26% of cyclists reached the WHO criteria for physical activity. With the anticipated 2:1 recruitment ratio, 1200 participants (800 e-bikers, 400 cyclists) needed to be enrolled to show non-inferiority of e-bikers compared with cyclists with a pragmatically justified non-inferiority margin of −7.5%, which was supposed to address the balance between the precision of the estimate and the ability to manage the trial. The one-sided significance level was set to 2.5% and the power to 80%. Another 200 participants were added to take account of possible dropouts, resulting in a total sample size of 1400 participants.
Results
Compared with conventional cyclists, the e-bike group was characterised by older age, body mass index (figure 1A,B), leisure time physical activity, more comorbidities, but less exercise-related physical activity (table 1). Gender distribution, total physical activity and net income (figure 1C) were not different between study groups (for more details, see table 1).

Subject characteristics and motives for bike purchase.

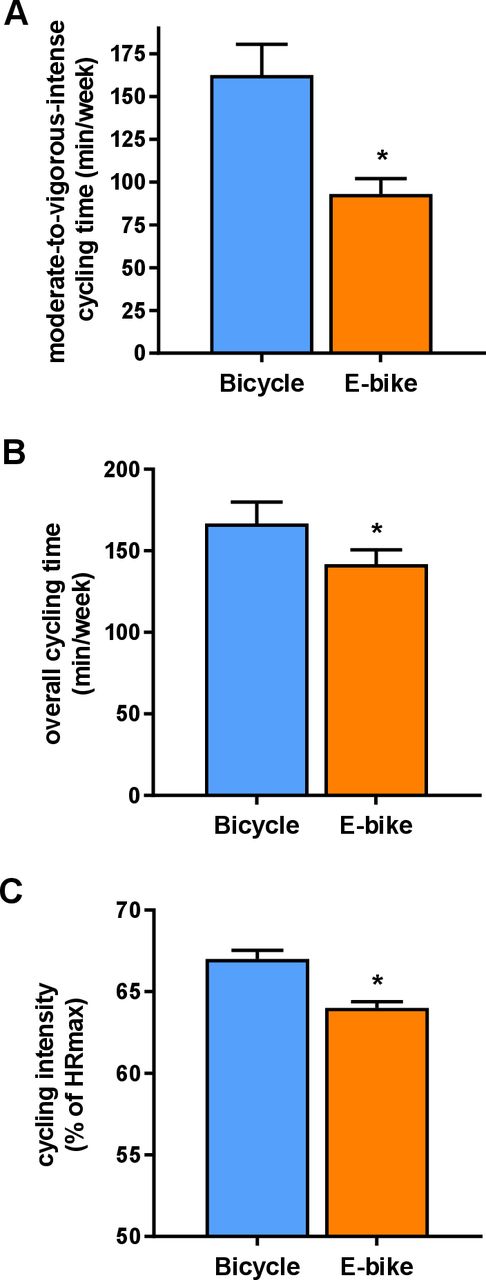
Time cycled at moderate-to-vigorous intensity. (A) Overall cycling duration per week and (B) intensity of cycling (percentage of maximum heart rate), (C) all assessed with activity trackers during the 4- week observational period. *p<0.001 between groups.
Baseline characteristics of participants
Bike usage characteristics and reaching the physical activity target
The time spent in MVPA during cycling per week was lower for the e-bike group (see figure 2A), with a mean group difference of 69.7 min/week (95% CI 52.5 to 86.8), p<0.001. A higher proportion of conventional bicycle users (35.0%) cycled 150 min or more at MVPA per week in comparison with e-bike users (22.4%) (p<0.001). When analysed as a sensitivity analysis (every MVPA cycling activity counted according to the 2020 WHO guidelines),23 the differences between cycling groups remained significant (for details, see online supplemental data). The frequency of cycling was different between groups (bicycle: 5.9±5.6 trips/week; e-bike: 3.8±4.4 trips/week; p<0.001). The overall cycling time was higher for the bicycle group (see figure 2B) with a mean group difference of 24.8 min/week (95% CI 9.0 to 40.7), p<0.001 whereas the average duration per trip was longer in the e-bike group (bicycle: 26.2±26.2 min/trip, e-bike: 32.7±35.4 min/trip; mean group difference: 6.5 min/trip (95% CI 3.4 to 9.6)) The absolute heart rate during cycling was higher in the bicycle group (bicycle: 119.3±13.7 bpm; e-bike: 111.3±13.9 bpm; mean group difference: 8.0 bpm (95% CI 6.5 to 9.5), p<0.001), as well as the relative heart rate expressed as a percentage of maximum heart rate (see figure 2C),
Prognostic factors for reaching the physical activity target
To determine prognostic factors which influence the success rate of reaching the physical activity target (150 min of MVPA per week), we included the study group (e-bike vs bicycle) and all potential prognostic factors (p<0.1) found in univariate analyses (for details see online supplemental table S1) into multiple binary logistic regression models. In the full model, the study group (e-bike vs bicycle), age (<53/≥53 years), sex (male/female), comorbidities (yes/no), and the bike usage pattern ‘sport-related use’ and ‘commuting’ turned out to be significant predictive factors for the rate of reaching the physical activity target (see online supplemental table S2). In this model, the adjusted odds of reaching 150 min of MVPA per week were lower for e-bike users than bicycle users (OR=0.56, 95% CI 0.43 to 0.72). After backward selection (subsequently dropping independent variables with the highest p value), the study group, age, sex, comorbidities and the bike usage pattern, sport-related use and commuting, remained significant (see online supplemental table S2). Goodness-of-fit for the final model was assessed using the Hosmer-Lemeshow test, indicating a good model fit, χ²(8) = 4.43, p=0.816.
When analysed within subgroups, we observed a significantly lower probability of reaching the physical activity target when using an e-bike than a conventional bicycle for all subgroups, except for subjects with heart rate lowering medication and those using the bike for sports-related purposes or leisure time activities (see figure 3).

Frequencies of participants reaching 150 min of moderate-to-vigorous intense cycling per week (in absolute numbers and per cent) for conventional cyclists and e-bikers, and the ORs (95% CI) for reaching the physical activity target when comparing electrically assisted cycling with conventional cycling. Lower ORs indicate a lower probability of e-bikers reaching the physical activity target.
Motives for bike purchase and replacement of other transport modes
The most commonly mentioned motive when asked for purchasing their bicycle or e-bike was physical fitness (figure 1D). The second most popular motive in the e-bike group was convenience (ease of cycling), which was mentioned twice as often as in the bicycle group. Reasons such as environment or cost savings played minor roles as motives for purchase (figure 1D). E-bikers replace cars more than bicycle riders, and bicycle riders replace urban transport for going to work more than e-bikers. No differences between study groups were observed for the replacement of walks with cycling (see table 2).
Replacement of other transport modes by bicycles or e-bikes
Road traffic accidents
Participants reported 272 accidents or near-accidents. Six of these had to be excluded owing to incomplete information. Overall, 109 accidents and 157 near accidents occurred during the 12-month period. There were no significant differences between the groups regarding accidents or near-accidents (table 3). Age was similar for both types of accidents between study groups. Among women, accidents occurred more often for e-bikers than for conventional bike users. After controlling for potential prognostic factors and confounders, the study group and overall cycling time predicted road traffic accidents in multiple binary regression analysis, with e-bikers having a higher probability of having a traffic accident (OR=1.63, 95% CI 1.02 to 2.58), p=0.039) than conventional cyclists (see online supplemental table S6). For near-accidents, older age, frequency of cycling and the overall cycling time were predictors of road traffic accidents but not the study group (see online supplemental table S8). Regarding accident opponents, no significant differences were observed between study groups (table 3).
Road traffic accidents with e-bikes or conventional bicycles
Discussion
We investigated the impact of e-bikes on cycling-related and overall physical activity, traffic accident rates and user characteristics in a nationwide cohort in Germany. Our main finding is that e-biking is characterised by less riding duration and lower riding intensity, leading to less cycling spent at MVPA than conventional cycling. The risk for road traffic or near-accidents was similar to that for conventional bikes. Motives for purchasing e-bikes are mainly for alleviating physical strain during cycling and health promotion, which is consistent with the idea that e-bikes might help specifically older or overweight users or individuals with reduced mobility to overcome barriers to using a bicycle in everyday life.
Bike usage patterns and prognostic factors for reaching the physical activity target
Current physical activity guidelines emphasise the importance of activities not traditionally perceived as exercise, such as commuting on foot or by bicycle, to incorporate small bouts of movement into everyday routine.23 25 The increased popularity of e-bikes might promote active transportation and help individuals meet current activity recommendations. To date, only one European-wide study (PASTA) has estimated the activity-related energy expenditure of e-biking, observing energy expenditure comparable to that of conventional cyclists.11 It should be noted that the PASTA study used online surveys and not objective measures like activity trackers to assess the frequency, duration and intensity of cycling. as done in our study. In contrast, previous small-scale studies12 26–28 have reported that using an e-bike led to shorter trip duration and lower cycling intensity, prompting the question of whether activity-related exposure is sufficient to achieve targeted health effects. However, since these studies applied experimental designs with fixed travel distances or fixed levels of mechanical motor support, the results are difficult to extrapolate to a real-world setting.
In our study, overall cycling time, frequency of bike riding and heart rate during cycling were lower for e-bikers, while cycling time per trip was higher for e-bikers. Hence, cycling spent at MVPA was also less for e-bikers, irrespective of the calculation of MVPA (WHO 2010: at least 10 consecutive minutes of MVPA22 or WHO 2020: counting every activity bout at MVPA).23 These outcomes contradict the results of the above-mentioned PASTA study in which physical activity levels (estimated energy expenditure) were reported to be similar for e-bikers and conventional bikers.11 This might be explained by using self-reported versus objective measures of trip numbers, trip duration and cardiovascular effort. Furthermore, the exclusive focus on participants from large cities (eg, London, Barcelona, Rome), in contrast to our investigation, which included rural and urban areas reflecting diverse infrastructures, might limit the generalizability and partly explain the differences in our findings.
Participants’ characteristics and motives for bike purchase and use
The energy expended during activity, a product of activity duration and intensity, is a well-established marker of physical activity-related health benefits.29 Given the observed higher energy expenditure when using a traditional bicycle, it appears we should recommend bicycles rather than e-bikes to attain optimised health effects. However, this view neglects the fact that certain individuals make a deliberate choice to purchase an e-bike, who would not otherwise consider conventional cycling.13 The participant characteristics of our cohort suggest that e-biking is of interest, particularly for those who will benefit the most for health-related fitness—namely, older users, overweight and obese individuals or those with health-related limitations and fewer exercise activities. Indeed, stated purchase motives indicate that e-bikers appreciate the ease of use and comfort of e-bikes and the opportunity to increase their health and fitness, which confirms previous findings that e-biking provides the option to continue cycling despite physical limitations and has the potential to maintain physical activity and fitness.5
Replacement of other transport modes
An essential aspect when assessing the overall health effects of activity interventions or exercise-supporting electrical devices is the effect on other daily activities. Previous studies have suggested that for e-bike users, other physical activities are not significantly affected—that is, there does not appear to be an activity substitution effect.30 31 Our activity questionnaire data support these results, as we did not observe differences between the bike groups for total daily physical activity or substantial replacement of walking journeys by bikes. From an ecological, infrastructural and health perspective, it would be desirable if the increasing sale of e-bikes would (at least partly) lead to replacing CO2-emitting motorised vehicles. The degree to which e-bikes replace other transport modes varies across studies. Current evidence suggests that private cars and conventional bicycles are the most substituted transport modes when using an e-bike.5 Our survey data indeed strengthen previous findings that e-bikers are most likely to replace car journeys with their e-bike, with fewer replacing trips conducted by foot or public transport.
Road traffic accidents
WHO sustainable development goal (SDG) 3.6 was to halve the number of global deaths and injuries from road traffic accidents by 2020.32 Recent reports from the European and Asian regions indicate that the SDG 3.6 is unlikely to be reached.15 33 Since an electrically assisted bicycle usually goes faster and weighs about 30% to 50% more than a conventional bicycle,26 it could be postulated that its handling is more difficult, and accidents are more likely to occur. Indeed, there are reports that particularly those who switch from conventional bicycles to e-bikes might have an increased risk of collisions due to higher speed and more unexpected and sharp braking manoeuvres.34 Looking at the crude frequencies of traffic accidents, we observed no significant differences between the two bike groups. However, when controlled for confounders and potential prognostic factors e-biking and longer cycling time were found to be predictors of traffic accidents, which should be taken into account when considering e-bikes as an effective public health tool. Our results confirm earlier data16 that women riding an e-bike might have a greater risk of traffic accidents than women on conventional bikes. The reasons for this gender difference are not yet clear but might include more difficulties for women with balance and higher speed when riding an e-bike, and women are more often novel e-bike users.16
Limitations and strengths
Our study has strengths and limitations. As the first large-scale study in this context, we investigated the characteristics, motives and usage patterns of e-bikers versus conventional bikers under real-life conditions using objective activity measures. As for any real-world data, we cannot rule out the possibility of data artefacts or incorrect application of the activity tracker by the study participants. The method used to assess HR by the smartwatch is not as accurate as assessment of HR with an ECG or a chest belt. As a further limitation, maximum HR was not measured during an exhaustive exercise test but calculated by published formula, which might affect the individual assessment of time spent at MVPA.
Conclusion
In conclusion, we observed that e-bike use is associated with a lower probability of reaching WHO targets for moderate-to-vigorous physical activity than bicycle use. Therefore, the expected health effects might be higher for bicycle users, which is an important factor for policymakers in the discussion on subsidising e-bikes at the state level. However, the increasing attractiveness and popularity of e-bikes might facilitate recreational cycling and active commuting, particularly for those who are limited by age- or illness-associated constrictions and who otherwise would not opt to use a bicycle. Further research on users’ motives and possible replacement of other transport modes is necessary to shed light on whether e-bikes, as an active form of electromobility, could feasibly provide a relevant contribution to mitigating traffic congestion and air pollution promote active living.
Data availability statement
Data are available upon reasonable request. Data will be shared with researchers who provide a methodologically sound proposal to achieve aims in the approved proposal. Proposals should be directed to sportmedizin@mh-hannover.de to gain access, data requestors will need to sign a data access agreement.
Ethics statements
Patient consent for publication
Ethics approval
This study involves human participants and was approved by the ethics committee of Hannover Medical School, ID: 7237. Participants gave informed consent to participate in the study before taking part.
Acknowledgments
We acknowledge the support of the study participants and thank Nina McGuinness for proofreading the manuscript.
References
Supplementary materials
Supplementary Data
This web only file has been produced by the BMJ Publishing Group from an electronic file supplied by the author(s) and has not been edited for content.
Supplementary Data
This web only file has been produced by the BMJ Publishing Group from an electronic file supplied by the author(s) and has not been edited for content.
Press release
Footnotes
SH and HTB contributed equally.
Contributors J-MGS, JZ, UT, HJ and AK planned and designed the study; HTB, JB and CCvR recruited participants. JB, CCvR and TS collected the data; MK, DH, and SHä processed the activity device data and questionnaire data; and JZ, HJ and TS collected and analysed the traffic accident surveys; AK calculated the sample size, and DH and SHä were responsible for the statistical analyses. SH and HTB wrote the first draft of the manuscript. AK, J-MGS, MK and UT contributed to the discussion and reviewed/edited the manuscript. UT, SH and AK have verified the underlying data. All authors had full access to all data, participated in data interpretation, approved the final manuscript, and agreed to submit for publication. SH is the guarantor for the overall content of the study.
Funding This study was supported by the German Federal Ministry of Transport and Digital Infrastructure (Grant number: VB1609A).
Competing interests None declared.
Patient and public involvement Patients and/or the public were not involved in the design, or conduct, or reporting, or dissemination plans of this research.
Provenance and peer review Not commissioned; externally peer reviewed.
Supplemental material This content has been supplied by the author(s). It has not been vetted by BMJ Publishing Group Limited (BMJ) and may not have been peer-reviewed. Any opinions or recommendations discussed are solely those of the author(s) and are not endorsed by BMJ. BMJ disclaims all liability and responsibility arising from any reliance placed on the content. Where the content includes any translated material, BMJ does not warrant the accuracy and reliability of the translations (including but not limited to local regulations, clinical guidelines, terminology, drug names and drug dosages), and is not responsible for any error and/or omissions arising from translation and adaptation or otherwise.