Article Text

Abstract
Objectives We evaluated the effect of a nutrition education intervention on bone stress injury (BSI) incidence among female distance runners at two NCAA Division I institutions.
Methods Historical BSI rates were measured retrospectively (2010–2013); runners were then followed prospectively in pilot (2013–2016) and intervention (2016–2020) phases. The primary aim was to compare BSI rates in the historical and intervention phases. Pilot phase data are included only for descriptive purposes. The intervention comprised team nutrition presentations focused on optimising energy availability plus individualised nutrition sessions for runners with elevated Female Athlete Triad risk. Annual BSI rates were calculated using a generalised estimating equation Poisson regression model adjusted for age and institution. Post hoc analyses were stratified by institution and BSI type (trabecular-rich or cortical-rich).
Results The historical phase included 56 runners and 90.2 person-years; the intervention phase included 78 runners and 137.3 person-years. Overall BSI rates were not reduced from the historical (0.52 events per person-year) to the intervention (0.43 events per person-year) phase. Post hoc analyses demonstrated trabecular-rich BSI rates dropped significantly from 0.18 to 0.10 events per person-year from the historical to intervention phase (p=0.047). There was a significant interaction between phase and institution (p=0.009). At Institution 1, the overall BSI rate dropped from 0.63 to 0.27 events per person-year from the historical to intervention phase (p=0.041), whereas no decline was observed at Institution 2.
Conclusion Our findings suggest that a nutrition intervention emphasising energy availability may preferentially impact trabecular-rich BSI and depend on team environment, culture and resources.
- intervention
- bone density/endocrine status
- nutrition
- bone
Data availability statement
Data are available upon reasonable request.
This is an open access article distributed in accordance with the Creative Commons Attribution Non Commercial (CC BY-NC 4.0) license, which permits others to distribute, remix, adapt, build upon this work non-commercially, and license their derivative works on different terms, provided the original work is properly cited, appropriate credit is given, any changes made indicated, and the use is non-commercial. See: http://creativecommons.org/licenses/by-nc/4.0/.
Statistics from Altmetric.com
WHAT IS ALREADY KNOWN ON THIS TOPIC
Studies show that up to 20% of collegiate endurance runners sustain one or more bone stress injuries (BSIs) per year and that runners with greater Triad components are at increased risk for BSI. We sought to investigate the role of a multisite nutrition education intervention in prevention of BSI in NCAA Division I endurance runners.
WHAT THIS STUDY ADDS
In post hoc analyses, we found a significant reduction in BSI rates in trabecular-rich BSI at both institutions and overall BSI rates at one institution. Our findings suggest that a nutrition education programme focused on optimising energy availability may preferentially affect trabecular-rich BSI and depend on team environment, culture and resources.
HOW THIS STUDY MIGHT AFFECT RESEARCH, PRACTICE OR POLICY
We recommend that nutrition education interventions that optimise fuelling and increase energy availability should become standard of care at NCAA collegiate running programmes.
Introduction
The passage of Title IX in 1972 led to greater female athletic participation, resulting in both health benefits to competitors and increased awareness of female athletes’ sex-specific health needs and injury risks.1 2 In 1993, the Female Athlete Triad (Triad) was first described and in 2007 the definition was updated to describe a syndrome of three inter-related components: low energy availability (with or without disordered eating), amenorrhoea and osteoporosis.2 Endurance athletes are at elevated risk for low energy availability and exhibit an elevated prevalence of one or more components of the Triad.3 Often the Triad is identified in athletes who sustain a bone stress injury (BSI). It is reported that up to 20% of collegiate endurance runners sustain one or more BSI per year.4–6 Triad-related factors such as low bone mineral density (BMD), amenorrhea, and factors associated with energy deficiency, such as dietary restraint and lower calcium intake, have been associated with BSI risk in female athletes and active women.3 4 7–9
Prior research suggests that athletes with more Triad components are at increased risk for BSI.8 In female adolescent and young adult athletes, the risk of sustaining a BSI starts from 15%–20% for a single Triad risk factor and increases up to 30%–50% with the addition of Triad risk factors.8 Additionally, factors increasing risk of BSI may vary by bone site. Bone is composed of both cortical and trabecular bone and the proportion of each type varies by bone site.10 Compared with cortical-rich bone, trabecular-rich bone has a larger blood flow and has a higher turnover rate.11 Trabecular-rich bone is more metabolically active and more susceptible to the hormonal impacts seen in the Triad.12–14
Further, controlled laboratory studies demonstrate the effect of decreasing levels of energy availability on reducing osteogenic hormones and markers of bone formation.15–17 These hormone disruptions may yield an imbalance in bone turnover and reduce the bone’s ability to repair the microdamage that can result from endurance running. Persistent low energy availability may also affect osteoblast and osteoclast activity throughout the bone remodelling cycle, which can lower bone mass. Insufficient calorie intake may also lead to low intake of bone-building nutrients.18 Prior research evaluating female collegiate runners’ food and nutrient intake identified low energy availability in approximately 40%–50% participants.18 In addition to impaired caloric intake, a significant portion of collegiate runners also fail to meet recommended levels for calcium and vitamin D intake.18
The relationship between low energy availability, suppression of endocrine factors involved in supporting bone health, and increased BSI risk underscores the need for education and individualised intervention efforts to promote adequate intake of calories and bone-building nutrients in elite collegiate endurance runners. Despite the known prevalence and consequences of the Triad and its impact on bone health, as well as publications addressing Triad management,19 there have been no team-based intervention studies in collegiate endurance runners that have demonstrated whether a nutrition education programme that optimises energy availability can reduce subsequent BSI risk in female athletes. Nutritional intervention has been identified as a key tool that may prevent progression to serious end points that include low BMD and BSI.19 The Triad risk stratification system, developed in 2014, facilitates the identification of athletes at highest risk for BSI and need for support from the multidisciplinary team.19
The aim of this multisite study was to evaluate the role of a nutrition education intervention in the prevention of BSI among National Collegiate Athletics Association Division I endurance runners. The intervention involved two components: (1) Education about adequate energy intake and bone-building nutrients and (2) The use of a Triad risk-stratification system to identify higher-risk athletes for further follow-up. The study was conducted in three phases: BSI rates were measured historically in order to power the study (historical phase); a pilot study was conducted to evaluate intervention feasibility (pilot phase); and the intervention was implemented fully (intervention phase). Our primary hypothesis was that the BSI rate would be lower during the intervention phase than the historical phase. Additionally, we conducted post hoc analyses to compare BSI rates in the intervention phase to BSI rates in the historical phase stratified by institution and by type of BSI (cortical-rich vs trabecular-rich). We also present the BSI rates for the pilot phase for descriptive purposes.
Methods
Study population
Our study population consisted of female middle-distance and long-distance runners at two institutions. Runners who competed in distances of 800 m or greater on the track (including 1500 m, 5000 m, steeplechase and 10 000 m) and/or competed in cross country were eligible to participate.
Study institutions
Both Institution 1 and Institution 2 are competitive, NCAA Division I cross-country and track and field programmes. Institution 1 had the same registered dietitian (RD) and coaching staff throughout the pilot and intervention phases of the programme, whereas Institution 2 had one coaching staff change and three RD changes over the course of the pilot and intervention phases. Our study principal investigators at each institution served as the head cross-country and track and field physicians throughout all phases of the study.
Study phases
This study had three phases: a 3-year historical phase (2010–2013), a 3-year pilot phase (2013–2016) and a 4-year intervention (2016–2020) phase at both institutions. Each participant in the pilot and intervention phases provided informed written consent and the study was approved by each individual site’s institutional review board. A waiver of informed consent was granted for the historical phase given that data were collected from retrospective chart review. Patients and the public were not involved in the design, reporting or translation of this research.
Study years ran from 1 August to 31 July. Participants who enrolled in a phase and had remaining years of athletic eligibility at the end of that phase were carried over into the next phase. Participants may have been followed for less than 1 year if they joined the study late, graduated, disenrolled or discontinued athletic participation at their institution. The intervention and study procedures were the same in the pilot and the intervention phases, whereas the historical phase consisted of retrospective chart review. The intervention consisted of a team-wide approach for nutrition education and injury prevention surveillance to optimise BMD and reduce BSI. After the implementation success of the pilot phase, our grant was extended to continue study procedures for the intervention phase.
Historical phase procedures
Chart review: We performed a retrospective chart review for all female runners on the cross-country and middle-distance or long-distance track rosters over 3 years (2010–2013).
Intervention: Standard of care management for high-risk athletes was addressed at each institution independently.
Primary outcome: We documented BSIs sustained during the historical phase from medical record notes provided from physician visits and radiology reports. The diagnosis of a BSI was based on documented examination findings and radiographic confirmation with X-ray and/or MRI reviewed by the team physician and musculoskeletal radiologists. Classification of trabecular-rich and cortical-rich BSIs was determined a priori. Trabecular-rich injuries included BSIs at the calcaneus, femoral neck, sacrum or pelvis; cortical-rich BSIs included BSIs at all other lower-limb sites. BSIs not attributed to participation in running were excluded.
Measurement of covariates and secondary outcomes: We collected data from preparticipation physical evaluation (PPE) screenings required for athletic participation and data from physician visits. The PPE screening involved an annual questionnaire that investigated disordered eating/eating disorder history, nutrition habits, history of BSI, history of low BMD and menstrual cycle status. Height and weight were measured at the PPE and were used to calculate BMI (kg/m2). Retrospective Triad Cumulative Risk Assessment (CRA) Scores were calculated by research coordinators and study investigators for each participant and were repeated for each annual observation. Triad variables of low energy availability with or without disordered eating/eating disorder, late menarche, history of oligomenorrhea/amenorrhea, history of BSI, and low BMD were designated a risk category—low (0 points), moderate (1 point), or high (2 points)—according to the Triad Coalition Consensus Statement CRA tool.19 A cumulative risk total was determined from the sum of risk categories. Overall Triad risk categories—low risk (0–1 point), moderate risk (2–5) or high risk (6+) were assigned. If a participant was missing an individual risk component, they were assigned a score of zero for that component in the cumulative risk category determination. Given that dual energy X-ray absorptiometry (DXA) scans were not routinely obtained in the historical phase, all participants received a score of zero for low BMD risk. Thus, CRA scores are expected to be lower in the historical than the pilot and intervention phases.
Pilot and intervention phase procedures
Participant enrolment: The pilot phase enrolled runners from Fall 2013 to Spring 2016 and the intervention phase enrolled runners from Fall 2016 to 1 April 2020. The intervention phase was planned to continue through four academic years but was ended 2 months early in April 2020 due to the COVID-19 pandemic and cancellation of NCAA competition. In this final academic year, participants were followed for a maximum of 8 months.
Intervention
The study intervention consisted of team nutrition education presentations and individual athlete assessment and education sessions. During each year of the study, at the time of the PPE or shortly thereafter, a RD provided a 15–20 min nutrition education presentation to the cross-country teams, which addressed importance of adequate caloric intake and caloric timing for health and performance. Additionally, on an annual basis, within 2–4 weeks of the PPE, a team dietitian at each school scheduled individual 15–30 min athlete assessment and education sessions with all athletes enrolled in the study. During the individual meetings, team dietitians evaluated runners’ eating patterns (ie, meals/day, snacks/day, nutrient timing), dietary restrictions, dietary supplement use and a dietary recall of a typical day.
During the individual sessions, dietitians and athletes worked together to develop one to two nutrition goals based on their current training and dietary intake to optimise the intake of energy and bone-building nutrients. Athletes also had the option of using a smartphone-based application, ‘Run Fueled’, which was developed by the study team and provided running-specific nutrition education in the form of daily tips, video clips, handouts and weekly recipes to support their nutrition goals and meeting recommended intake of energy and bone-building nutrients.
After the individualised session, the team dietitian had the option of scheduling one or more follow-up sessions. The decision of scheduling athlete follow-up sessions was informed, in part, by athletes’ Triad risk status and related information as provided by the multidisciplinary treatment team. The recommended protocol for scheduling follow-up sessions with the team dietitian included: low risk, follow-up not required; moderate risk, monthly follow-up sessions recommended; high risk, weekly or bi-weekly follow-up sessions recommended to monitor dietary behaviour change and address potential barriers to consuming adequate energy and bone-building nutrients.
Measurement of covariates and secondary outcomes: During the annual PPE, participants completed a similar questionnaire as the historical cohort to evaluate risk factors for BSI. Additionally, the Eating Disorder Examination Questionnaire with four subsections—dietary restraint, pathological behaviour, shape concern and weight concern—was added to the questionnaire.20 Participants also completed an annual web-based nutrition survey evaluating current exercise training, vegetarian status, food and beverage intake in the past 4 weeks, and dietary supplement use. All enrolled participants were invited to complete annual DXA scans. DXA scans were performed at each institution by a licensed technician using a Hologic QDR 4500A (Hologic, Bedford, Massachusetts, USA) or GE Lunar iDXA (GE Healthcare, Chicago, Illinois, USA). BMD measurements were obtained at the total body, lumbar spine (L1–L4), total hip, femoral neck and distal 1/3 of the radius. Results were reported as BMD (g/cm2) or as BMD Z-scores standardised by age, sex and ethnicity.
Triad CRA assessments were completed by research coordinators and study investigators at the time of the PPE and were updated yearly for each participant. Participants missing an individual risk component were assigned a score of zero for that component in the cumulative risk category determination.
Primary outcome: BSI
Team physicians used standard of care practices to evaluate runners presenting with pain or symptoms typical of BSI. Our study principal investigators at each institution reviewed all BSI cases. BSI diagnosis was determined from patient history, clinical exam and radiographic confirmation with X-ray and/or MRI. BSIs were classified as cortical-rich or trabecular-rich according to a priori classification in the same system as the historical phase. All BSIs were attributed to the sport of running.
The primary outcome variable was the total number of BSIs, as a repeated-measures count variable, that a participant sustained each year during the study. For secondary outcome variables, we considered the number of cortical-rich and trabecular-rich BSIs (also repeated-measures count variables) sustained each year.
Sample size calculation: The original target sample size for the intervention phase was 96 athletes. We calculated that with n=56 in the historical phase and n=96 in the intervention phase, we would have 82% power to detect a 50% reduction in the rate of BSI from the historical phase, assuming a historical rate of 0.47 BSI per person-year. This was based on using a χ2 test for the comparison, and assuming an alpha of 0.05. Our actual enrolment fell short of the target enrolment, with a final sample size of n=78.
Statistical analysis
Our primary aim was to compare the intervention and historical phases. Data from the pilot phase are presented only for descriptive purposes. Each participant contributed one observation per year to the data set. The primary outcome variable was the yearly BSI rate. BSI was measured yearly for each participant as a repeated-measures count variable. We determined the duration of time that each participant was at risk for BSI in each year from the number of days a participant was enrolled in the study minus the number of days a participant was restricted from weight-bearing running due to BSI.
We also performed post hoc analyses to compare the intervention and historical phases stratified by school and BSI type, trabecular or cortical. We assessed the relationship between yearly BSI rates by study phase with crude and adjusted rates. Crude rates were calculated by dividing the total number of BSIs by the total person-years at risk. Adjusted rates were calculated using Poisson generalised estimating equations (GEE, to account for within-subject correlation); an offset term was used to account for variable follow-up times. Models were adjusted for age and school to make yearly rates comparable. Values of p≤0.05 were considered statistically significant. We verified our statistical analysis and study procedures using the Checklist for Statistical Assessment of Medical Papers. All collected data including PPE, risk factor and outcome variables were stored on the secure, web-based Research Electronic Data Capture Database hosted at the Stanford Centre for Clinical Informatics. The data analysis for this manuscript was conducted using SAS software V.9.4 (Cary, North Carolina, USA).
Results
Study population
Fifty-six women were included in the historical phase and 78 women were enrolled in the intervention phase. This encompassed 102 annual observations in the historical phase and 166 annual observations in the intervention phase. The average age at baseline was slightly lower in the intervention phase (mean=18.8 years, SD=1.1) than the historical phase (mean=19.2 years, SD=1.3). Most participants in the intervention phase were Caucasian (table 1). About half of all participants had a history of BSI in both phases. Though the average Triad Score was higher in the intervention phase (mean=3.0, SD=2.2) than the historical phase (mean=2.2, SD=1.9), this is likely due to differences in measurement (eg, BMD was not measured in the historical phase) rather than true differences in risk (table 1).
Descriptive characteristics of the study population at baseline in each study phase, mean±SD or N (%)
BSI rates in the intervention versus historical phases
BSI rates had high year-to-year variability across all phases. There was no statistically significant reduction (p=0.34) or clear patterns of decline in the intervention phase compared with the historical phase (figure 1). The historical phase had 48 BSI events across 90 person-years and the intervention phase had 62 BSI events across 137 person-years (table 2). The overall BSI rates, adjusted for age and school, and accounting for within-subject correlation were 0.52 events per person-year for the historical phase (95% CI 0.38 to 0.71) and 0.43 events per year for the intervention phase (95% CI 0.31 to 0.59) (figure 1 and table 2).

Yearly adjusted bone stress injury (BSI) rates by study phase. Adjusted rates were determined used generalised estimating equation (GEE) models for Poisson regression adjusted for athlete age and school.
Yearly BSI rates by study phase. Adjusted rates were determined used generalised estimating equation (GEE) models for Poisson regression adjusted for age and school and accounting for within-subject correlation, using data across all phases of the study at once to make years comparable
Impact of the intervention on cortical-rich and trabecular-rich BSI rates
In post hoc analyses, we found a significant decline (p=0.047) in trabecular-rich BSI but not cortical-rich BSI (p=0.87) from the historical to the intervention phases. The adjusted rate of trabecular-rich BSI decreased from 0.18 events per person-year in the historical to 0.10 events per person-year in the intervention phase, whereas cortical-rich BSI rates remained similar across the historical and intervention phases (0.31 events to 0.35 events per person-year) (figure 2)(table 3).
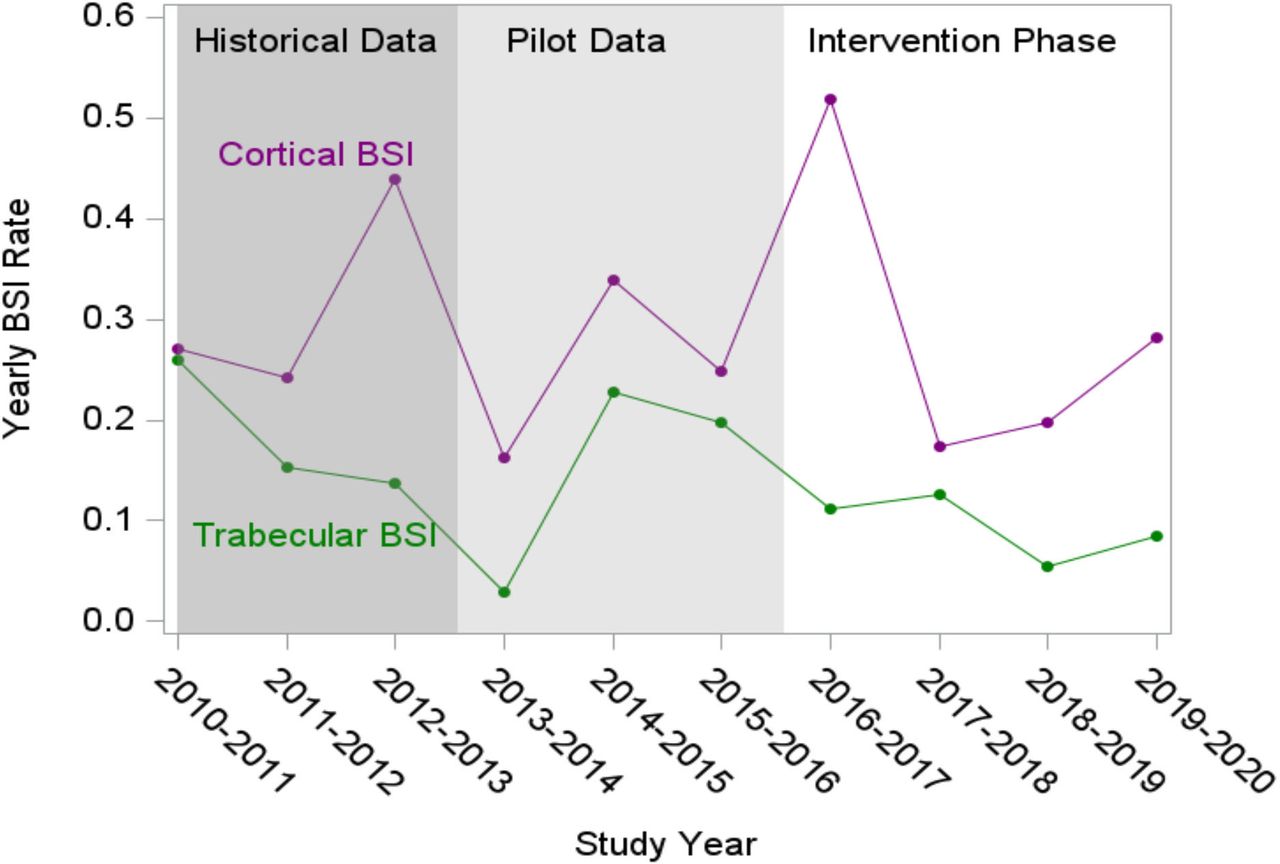
Yearly adjusted bone stress injury (BSI) rates for trabecular-rich bone sites and cortical-rich bone sites.
Yearly BSI rates in trabecular-rich and cortical-rich bone sites
Impact of the intervention on total BSI rates by institution
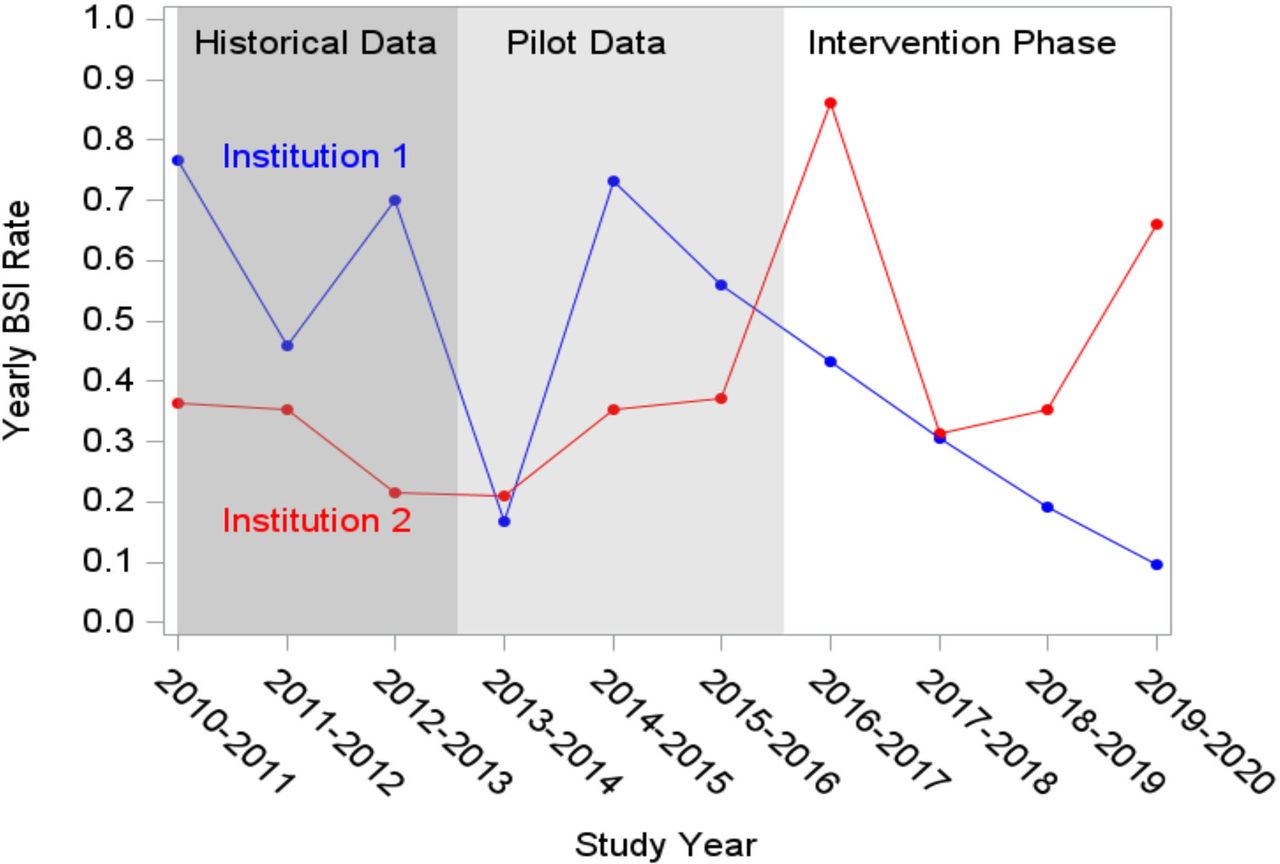
In post hoc analyses, we found a significant interaction (p=0.0086) between institution and phase (historical vs intervention) (table 4). At Institution 1, the adjusted BSI rate dropped significantly from 0.63 events per person-year in the historical phase to 0.27 events per person-year in the intervention phase (p=0.041). At Institution 2, the adjusted BSI rate remained similar between the historical and intervention phases (0.33 vs 0.56, p=0.20) (table 4).
Yearly crude and adjusted BSI rates by institution in each study phase. Adjusted rates were determined using generalised estimating equation (GEE) models for Poisson regression adjusted for age and accounting for within-subject correlation, using data across all phases of the study at once to make years comparable
BSI rates declined in a linear fashion during the intervention phase at Institution 1—the two lowest adjusted BSI rates occurred in the final 2 years of the study (0.19 and 0.10 events per person-year, respectively) (table 4)(figure 3).

Yearly adjusted bone stress injury (BSI) rates by institution in each study phase.
When stratified by institution and bone type, the changes in BSI rates were not statistically significant (Institution 1 had non-significant reductions in both trabecular-rich and cortical-rich BSI rates from the historical to intervention phase, and Institution 2 had a reduction in trabecular-rich BSI rates, but a 52% increase in cortical-rich BSI rates) (online supplemental tables 1 and 2).
Supplemental material
Supplemental material
Discussion
This is the first multisite study to evaluate the role of a nutrition education intervention and CRA stratification in the prevention of BSI among NCAA Division I female endurance runners. BSI rates exhibited high year-to-year variability. We did not find a difference in overall BSI rates from the historical to the intervention phase. However, in post hoc stratified analyses, we found that trabecular BSI rates were significantly reduced from the historical to the intervention phase, from 0.18 to 0.10 events per person-year, respectively. We also observed a significant interaction between school and phase (intervention vs historical), with Institution 1 exhibiting a significant and large reduction in overall BSI rates from 0.63 to 0.27 events per person-year, but with Institution 2 exhibiting no decline. Collective results suggest the nutrition intervention may have partial effectiveness for reducing BSI, particularly in trabecular-rich locations. However, differences observed in BSI between institutions and no detected differences in rate of cortical-rich BSI reflect the complexity in the management of BSI in the sport of long-distance running.
We did not meet our primary end point, which may be explained by several factors. Though our primary end point was overall BSI rates, optimising energy availability may have a bigger impact on trabecular-rich BSI specifically. There was also high year-to-year variability in BSI rates, which may reflect year-to-year variations in team composition, coaching staff, support staff and training; this high variability may have reduced statistical power. Institutional differences in preintervention practices, preintervention BSI rates and implementation of the intervention may also have affected the results. Finally, the study may not have been long enough to see the full effects of the intervention, given that it can take years to change team culture and individual behaviour, and that improvements in energy availability take time to manifest in stronger bones.
In post hoc analyses, the adjusted rate of trabecular-rich BSI was nearly halved from the historical phase to the intervention phase. It is biologically plausible that our intervention would have a greater impact on trabecular-rich BSI. Prior studies indicate that Triad-related risk factors and low BMD are more strongly related to heightened risk of trabecular-rich BSI than cortical-rich BSI.14 21 22 Given that our nutrition intervention was designed to prevent and ameliorate Triad-related risk factors, we expect the intervention to have greater impact on trabecular-rich rather than cortical-rich BSI. Future research should explore relationships between nutrition interventions, Triad biomarkers including oestrogen, and trabecular-rich BSI to understand potential causal relationships.
We also observed a significant interaction between institution and phase in post hoc analyses. Institution 1 experienced a significant decline in the overall BSI rate when compared with the historical phase, as well as a significant linear decline in the rates of BSI from the beginning to the end of the intervention phase, whereas Institution 2 had a small decrease in trabecular BSI but an increase in cortical BSI. While this could be a chance finding, the difference could also reflect differences in standard of care that existed at the two institutions prior to the intervention, as well as differences in both how the intervention was implemented and in team culture at the two institutions. Institution 2 already employed a dietitian and had nutrition education focused on increasing energy availability in place during the historical phase, prior to the nutrition intervention study. It is therefore not surprising that there was not a significant reduction in BSI at Institution 2 if some key aspects of the intervention were already in place. Notably, the rate of trabecular BSI at Institution 2 during the historical phase was already low—0.12 events per person year, which was less than half of the rate in Institution 1 historically (0.28 events per person year) and was similar to the rate in Institution 1 at the end of the intervention (0.13 events per person year). Thus, there was less opportunity for the nutrition intervention to impact BSI.
Also, at Institution 1, the coaching and dietitian staff remained relatively stable over the duration of the study. With this stability, athletes and coaches seemed more committed to the intervention and team captains were vocal proponents of the importance of the study procedures and nutritional education. In contrast, at Institution 2, there were several changes to the coaching and dietitian staff, which made it more challenging to implement the intervention. With the lack of stability, study procedures had to be reinforced each year, and athletes seemed slower to commit to the study procedures and nutritional education. We hypothesise that team culture is significantly related to individual behaviour change, readiness to change and nutritional habits. Thus, in follow-up studies, we plan to implement novel team culture and validated readiness to change surveys.
While this is the first study to characterise how a team-based nutrition education reduces BSI in collegiate female runners, there are limitations to note. We believe our intervention should be adopted as standard of care at institutions, thus we did not want to exclude athletes from the intervention, so we did not have a control group for comparison, and we cannot exclude the impact of chance on our study results. The study was also voluntary including participation in the nutrition intervention, and changes in dietary intake were not directly measured to verify changes in energy availability. The survey design for risk factors is prone to recall bias. Changes in training variables and other external factors at collegiate programmes may influence behaviours and injury risk. Behaviours around nutrition are difficult to fully measure and accuracy of reporting changes on our questionnaires cannot be verified. The results highlight that efforts to improve nutrition may also require other changes in behaviour or non-quantified factors that influence BSI. Finally, the study may have been somewhat underpowered because the enrolled sample size (78) was lower than the target sample size (96) in the intervention phase; early stopping of the study due to COVID-19 may further have limited power. However, it is encouraging that one of two institutions exhibited a reduction in BSI incidence at the conclusion of the study on post hoc analysis, and that both institutions experienced a significant reduction in trabecular-rich BSI at high-risk sites, such as the femoral neck, that often involve Triad-related risk factors and delayed return to play.23 We believe that nutrition education interventions and Triad risk-stratification systems would greatly benefit from becoming part of standard-of-care procedures at NCAA collegiate running programmes.
Conclusion
This multisite, prospective study found that a nutrition education intervention significantly reduced trabecular-rich BSI in female distance runners at both institutions and overall BSI rates (cortical-rich and trabecular-rich bone) at one institution. Future research should further explore additional methods of reducing Triad risk and BSIs sustained in this population and should evaluate the impact of team culture, individual readiness to change and existing resources on the success of team-based nutritional interventions.
Data availability statement
Data are available upon reasonable request.
Ethics statements
Patient consent for publication
Ethics approval
This study involves human participants and was approved by the Stanford University Institutional Review Board and the University of California Los Angeles Institutional Review Board. Participants gave informed consent to participate in the study before taking part.
Acknowledgments
The authors thank the sports dietitians who helped with the nutrition intervention and the athletic trainers and coaching staff for their support throughout this study.
References
Supplementary materials
Supplementary Data
This web only file has been produced by the BMJ Publishing Group from an electronic file supplied by the author(s) and has not been edited for content.
Footnotes
MF and MR are joint first authors.
Twitter @Stanford_Ortho
Contributors All authors contributed to editing and revising this manuscript and the majority of manuscript writing tasks where shared between MF and MR. KS was the statistician on the study and contributed to interpretation of data and presentation of results. AT and EK were involved in early stage study design and implementation. MTB coordinated intervention design and nutritional protocols along with interpretation of nutritional results. AK, EMO, BYK, KF, EM, ED, SM and SS helped with study implementation and coordination. AN and MF were the principal investigators at each institution. MF is the guarantor of the study and manuscript.
Funding This study was funded by the Pac-12 Student Health and Well-Being Grant Program as well as the American Medical Society for Sports Medicine Foundation Grant.
Competing interests None declared.
Patient and public involvement Patients and/or the public were not involved in the design, or conduct, or reporting, or dissemination plans of this research.
Provenance and peer review Not commissioned; externally peer reviewed.
Supplemental material This content has been supplied by the author(s). It has not been vetted by BMJ Publishing Group Limited (BMJ) and may not have been peer-reviewed. Any opinions or recommendations discussed are solely those of the author(s) and are not endorsed by BMJ. BMJ disclaims all liability and responsibility arising from any reliance placed on the content. Where the content includes any translated material, BMJ does not warrant the accuracy and reliability of the translations (including but not limited to local regulations, clinical guidelines, terminology, drug names and drug dosages), and is not responsible for any error and/or omissions arising from translation and adaptation or otherwise.