Article Text

Abstract
Objective In the present study, we model the potential spread of virus during soccer matches.
Methods Tracking data from 14 elite soccer matches was used. One player in each match was designated as a virus carrier (called ‘infected player’) for the purpose of the study. The exposure score (measured in seconds) was calculated as time spent closer than 1.5 m from the infected player or time spent in an exponentially declining zone, where the infected player was positioned earlier.
Results The results revealed that, on average, each player was exposed for 87.8 s per match.
Conclusion Potential spread of virus during soccer matches was modelled and it revealed that the exposure to a virus during soccer matches is limited.
- Soccer
- COVID-19
- Sports analysis in different types of sports
This is an open access article distributed in accordance with the Creative Commons Attribution Non Commercial (CC BY-NC 4.0) license, which permits others to distribute, remix, adapt, build upon this work non-commercially, and license their derivative works on different terms, provided the original work is properly cited, appropriate credit is given, any changes made indicated, and the use is non-commercial. See: http://creativecommons.org/licenses/by-nc/4.0/.
Statistics from Altmetric.com
What is already known
Virus can spread through the air depending on the distance between persons.
During a pandemic, it is discussed if sports activities aid in spreading a virus.
Heavy breathing during sports activities spreads more virus to the air from an infected athlete.
What are the new findings
Potential spread of virus through the air can be modelled.
The duration of potential exposure to virus is modelled to be approximately 1.5 min in a 90-minute soccer match.
How it might affect clinical practice in the future
Authorities and governing bodies can use this model to evaluate safe elite soccer matches during a pandemic.
Introduction
Following spread of the SARS-CoV-2, most countries globally and the WHO have emphasised social distancing among the protective measures.1 This suggests that sports in which the athletes are in close contact should be avoided. Soccer is one of these sports.
The SARS-CoV-2, as other viruses, is generally believed to spread through contact or indirectly through the air.2 The spread through contact occurs when particles from an infected person attach to a surface or an object, and other people then touch that surface or object before touching their own eyes, nose or mouth.3 The spread can also occur through direct contact.3 The spread through the air occur when an infected person exhales particles which are inhaled by other persons. Particles are exhaled when an infected person coughs, sneezes or through heavy breathing, talking or shouting.4 Although it is not clear how far the particles travel through the air or how long they last in the air, the general guideline regarding social distancing recommends that persons keep a distance of at least 1 m1 or 2 m5 from each other.
It is well established that people playing sports are healthier and have a lower risk of numerous diseases.6 Accordingly, it can be argued, that the lack of possibilities for doing sports is detrimental to the public health. Hence, when a virus spreads through the population, health benefits from social distancing should be weighed against the decline in physical activity through sports. However, the probability of virus spread in soccer is not yet established.
In the present study, we model the potential spread of and exposure to a virus during soccer matches. The model is then applied to data from elite soccer matches to estimate potential duration of exposure, and we identified structural differences in exposure according to player positions of play.
Methods
Data were retrieved from one random match at each stadium in the Danish football league (the Danish Superliga) in the 2018/2019 season. Accordingly, data from 14 soccer matches were used. Through their clubs, all players consented to the sharing of player position data. Player position data were collected using a semiautomatic multiple-camera tracking system (Tracab, ChyronHego) in two dimensions (X and Y coordinates). Data were captured at 25 Hz as determined by the hardware and software, and filtered using a Butterworth fourth-order low-pass filter with a cut-off frequency of 0.24 Hz (determined by residual analysis)7 using a built-in MatLab function (the MathWorks, New York, USA).
To estimate the exposure, we determined a danger zone (DZ) around the player designated as carrying a virus (PV). The DZ was determined by calculating the time in which other players were within 1.5 m from PV. In addition, we established a tail follow PV, corresponding to the zone where the PV was positioned a time, t, ago. The tail that followed PV is modelling the decline in the amount of virus that has not yet fallen toward the ground. Gravity pulls the droplets toward the ground and air resistance opposes this motion. This was modelled as an exponential decline in exposure score and our function is based on the studies by Wells8 and Wang et al.9 This corresponds to an exponential decline with a half-life of 2 s (see figure 1 for an illustration).

Model of the calculation of the exposure score within one time-frame. The modelled player was running at a constant speed of 3 m/s in the direction of the y-axis, ie, the player is positioned at coordinate (15,25). The colour grading shows the exposure score, close to the player (<1.5 m) and in a tail following the player.
At every data point, the DZ and the tail of PV were calculated and players who were within one of these zones were given a score; a score of 1 if they were within a distance of 1.5 m of PV (DZ score) and a score determined by when they passed the previous position of PV (tail score). If a player was within more zones at the same time (ie, a stationary player), the score was then determined as the maximal score of the zones. Accordingly, the maximal score at any time and position was 1. An exposure score was then calculated as the sum of all scores divided by the sample frequency (25 Hz). This can be translated as how much time a player spent in a risk zone through a match. For example, a score of 55 corresponds to the player standing within a distance of less than 1.5 m from PV for 55 s.
The calculations were performed with one player modelled as infected in each match and repeated until every player had been modelled as infected. In 14 matches, a total of 15 750 exposure scores were calculated. As these 14 matches were performed by a variety of teams in the Danish Superliga, player positions are generalised to the following positions: goalkeeper, defensive backs (left back, center back (CB) and right back), wings and midfielders (left wing (LW), midfielder (MF) and right wing (RW)) and forwards and strikers (left forward, striker (ST) and right forward). This may result in some teams having multiple players on the same position, as a team playing the 4–4–2 system would have 2 CBs, 2 MFs and 2 STs, while a team playing the 3–5–2 system would have 2 LWs and 2 RWs. In case of substitutions, the substitutes were assigned the position of the player who left the field.
Statistical analysis
Data are represented as mean with 95% CIs. Through a linear regression, exposure scores were correlated to the time played. In addition, when presenting mean and CIs, the exposure score was normalised to the duration of a whole match (90 min).
Results
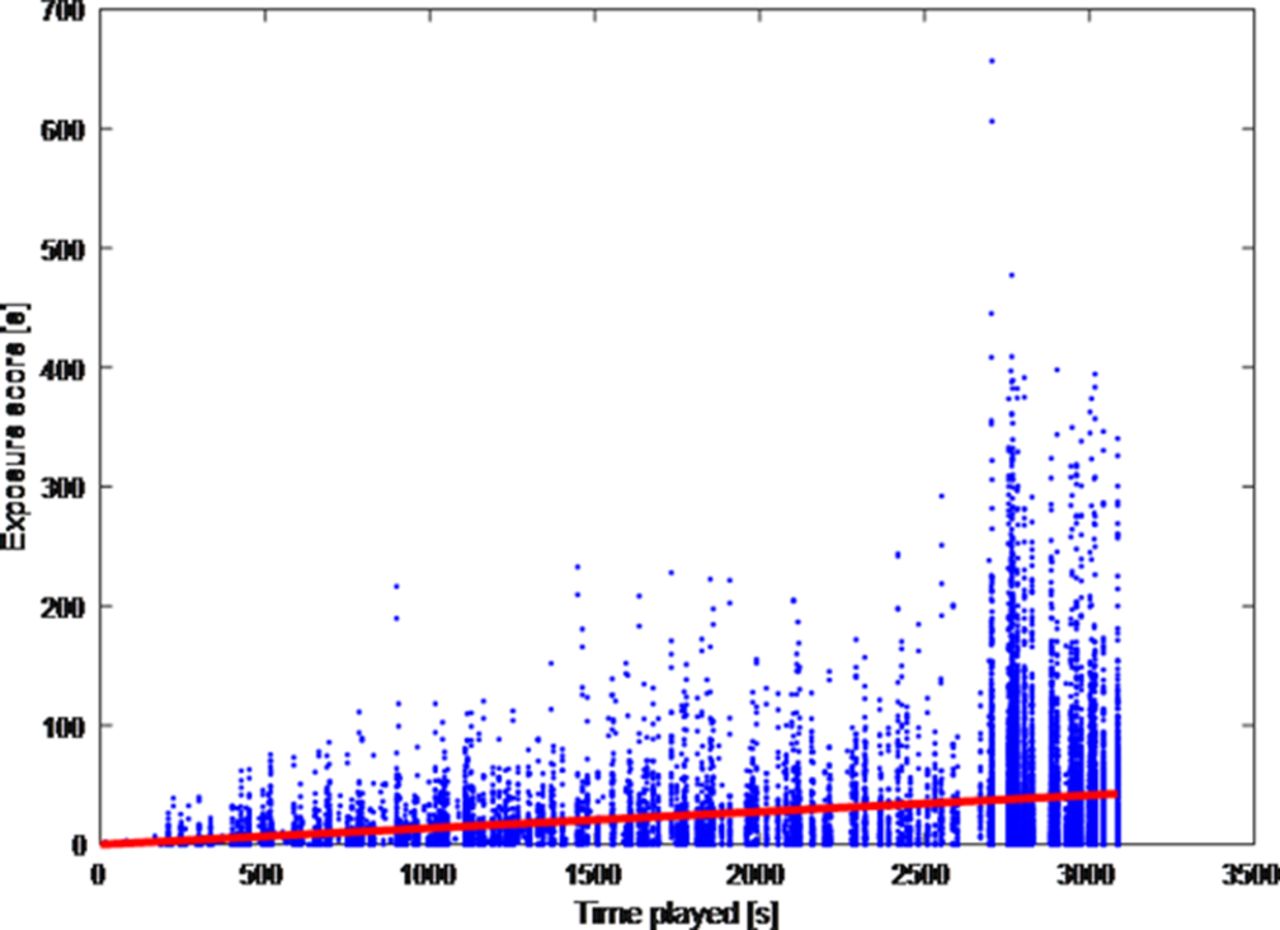
The playing time correlates to the exposure score (p<0.001, r=22) (figure 2). The mean score per 90 min (one match) for each player was 87.8 s (95% CI 87.0 to 89.6). The highest exposure score was 656.9 s and the lowest score was 0 s.

Data from all combinations of players and one infected player during one half of a game. The x-axis shows the time played and the y-axis shows the exposure score.
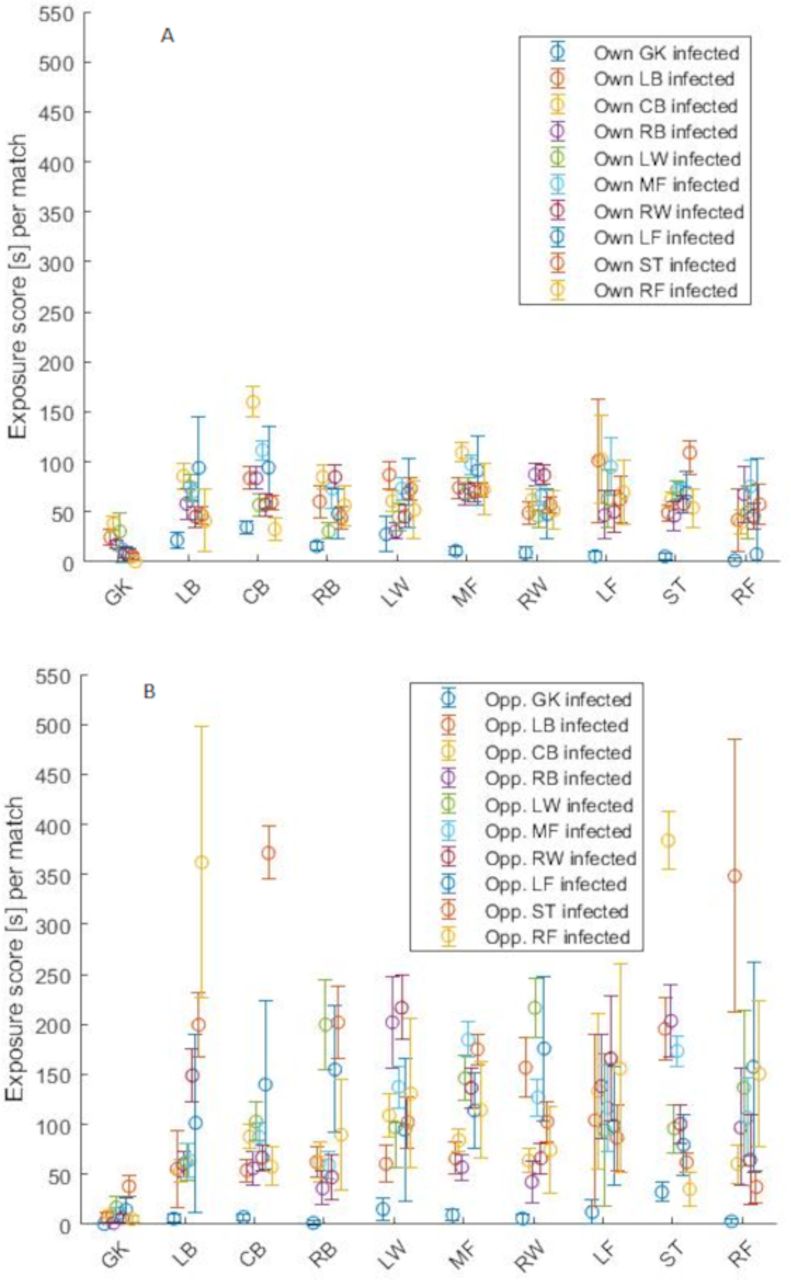
When a player on your own team was modelled as being infected, the mean exposure score was 61.8 s (95% CI 60.4 to 63.2). When a player on the opposing team was modelled as being infected, the mean exposure score almost doubles to 111.4 s (95% CI 108.2 to 114.6) (see table 1 and figures 3 and 4).
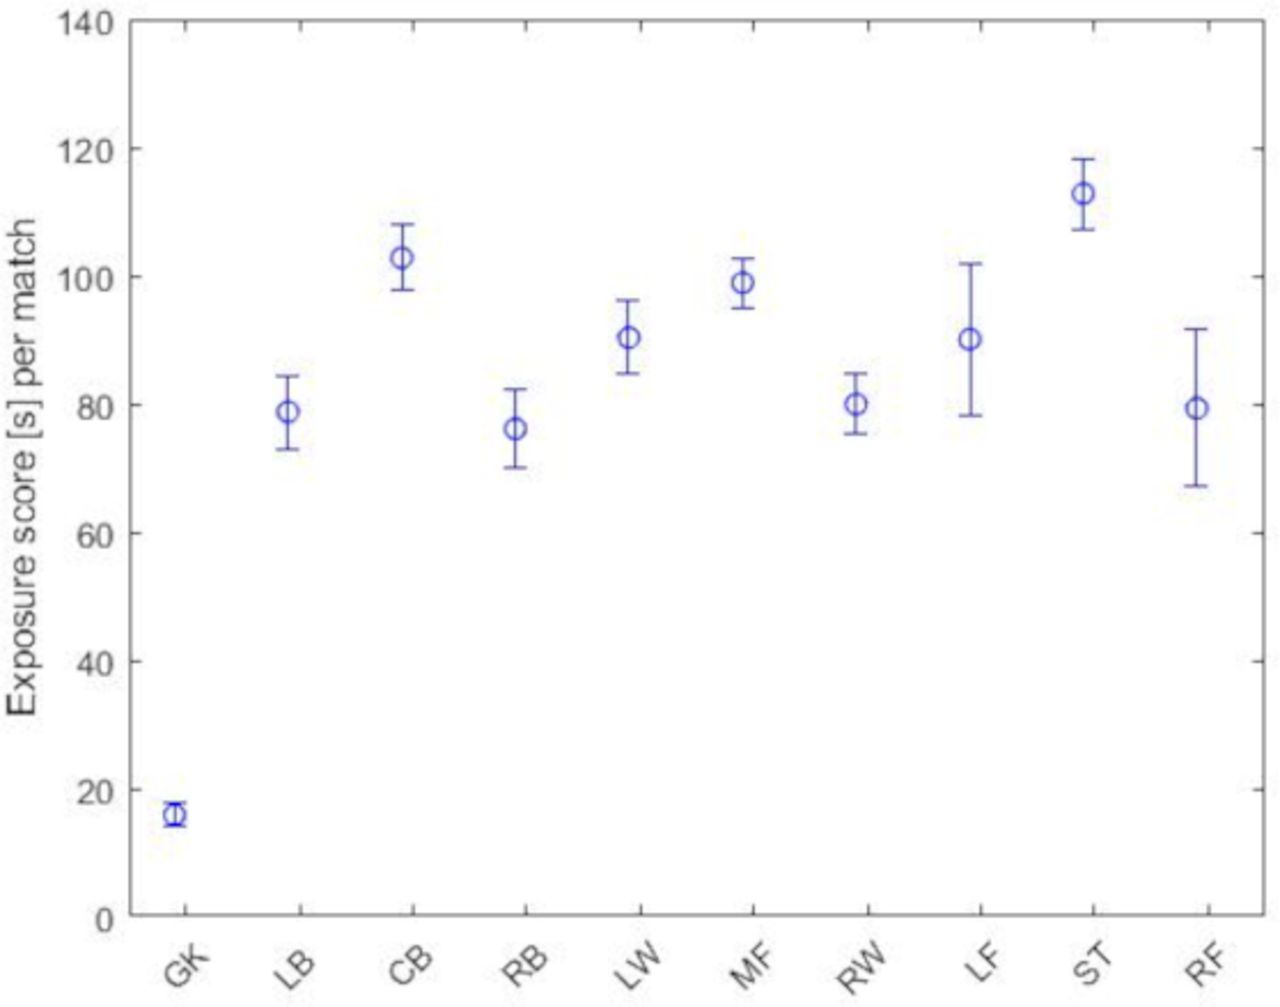
Exposure score of players regardless of the source of infection. The x-axis shows the positions and the y-axis shows the exposure score. CB, center back (central defender); GK, goalkeeper; LB, left back; LF, left forward; LW, left wing; MF, (central) midfielder; RB, right back; RF, right forward; RW, right wing; ST, striker.

(A) Exposure score of the individual positions for any other player in their own team infected. The x-axis shows the positions and the y-axis shows the exposure score. (B) Exposure score of the individual positions for any other player on the opponent team infected. The x-axis shows the positions and the y-axis shows the exposure score. CB, center back (central defender); GK, goalkeeper; LB, left back; LF, left forward; LW, left wing; MF, (central) midfielder; RB, right back; RF, right forward; RW, right wing; ST, striker.
Exposure score (s) for all combinations of players that were simulated to be infected
Discussion
Our results show that, on average, a player was positioned within an exposure zone for 1 min and 28 s (87.8 s) during a soccer match. We have not been able to find any data on the minimum exposure time before infection. In addition, the exposure time corresponds linearly to the playing time. This means that if the matches are shorter, then the exposure will be smaller. Our results are comparable to those of Gonçalves et al,10 who found that the average exposure time was 1 min and 31 s.
Our results can be used in the discussion on the reopening of sports facilities after a virus outbreak, exemplified by data from soccer matches. Our analysis does not include transmission of virus through contact. This phenomenon will mainly occur when touching the ball, at throw-ins or during tackles. Further limitations are that we did not include referees, team staff that might enter the field or the effect of wind on the field that possibly extends or changes the shape of the estimated DZ. On the other hand, the analysis does include the celebrations after scoring. Players from the scoring team usually get in close contact when celebrating a goal. In the analysed season, an average of 2.6 goals were scored per match. The exposure score can be smaller if players keep their social distance when celebrating a goal.
Our results further show a disparity in exposure score depending on which team and position the infected player plays. A lower exposure score when the infected players is their own team, suggests tactical structures causing larger mean distance between players on that team. As defenders tend to focus on covering larger areas and attackers tend to space out to stretch the opponent’s defence, these structures cause what could be referred to as tactically based social distancing, causing the exposure score to decrease. In contrast, exposure scores increase when the infected player is on the opponent team, since players need to cover the opponent team, which reduces the distance between players too. This is further supported by figure 4B showing increased exposure score when a players’ direct opponent is infected (eg, increased exposure score of CBs when opponent ST is infected).
Some considerations should be taken into account when interpreting our results. First, our analysis only included one infected player at a time. Second, we used data from elite soccer matches. It is obvious that players at different levels move differently on the field. Accordingly, the modelled exposure scores might be different for other soccer levels. Third, our data do not allow us to conclude whether soccer players are at a high risk of being infected during soccer matches. Our modelled exposure score corresponds to standing within 1.5 m of an infected person for approximately 1.5 min.
Conclusions
Potential spread of virus during soccer matches was modelled. It revealed a potential exposure duration of approximately 1.5 min per match per player, if one player was modelled as being infected with a virus.
Ethics statements
Patient consent for publication
Ethics approval
In guidance with the local ethics committee (Videnskabsetisk komité for Region Midtjylland), and through their clubs, all players gave their consent to share position data from matches.
Acknowledgments
The authors would like to thank the Danish League (Divisionsforeningen) for letting us access tracking data.
Footnotes
Contributors All authors have contributed equally to the design, calculations and manuscript preparation.
Funding The authors have not declared a specific grant for this research from any funding agency in the public, commercial or not-for-profit sectors.
Competing interests None declared.
Provenance and peer review Not commissioned; externally peer reviewed.