Article Text

Abstract
Objective This study uses machine learning (ML) to develop methods for estimating activity type/intensity using smartphones, to evaluate the accuracy of these models for classifying activity, and to evaluate differences in accuracy between three different wear locations.
Method Forty-eight participants were recruited to complete a series of activities while carrying Samsung phones in three different locations: backpack, right hand and right pocket. They were asked to sit, lie down, walk and run three Metabolic Equivalent Task (METs), five METs and at seven METs. Raw accelerometer data were collected. We used the R, activity counts package, to calculate activity counts and generated new features based on the raw accelerometer data. We evaluated and compared several ML algorithms; Random Forest (RF), Support Vector Machine, Naïve Bayes, Decision Tree, Linear Discriminant Analysis and k-Nearest Neighbours using the caret package (V.6.0–86). Using the combination of the raw accelerometer data and the computed features leads to high model accuracy.
Results Using raw accelerometer data, RF models achieved an accuracy of 92.90% for the right pocket location, 89% for the right hand location and 90.8% for the backpack location. Using activity counts, RF models achieved an accuracy of 51.4% for the right pocket location, 48.5% for the right hand location and 52.1% for the backpack location.
Conclusion Our results suggest that using smartphones to measure physical activity is accurate for estimating activity type/intensity and ML methods, such as RF with feature engineering techniques can accurately classify physical activity intensity levels in laboratory settings.
- Keywords
Data availability statement
Data are available upon reasonable request. Please contact the corresponding author to request study data.
This is an open access article distributed in accordance with the Creative Commons Attribution Non Commercial (CC BY-NC 4.0) license, which permits others to distribute, remix, adapt, build upon this work non-commercially, and license their derivative works on different terms, provided the original work is properly cited, appropriate credit is given, any changes made indicated, and the use is non-commercial. See: http://creativecommons.org/licenses/by-nc/4.0/.
Statistics from Altmetric.com
Strengths and limitations of this study
What is already known on this topic
Machine learning models have been used to predict physical activity types and intensities.
These machine learning models are able to predict physical activity types with over 80% accuracy.
What this study adds
Few studies have used machine learning to predict combined activity types and activity intensities at multiple phone wear locations.
How this study might affect research, practice and/or policy
If the phone wear location of participants is known, the machine learning models developed in this study could be used to predict physical activity type and intensity.
Introduction
Physical activity is related to multiple health outcomes. Increasing physical activity can reduce the risk of non-communicable diseases including cardiovascular diseases, cancer, chronic respiratory diseases and diabetes. Physical activity also plays an important role in improving life expectancy. Adults in developed nations are not considered to be adequately physically active despite it being the fourth leading cause of death worldwide.1
Increasingly health recommendations about human movement are concerned with physical activity, sedentary behaviour and overall movement throughout the day.2 Accelerometers are the most common tools used to measure human activity in free-living conditions.3 Most wearable devices and cell phones are equipped with accelerometers. Accelerometers measure the change of velocity over time and report acceleration in terms of multiples of gravitational force. Unprocessed acceleration data are often referred to as raw acceleration data. To develop measures of different activity types (eg, sitting, lying down, walking) or activity intensities (eg, walking at different speeds or Metabolic Equivalent Task (METS)), physical activity researchers have typically used research grade accelerometers placed on the hip or worn on the wrist.4 Reliance on hip or wrist worn research grade devices may limit the scale at which data can be collected in the population. Gathering accelerometer data from cell phones may be more convenient and affordable than using research-grade accelerometers. Computer science researchers in the field of human activity recognition have tended to use smartphones and attempted to predict activity type/intensities independent of the wear location of the device.5 While having accelerometers placed at a known wear location has distinct advantages, smartphones are ubiquitous and often worn in different locations by people. Device wear location is known to impact activity type/intensity predictions.6
To date, limited research has developed either cut points based or machine learning (ML)-based models to predict both activity types and activity intensities from smartphones at known wear locations. Activity prediction studies have typically either focused on predicting activity types or activity intensity. To our knowledge, only two studies have combined activity type and activity intensity categories with ML in order to predict activity.7 8
A cut-point approach, common in physical activity research,9 typically uses a single summary measure of acceleration (eg, counts) and applies thresholds, known as cut-points, to define categories of activity types or physical activity intensity. For example, the one set of cut-points define physical activity intensities as sedentary (<99 counts), light (100–759 counts), moderate intensity (760–5724 counts) and vigorous (5725 max counts).10 11 ML approaches to predicting activity types/intensities using accelerometer data rely on using multiple features (ie, variables) derived from the raw accelerometer signal12 and applying different ML models.
The purpose of this study was to develop methods for estimating human activity types/intensities using accelerometers from smartphones in three different wear locations, the participants’ hand, the participants’ pant pockets and a backpack. We developed and tested cut-point and ML methods based on Actigraph counts and on raw accelerometer data.
Methods
Design
We used a lab-based protocol combined with a cross-sectional concurrent validation study design.13 14 Participants engaged in a 65 min protocol with 40 min of total treadmill time and 25 min of sitting or lying time. The protocol was like previous studies testing the reliability and validity of different commercial wearable devices.15 Figure 1 shows the lab-based protocol. Participant energy expenditure was measured for the entire study using the Oxycon Pro metabolic cart (Oxycon Pro, Jaeger, Hochberg, Germany). The Oyxcon Pro has been shown to be a valid and reliable method for measuring energy expenditure.16 The metabolic cart was calibrated according to manufacturer specifications every morning of data collection. The study starts with 5 min of lying down, followed by a 5 min sitting period. Then, participants walk on a treadmill for 10 min at their self-paced speed. After that, they lay down for another 5 min before walking at 3 METs for 10 min. After that, they lie down for 5 min and walk/jog at 5 METs for 10 min. The next step is sitting for 5 min, and finally, they end with a jog at seven METs for 10 min to finish the study. Data were collected between 7 January 2019 and 9 May 2019.
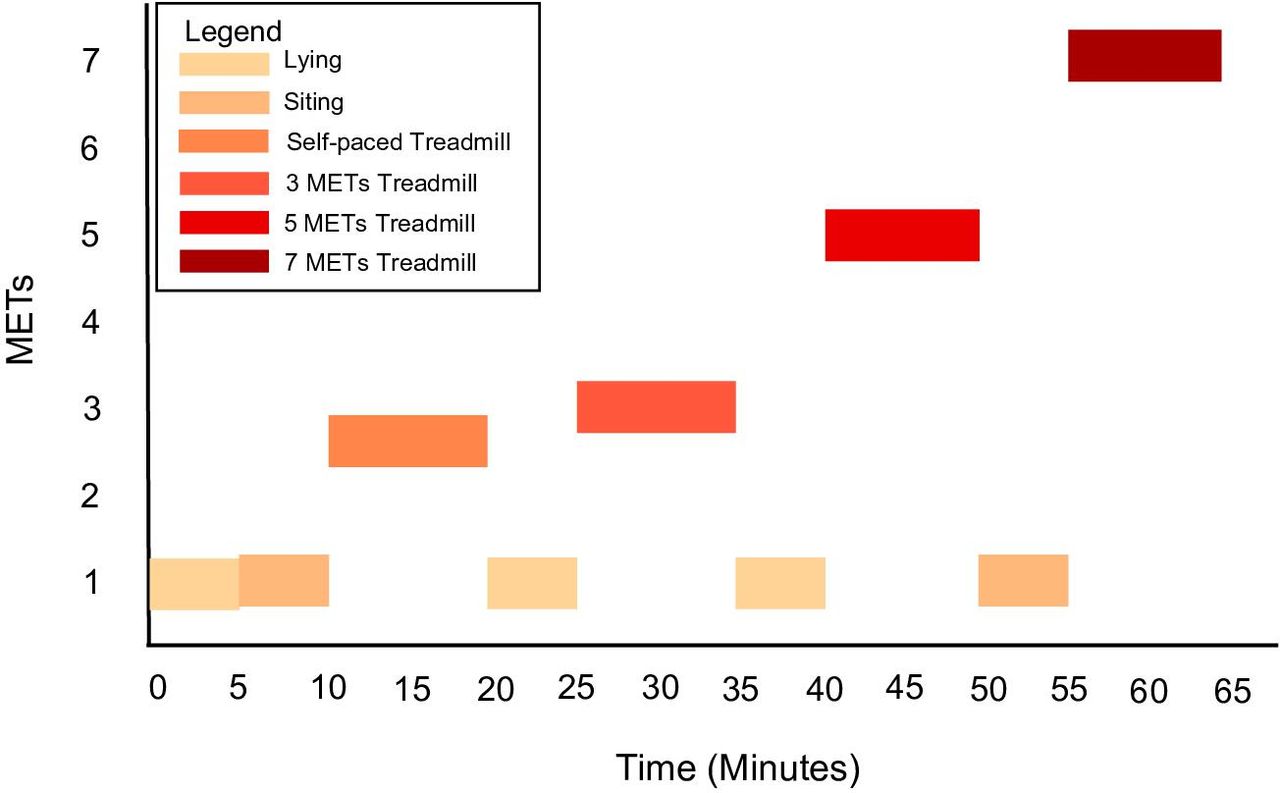
Sixty-five minute lab-based activity protocol. MET, Metabolic Equivalent Task.
Participants
Forty-four participants completed the lab-based protocol while carrying a Samsung Galaxy S7 phone in three locations: their right pocket, in a backpack and in their right hand. Participants were recruited using social media posts and through word of mouth among lab members. Inclusion criteria included being over 18 years of age and completing the Physical Activity Readiness Questionnaire.17 Participants were not provided any compensation. Ethical approval was obtained from the Memorial University Interdisciplinary Committee on Ethics in Human Research (ICEHR #20180188-EX). All participants provided signed informed consent.
Measures
The outcome variable for the study was activity types/intensities based on the activities performed and the measures from the Oxycon Pro metabolic cart. The outcome variable includes, for every second of the protocol, a label for one of six activity types/intensities; lying, sitting, walking self-paced, three METs, five METs and seven METs. We used Equation 1 to calculate METs while for each participant and used this as a guide the participants during the protocol.

Equation 1. MET based on participant’s oxygen consumption rate and weight
Participants demographics were collected, which included participants’ age, weight in kilogram, height in centimetre and sex (male or female). We used a Samsung Galaxy S7 (SM-G930W8) and Ethica Data18 app to record the accelerometer data in x, y and z directions. The X-axis is a horizontal line from the left side of the cell phone screen to the right side. The Y-axis starts from the bottom of the screen and points to the top, and the Z-axis comes out of the screen and is perpendicular to the screen. Unlike hip and wrist-worn devices, the relative position of the phone is not fixed, meaning the axes can be in any direction depending on the orientation of the phone.
Data analysis
Data analyses were conducted using R (V.3.6.1). Analysis included raw accelerometer data resampling and imputation, Activity counts calculation, feature extraction, feature set definition and model selection.
Resampling and imputation
Raw accelerometer data from the phone did not have a constant frequency. The average frequency was 17 Hz with a range of between 5 Hz and 100 Hz. The frequency of accelerometer data collection varies because the Ethica Data app encrypts data and optimises the amount of data being uploaded to the server in order for the app not to shut down by the operating system.19 20 We resampled the frequency for all seconds to 30 Hz using a published resampling method.21 Imputation is the process of replacing missing data. It is crucial to deal with missing values to create a data set that can lead to an accurate prediction. Some of the ML algorithms are more resilient to missing values; however, we need to manage missing values prior to creating and training the models. Before introducing imputation techniques, it is useful to examine why some values are missing. The mobile app stopped recording acceleration for some periods to encrypt and send data to the server. These periods were random throughout the data collection. We consider the data to be missing at random. We imputed the missing values by linear interpolation method. We used the ImputeTS R package, which provides an easy-to-use function for linear imputation.22
Actigraph counts
Using a published method to convert raw accelerometer data to Actigraph counts,23 our lab developed and used an R package called, activity Counts, to calculate Actigraph counts.24
Feature extraction
We calculated a set of 58 published features12 for both the raw accelerometer data and the Actigraph counts. We selected a one second window to generate the features from the raw accelerometer data. For the activity counts, a window of 5 s was used to create features.
Feature set definition
We generated four different cases to train our models. The target variable in each case is the same activity type/intensity as defined by the lab-based protocol (sitting, lying, walking self-pace, running three METs, running five METs and running seven METs). In each case, we used a different combination of the available data. For case one, we used only the raw accelerometer data at 30 Hz as the predictive features to classify the dependent variable, activity type. For case two, the predictive feature is the vector magnitude of the Actigraph counts at 1 Hz, and the target variable is the activity type. For case 3, we chose the raw acceleration data and the features derived from the raw acceleration data to classify activity type. We used 58 features each with a frequency of 1 Hz as predictive variables. Case 4 used activity counts and the features created based on activity counts at 0.2 Hz as the predictive features.
Model selection
All features were centred (normalised to the mean of 0) and scaled (normalised to an SD of (1) before being used with the ML algorithms. We tested six different classification models, support vector machines (SVM), Naïve Bayes, Random Forest (RF) classifiers, linear discriminant analysis (LDA) algorithm, k-nearest neighbours algorithm (KNN) and the ‘C5.0’ algorithm, an improved version of the C4.5 algorithm, which creates Decision Trees. Most of these models have previously been used in physical activity research using research-grade accelerometers.25 The data were split with a ratio of 70% to 30% for training and testing sets, respectively. We calculated accuracy, the area under the curve (AUC) of the receiver operating characteristic curve, and the area under the Precision-Recall curve to compare the models’ performance.26 We computed and compared confusion matrices for all models. We used the caret27 R package to compute all models. This package is an interface for ML algorithms and calls other packages to generate a model. We used the Ranger package to implement RF as it is claimed to be the fastest and most memory efficient RF implementation for large datasets.28
Results
Our participants were 26 women and 18 men. The average age was 30.2 years, with a minimum of 18 and a maximum of 56 years. The average height and weight were 169.5 cm and 69.8 Kg, respectively. We did not collect data on the handedness of participants but all participants held the phone in their right hand. In total, we collected 1 74 004 s of raw accelerometer data. After data cleaning the data contained 5 220 120 rows in the x, y and z directions with a frequency of 30 Hz.
We applied all ML models to case 1 and case 2 and examined the model fit. Since our data set was large, SVM and LDA were unable to converge, and KNN was also computationally expensive. RF had the best performance among all models, while C5.0’s performance was slightly worse than RF. We then applied the RF model to each case. Table 1 shows the RF model performance metrics for each case. Table 2 shows the precision for each activity class/intensity based on the RF model.
Performance of Random Forest algorithms for four difference cases in three phone locations; right hand, right pocketand backpack
Precision of Random Forest algorithms for each activity class/intensity for two cases in three phone locations; right hand, right pocket and backpack
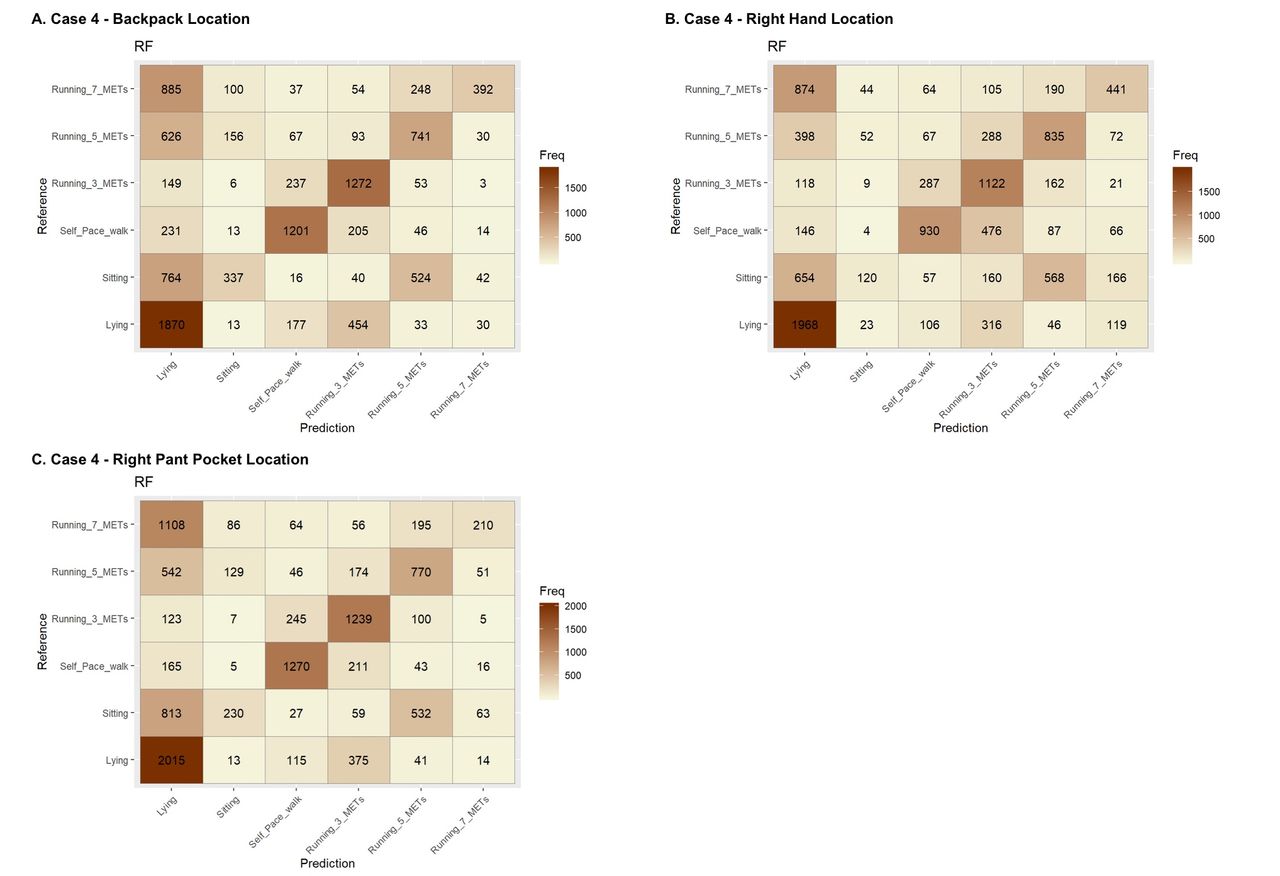
For case 1, including only the raw x, y, z acceleration measures, the accuracy was relatively low. The accuracies were 66.8%, 67.2% and 69.3% for the right hand, right pocket and backpack locations, respectively. Case 2, the Actigraph counts, performed very poorly in phone locations, with accuracies of 40.3 for right hand, 39.7 for right pocket and 40.4 for backpack. Case 3, which included the 58 features derived from the raw accelerometer data at 1 Hz, had the best performance for all phone locations. The accuracy was 89%, 92.9% and 90.8% for the right hand, right pocket and backpack phone locations, respectively. In case 4, we included 58 features derived from Actigraph counts at 0.2 Hz. In this case, the model could not perform reasonably and had an accuracy of 48.5%, 51.4% and 52.1% for the right hand, the right pocket and the backpack location, respectively. Figures 2 and 3 show the confusion matrices for case 3 and case 4 in each wear location.
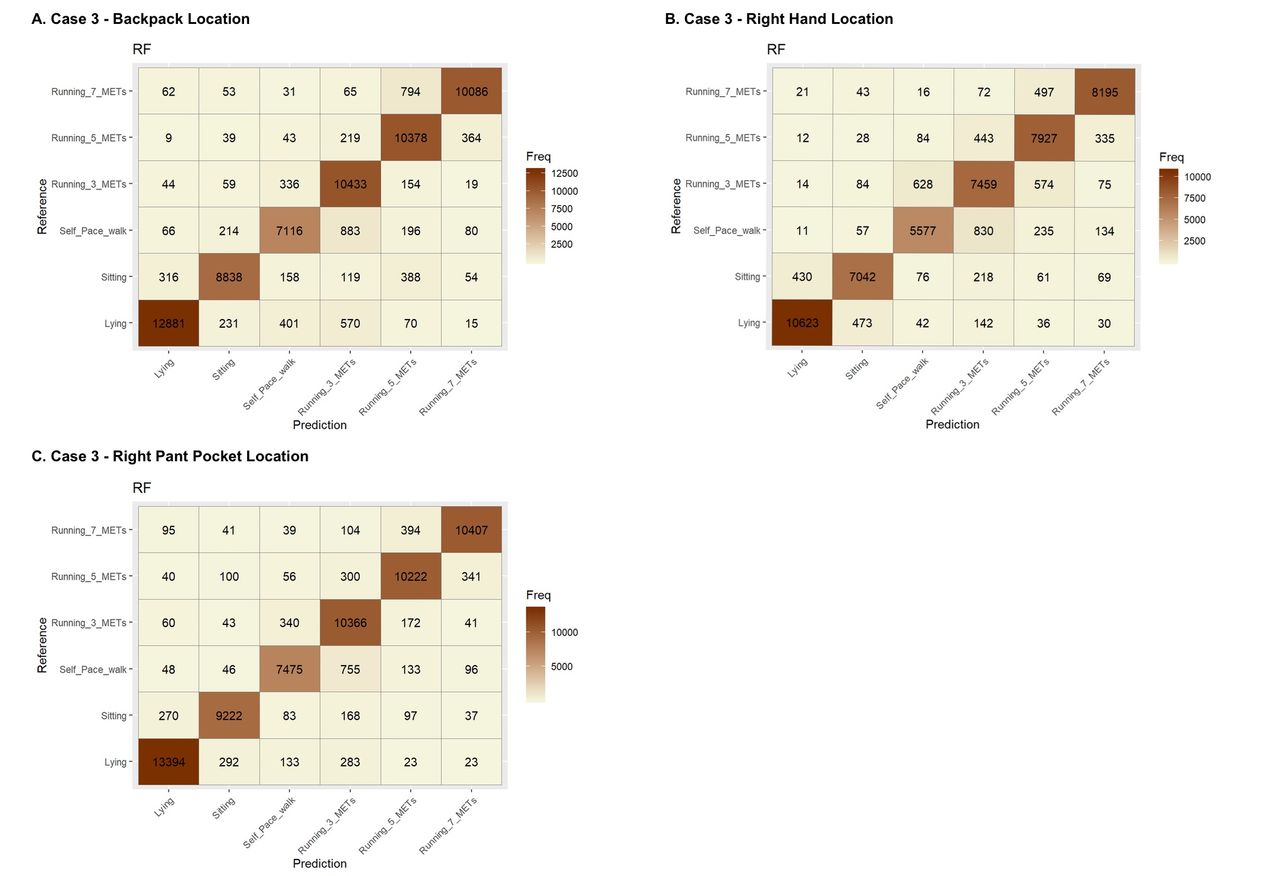
Confusion matrices for case 3, raw accelerometer data, at the backpack (Panel A), right hand (Panel B), and pants pocket (Panel C), wear location using Random Forest models. MET, Metabolic Equivalent Task; RF, Random Forest.
Confusion matrices for case 4, Actigraph counts, at the backpack (Panel A), right hand (Panel B), and pants pocket (Panel C) wear locations using Random Forest Models, MET, Metabolic Equivalent of Task, RF, Random Forest.
To understand which features of the 58 included in the model were the most important, we applied feature ranking methods. The Ranger package uses a method introduced by Janitza et al29 to calculate feature importance. This method is built on a revised permutation variable importance inspired by cross-validation procedures. Table 3 shows the top 10 determining features for each case calculated by RF. In case 1, the raw accelerometer in y direction has the most effect on the model. Case 2 has only one predicting feature, the vector magnitude of activity counts. In case 3, the SD of raw accelerometer data in the Y-axis is the most deciding predictor. Sum of counts’ log-energy in the Y-axis is the most important features for case 4. As would be expected if the phone were vertical, features based on the Y-axis are the most important.
Feature importance ranking for all cases
Discussion
The purpose of this study was to examine whether a smartphone’s accelerometer could predict lying, sitting and walking/running at different intensities when the phone wear location is known. We applied previously used methods including a cut-point and ML-based approach. The results indicate that using generated features based on the raw accelerometer data in combination with the RF algorithm can lead to accurate predictions of activity types/intensities in laboratory settings using a smartphone.
The literature suggests that achieving classification accuracies over 90% is common when predicting activity type or intensities using research-grade wearable devices.30–34 This seems to be true whether the prediction classes are based on activity that includes a combination or type and intensity as was done in this study, or more general activity types (eg, recreational or household) or activity intensities. Previous research examining activity types/intensities for smartphones to predict activity types/intensities has also shown high accuracy.5 35 To our knowledge, most of this work has used activity types or activity intensities, with only two studies combining activity types and activity intensities.7 8 This work will allow for the application of either our cut-point or ML approach to smartphone accelerometer data for physical activity measurements related to our specific activity types/intensities. To facilitate this work, we have published all of the code for creating the features and pretrained ML models on Github.36
The findings related to each specific wear location are also interesting. The accuracies for the right pocket and backpack location tended to be higher compared with the other locations for both case 3 and case 4. This may be because the location of the device was less impacted by small movements of the hand or that the features developed were not able to distinguish these small movements. In all cases and for all phone locations, low accuracies appear to be due to a lack of sensitivity of the model, rather than a lack of specificity.
Related to physical activity measurement, there are several implications of this work. First, resampling is acceptable in the context of accelerometer data for physical activity. There has been debate about resampling in the literature.9 Our approach demonstrates that resampling is feasible and unlikely to affect the results of ML models. Second, RF is a good modelling choice to classify physical activity type. While various ML approaches have been used, RF is feasible in terms of accuracy and computation time. The findings of this paper are consistent with a recent systematic review that shows that RF is one of the most common methods used for activity classification using accelerometer data. Third, using only a few features can adversely affect the prediction accuracy.37 This was true for both raw accelerometer data and activity counts. This could be because of the type of ML, as deep learning models have been used successfully with raw accelerometer data.5 38 For activity counts, our approach is akin to using a cut-point-based approach with only one feature being used for classification. Our results suggest that for problems involving both activity type and activity intensity classification, cut-point-based approaches are unlikely to be a viable solution. Using feature engineering techniques such as feature generation to expand the feature domain can substantially improve the results. Moreover, our findings assert that using raw accelerometer data and their derived features is superior to using activity counts. One explanation for this is that we lose some of the data’s predictive power when activity counts are created from the raw accelerometer data. After creating activity counts, even expanding the feature domain by creating new features cannot yield satisfactory results.
We generated new features for two main reasons. First, using these features can increase the accuracy of the prediction. Second, by selecting a window size for feature generation, we can reduce the size of the input data and improve the classification speed. For example, if the size of the input is one million with a frequency of 100 Hz, by using a window of one second for feature generation, the size will reduce to 10 000 observations.12
Limitations
In this study, we used one type of smartphone to collect raw accelerometer data. Since the accelerometers in smartphones vary, different phones could have different measurement accuracies, thus the performance of ML models may vary by smartphone type. Another limitation of this study was that we knew the device location. In real-life conditions, determining device location prior to performing any activity classification is crucial. Finding the device location using multiple smartphone sensors such as accelerometers and gyroscopes sensors could increase physical activity classification accuracy from smartphone data. However, it will increase the data intensity of developed methods. A combination of asking participants on a survey where they typically have their phone, combined with our approach, may be feasible for certain types of studies. Our protocol was comprised of several physical activities in lab settings. In our study, free-living activities, such as doing house chores, watching TV and playing sports, were not tested, and those activities need to be investigated more carefully. Our protocol did not include standing as an activity type. As a result, our models are not able to distinguish anything about standing. The misclassification of the ML models tended to be in the lying position. The mostly likely explanation for this is that there was a very short transition period between lying and the other activity types. As a result, the model likely classified more walking at different intensities as lying during this transition period. Finally, we only examined a few ML algorithms; therefore, we suggest that future works should test more ML algorithms such as neural networks and boosting methods.
Conclusion
Our results suggest that using smartphones to classify activity types/intensities that include physical activity intensities in lab settings can be accurate. The RF algorithm we used performed consistently compared with previous work. Expanding the feature domain by generation new features improves classification performance. Moreover, our results indicate that the best classification performance is obtained by applying RF on the features generated from the raw acceleration data, while using activity counts reduces prediction accuracy.
Data availability statement
Data are available upon reasonable request. Please contact the corresponding author to request study data.
Ethics statements
Patient consent for publication
Ethics approval
This study involves human participants and was approved by Interdisciplinary Committee on Ethics in Human Research ((ICEHR #20180188-EX) Participants gave informed consent to participate in the study before taking part.
References
Footnotes
Twitter @walkabilly
Contributors DF conceptualised the paper. All authors assisted with data collection. DF, SJK, JRA, AB, FB conducted data analysis. All authors contributed to writing the manuscript and approved the submitted version. DF acts as the guarantor for this study.
Competing interests None declared.
Patient and public involvement Patients and/or the public were not involved in the design, or conduct, or reporting, or dissemination plans of this research.
Provenance and peer review Not commissioned; externally peer reviewed.