Article Text

Abstract
Objectives This study aimed to describe the injury epidemiology of domestic and international level male New Zealand cricketers from seasons 2009–2010 to 2014–2015 across all match formats given the increasing popularity of T20 cricket.
Methods Match exposure and injury surveillance data collected prospectively by New Zealand Cricket was analysed using international consensus recommendations for injury surveillance and reporting in cricket. Relationships between playing level, role and injury were statistically analysed.
Results A total of 268 elite male New Zealand cricketers from seasons 2009–2010 to 2014–2015 were analysed from the New Zealand Cricket injury surveillance system. Total new match injury incidence rates were 37.0 and 58.0 injuries per 10 000 player hours in domestic and international cricket, respectively. Total new and recurrent match injury incidence in international cricket was approximately 1.7 times higher than domestic cricket (277.6 vs 162.8 injuries per 1000 player days). Injury prevalence rates were 7.6% and 10.0% in domestic and international cricket. The hamstring (8.2%) in domestic cricket and the groin (13.5%) in international cricket were the most injured body sites. Most match days lost in domestic cricket were to the lumbar spine (417 days), and groin in international cricket (152 days). There were statistically significant differences in injury between domestic and international level cricketers (χ2=4.39, p=0.036), and playing role (χ2=42.29, p<0.0001).
Conclusions Total injury incidence rates in elite New Zealand cricket increased in 2009–2015 compared with previous data. International-level players and pace bowlers were the most injured individuals.
- cricket
- injury
- epidemiology
- sport
Data availability statement
All data relevant to the study are included in the article or uploaded as online supplemental information.
This is an open access article distributed in accordance with the Creative Commons Attribution Non Commercial (CC BY-NC 4.0) license, which permits others to distribute, remix, adapt, build upon this work non-commercially, and license their derivative works on different terms, provided the original work is properly cited, appropriate credit is given, any changes made indicated, and the use is non-commercial. See: http://creativecommons.org/licenses/by-nc/4.0/.
Statistics from Altmetric.com
Key messages
What is already known?
T20 cricket has become an increasingly popular and competitive match format across domestic and international competitions.
The physical demand between cricket match formats varies, with T20 cricket comparatively shorter in duration but more intense.
Injury surveillance reporting guidelines have been updated to consider the shorter duration of T20 cricket.
The impact of T20 cricket on injury rates within elite New Zealand cricket is not known.
What are the new findings?
The injury incidence rates in this population have increased, compared with the previous surveillance period, and the effectiveness of future strategic injury prevention can be measured against this data.
Total new and recurrent match injury incidence rates per 1000 player days were higher in international level players with a statistically significant difference between injured, non-injured players and playing level.
A high proportion of injuries and match days lost were to the lower limb and lumbar spine. Selecting relevant prevention strategies may therefore reduce injury burden.
Pace bowlers were the most injured players with statistically significant differences comparing injury and playing role.
Introduction
New Zealand Cricket (NZC) has maintained an injury surveillance system since 2002, with descriptive injury epidemiology from seasons 2002–2003 to 2007–2008 previously published by Frost and Chalmers.1 At that time, the T20 format was seen as a novel style of play rather than a serious competitive format. Since this publication, the T20 format has been established as a mainstream style of cricket growing in popularity and commercial nature.2 The inaugural T20 World Cup was held in 2007, at the end of this first surveillance period, and there have now been six T20 World Cups in total as well as lucrative professional T20 leagues emerging globally.
T20 cricket requires different physical demands of players compared with other formats, therefore, cricketers are exposed to new workloads and playing intensities regardless of playing role.3 4 T20 is shorter and more intense due to being restricted to 20 overs per side, compared with the 50-over one-day game, and multiday first-class and test cricket matches. Increasing physical demands can subsequently increase injury incidence and injury risk.5 6 Injury can result in many negative consequences including health impacts, future sporting aspiration and success, and future injury risk7–9 whereas reducing injury burden has positive impacts on athletic performance.8 10 Recent injury incidence increases have been reported in cricket and presumed to be associated with the increase of T20 cricket played.2 11
The impact of T20 cricket on the injury rates of elite New Zealand cricketers is not known. To understand the influence of T20 cricket on injury incidence and prevalence, an injury epidemiology update is required, as injury surveillance is considered a vital process for successful injury prevention.12 This study aimed to conduct an update of the injury epidemiology within elite NZC from 2009 to 2015 to compare with the previous New Zealand study using consistent and contemporary research methods.13 14
Methods
A retrospective epidemiological database analysis was performed on elite male New Zealand domestic and international level cricketers from seasons 2009/2010 to 2014/2015. To maintain consistency with previous epidemiological research in NZC,1 definitions and methods described by Orchard et al13 were followed. Since this publication, the consensus statement on injury surveillance and reporting in cricket has, however, been updated.14 Therefore, where appropriate, the contemporary definitions and methods described by Orchard et al14 were also used.
Data collection and surveillance
Injury and exposure data were prospectively recorded for the NZC injury surveillance system by the physiotherapist of each of the six New Zealand domestic cricket teams and the New Zealand international representative team, then reviewed for accuracy of recording by the NZC injury surveillance coordinator. All match exposure and injury data were captured for seasons 2009/2010–2014/2015 inclusive. Training or non-match exposure was not collected. The surveillance period for each season was consistent with the playing schedules of each squad.14 The New Zealand domestic cricket competition is played from October to April. The New Zealand international team season was active from July to June the following year. Players selected to represent New Zealand at international level were drawn from this domestic cohort and could therefore be counted as domestic or international players through various times of the season, and could be analysed as separate cohorts. Major matches under surveillance were first-class, one-day and T20 matches in the domestic cricket competition. International cricket matches under surveillance were one-day, test and T20 matches. Warm-up matches at either competition level were not included in the surveillance period. Match exposure was recorded for days of actual play, therefore, match days cancelled due to poor weather or days not played due to a match finished early were not included. Player roles were defined per Frost and Chalmers.1
Injury definition
The definition of injury was consistent with the original injury surveillance consensus statement in cricket as this was the method of injury recording over the surveillance period.13 Injuries were defined by match time-loss as any injury or other medical condition that prevented a player from being fully available for selection for a major match, or during a major match, caused a player to be unable to bat, bowl or keep wicket when required by either the rules or the team’s captain.13 Illness was considered to be inclusive of injury. Injuries were classified by the team physiotherapists using the Orchard Sports Injury Classification System (OSICS).15 Match injuries were reported as either a new injury or a recurrence. New and recurrent training injuries were also recorded although training exposure hours were not. General time-loss, medical attention, player-reported and imaging-abnormality injuries were not recorded in the NZC injury surveillance system over this period. An injury was considered to have recovered once a player was able to return to full participation in at least one competitive match of any format. A recurrent injury was defined as an injury of the same type occurring to the same side and body part as an injury earlier in the same season which had recovered.
Match injury incidence
Match incidence applied only to injuries incurred in a competitive match. Match injury incidence was expressed per 10 000 player hours as the number of new (excluding recurrent) injuries divided by the total hours of exposure13 consistent with previously published data.1 Match injury incidence was also expressed per 1000 player days as the number of new and recurrent injuries divided by the total player match days for consistent reporting with the updated consensus statement.14 The format and number of matches played can be seen in online supplemental table S1.
Supplemental material
Match injury prevalence
Match injury prevalence was calculated as the number of missed match days divided by the total number of match days multiplied by the number of squad members,14 expressed as a percentage to represent the percentage of players unavailable through injury.
Total injury incidents and match days lost
To capture the total number of injuries incurred and their impact, the number of new and recurring injuries from matches and training, and match days lost were drawn from the dataset, expressed by body site. If a correctly recorded injury was missing an OSICS code15 it was labelled in the dataset as ‘unconfirmed’ as it was not possible to retrospectively confirm the body site injured.
Data analysis
These data were collated into a separate Microsoft Excel database and given to the primary researcher with players assigned identification numbers to maintain anonymity. A database was prepared using IBM SPSS Statistics for Mac, V.25 (IBM). Each non-injury, new or recurring match and training injury was recorded as a data point in the injury surveillance dataset for each season, capturing 991 domestic and 281 international cricket data points totalling 1272 final dataset entries for the entire surveillance period. All data were initially analysed descriptively to ensure there were no extreme outliers or duplicates. Continuous data were assessed for normal distribution. Means and SDs were calculated. Frequencies were calculated for categorical data. Descriptive analysis was performed to determine injury frequency and match days lost, injury incidence rates and injury prevalence rates. Age differences between domestic and international level playing groups were analysed using t-tests. While the international level players were selected from the domestic competition group, the analysis was conducted assuming these players were from different cohorts. χ2 analysis was used to assess for differences between injured and non-injured domestic and international level playing groups and playing roles. Alpha levels were set at 0.05 (95% confidence level).
Patient and public involvement
Patients and/or the public were not involved in the design, or conduct, or reporting, or dissemination plans of this research.
Results
In total, injury data from 268 domestic level cricketers, of which 67 were also international level cricketers was recorded from seasons 2009/2010–2014/2015. Domestic level cricketers were aged between 17 and 40 years (mean=28.2, SD=4.6) and International cricketers between 18 and 38 years (mean=28.9, SD=4.0). Player age was normally distributed collectively and per playing level. An independent samples t-test demonstrated no significant difference in age (p=0.07) between playing levels.
Injury incidence
The highest total new match injury incidence rate per 10 000 player hours (table 1) over the surveillance period was in the T20 format for both domestic (74.5 injuries per 10 000 player hours) and international cricket (144.2 injuries per 10 000 player hours). The one-day and first-class domestic match formats had similar incidence rates but were less than half the match incidence rate of T20 cricket. International one-day cricket recorded the second-highest overall new match injury incidence rate of 92.7 injuries per 10 000 player hours. The match injury incidence rate of all total formats for international level cricket (58.0 injuries per 10 000 player hours) was 57% higher than in domestic cricket (37.0 injuries per 10 000 player hours).
Match injury incidence rates per 10 000 player-hours per season
When match injury incidence rates are expressed per 1000 player days (table 2), the one-day format in both domestic cricket (185.7 injuries per 1000 player days) and international cricket (486.0 injuries per 1000 player days) has the highest injury rate of all formats. International T20 and one-day formats are also observed to be more than double the domestic formats. The total match injury incidence for all formats of international cricket of 277.6 injuries per 1000 player days was 71% higher than the domestic rate of 162.8 injuries per 1000 player days.
Match injury incidence rates (new and recurrent injuries per 1000 player days) per season
Match prevalence
The overall match injury prevalence for the surveillance period was 7.6% in domestic cricket, and 10% in the international team (table 3).
Injury prevalence rates (%) per season
Injuries per playing level and role
A statistically significant overall difference between injured and non-injured domestic and international level cricketers (table 4) was identified with a χ2 test (χ2=4.39, p=0.036). Over the surveillance period, the percentage of injuries recorded annually compared with not being injured in international players (50.5%) was 7% higher than the number of injuries in domestic players (43.5%). A statistically significant difference between player role and being injured or not injured was identified with a χ2 test (χ2=42.29, p<0.0001). In the total cohort of players, spin bowlers were the least injured (29.9%), followed by wicket-keepers (31.8%), then batters (41.6%). Pace bowlers were the most injured (54.3%).
Injuries per playing level and role (% total) from seasons 2009/2010 to 2014/2015
Injuries by body site and match days lost
Figure 1 describes the total number of new, recurrent, and training injuries per body site for domestic and international competition. In the domestic competition the hamstring was the most frequently injured body site (34 injuries, 8.2% of total), followed by the lumbar spine (32, 7.7%), knee and groin, (30, 7.2%) shoulder, finger, and side (28, 6.7%) and ankle (37, 6.5%). In international competition, the most frequently injured body site was the groin (17 injuries, 13.5%), followed by the lumbar spine (13, 10.3%), hamstring and illness (10, 7.9%). Lower limb injuries were the most common body region injured in both playing levels (online supplemental table S2).
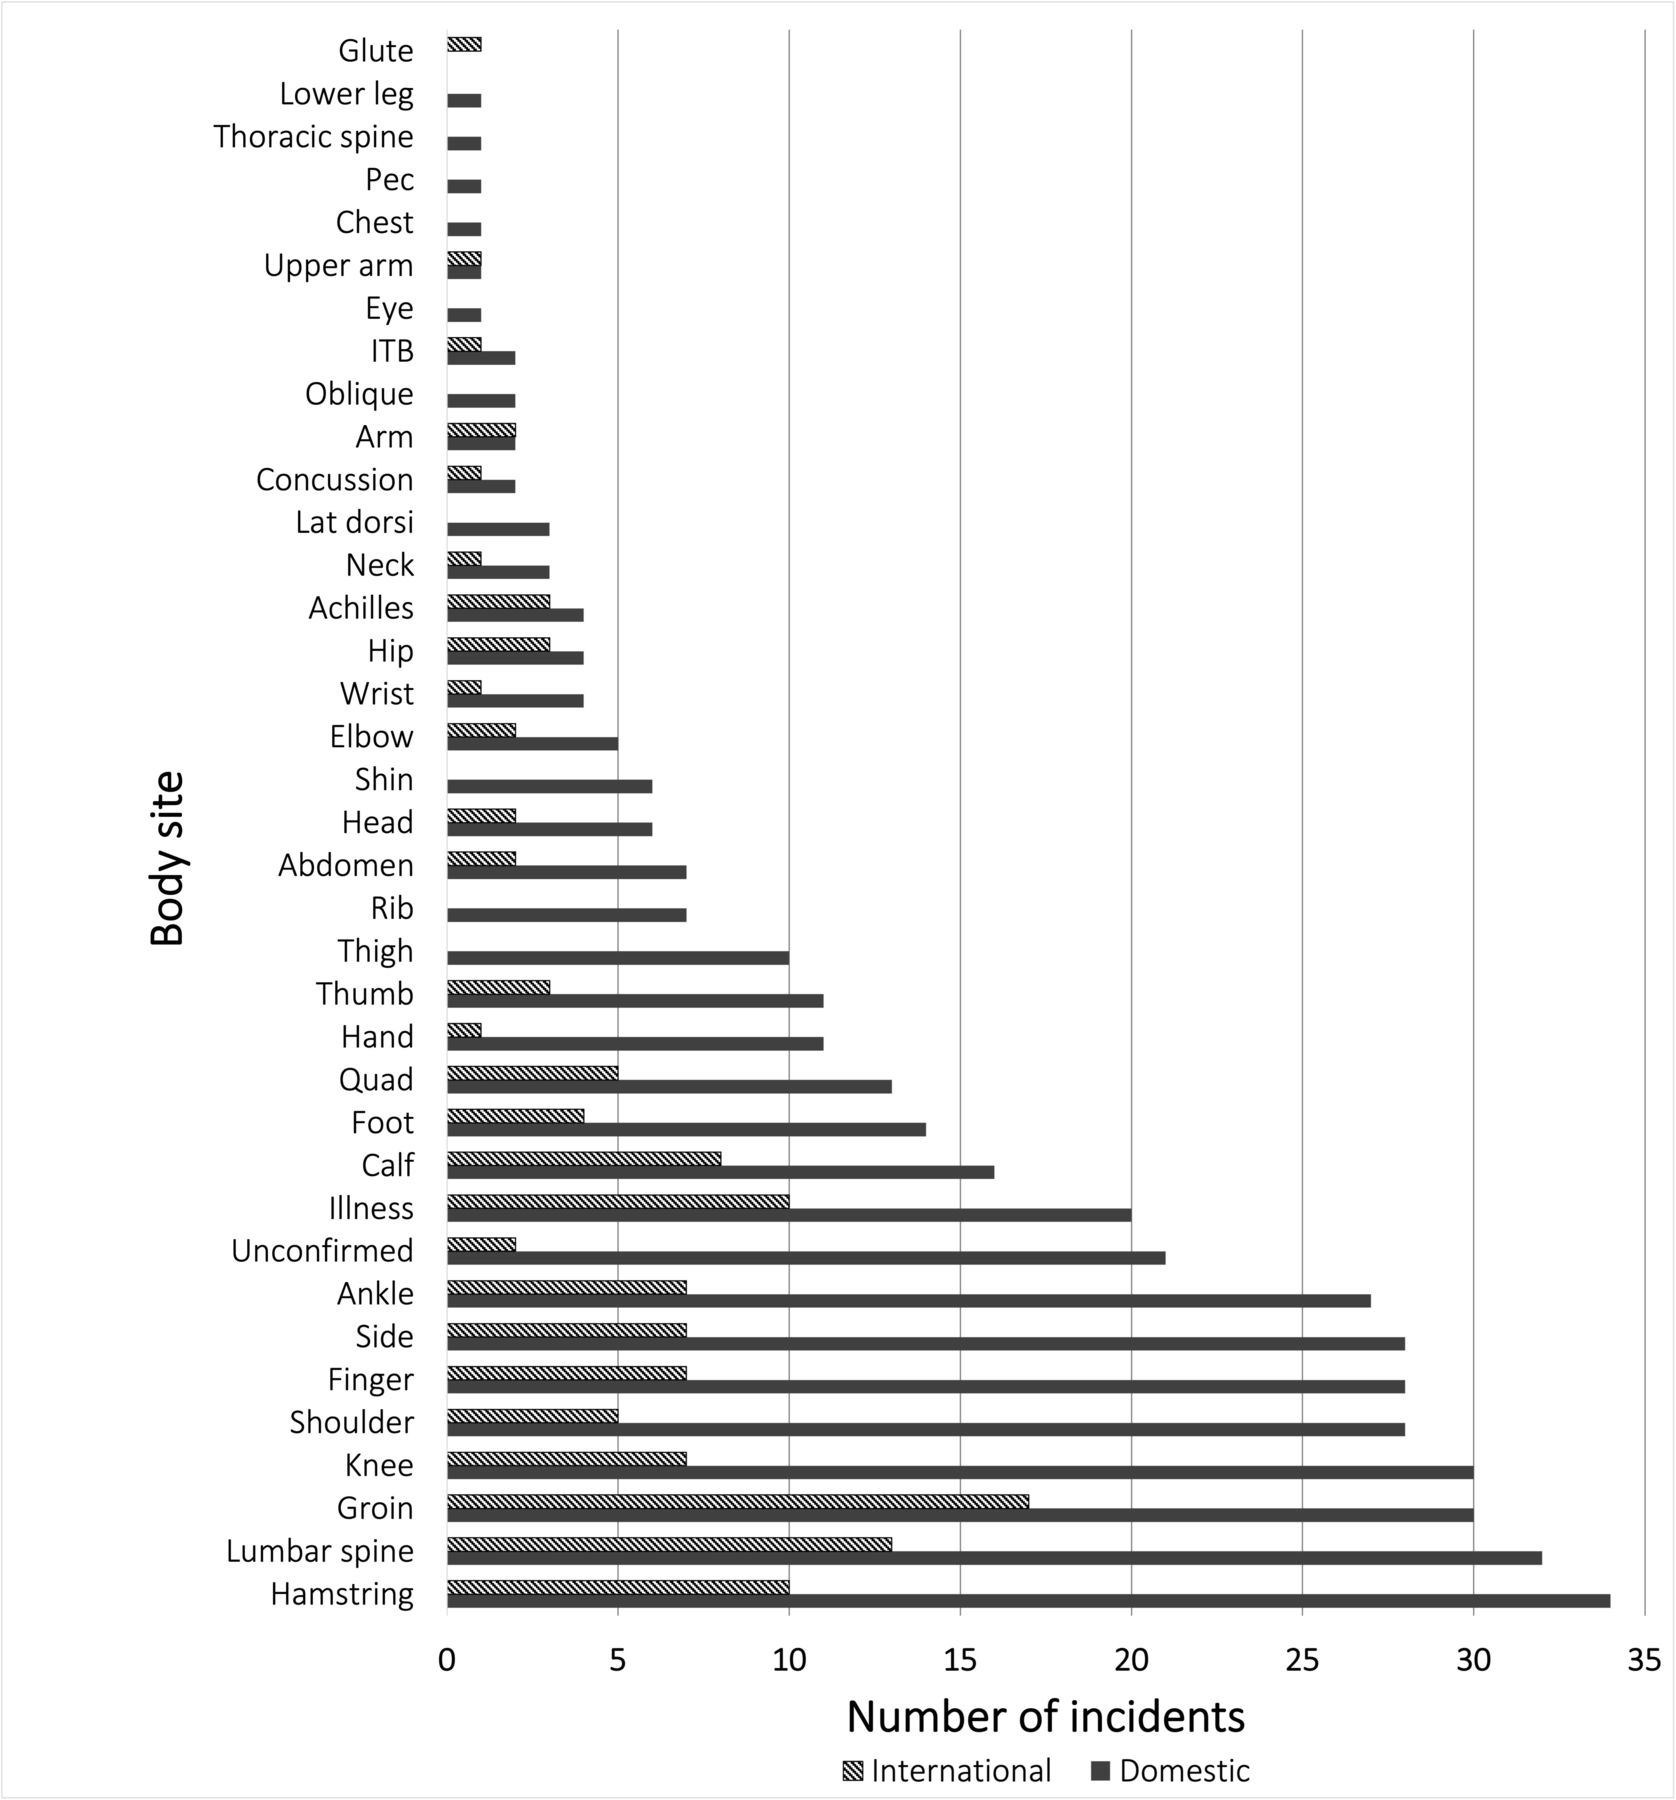
The total number of injury incidents recorded by body site from the 2009–2010 to 2014–2015 surveillance period in domestic and international cricket.
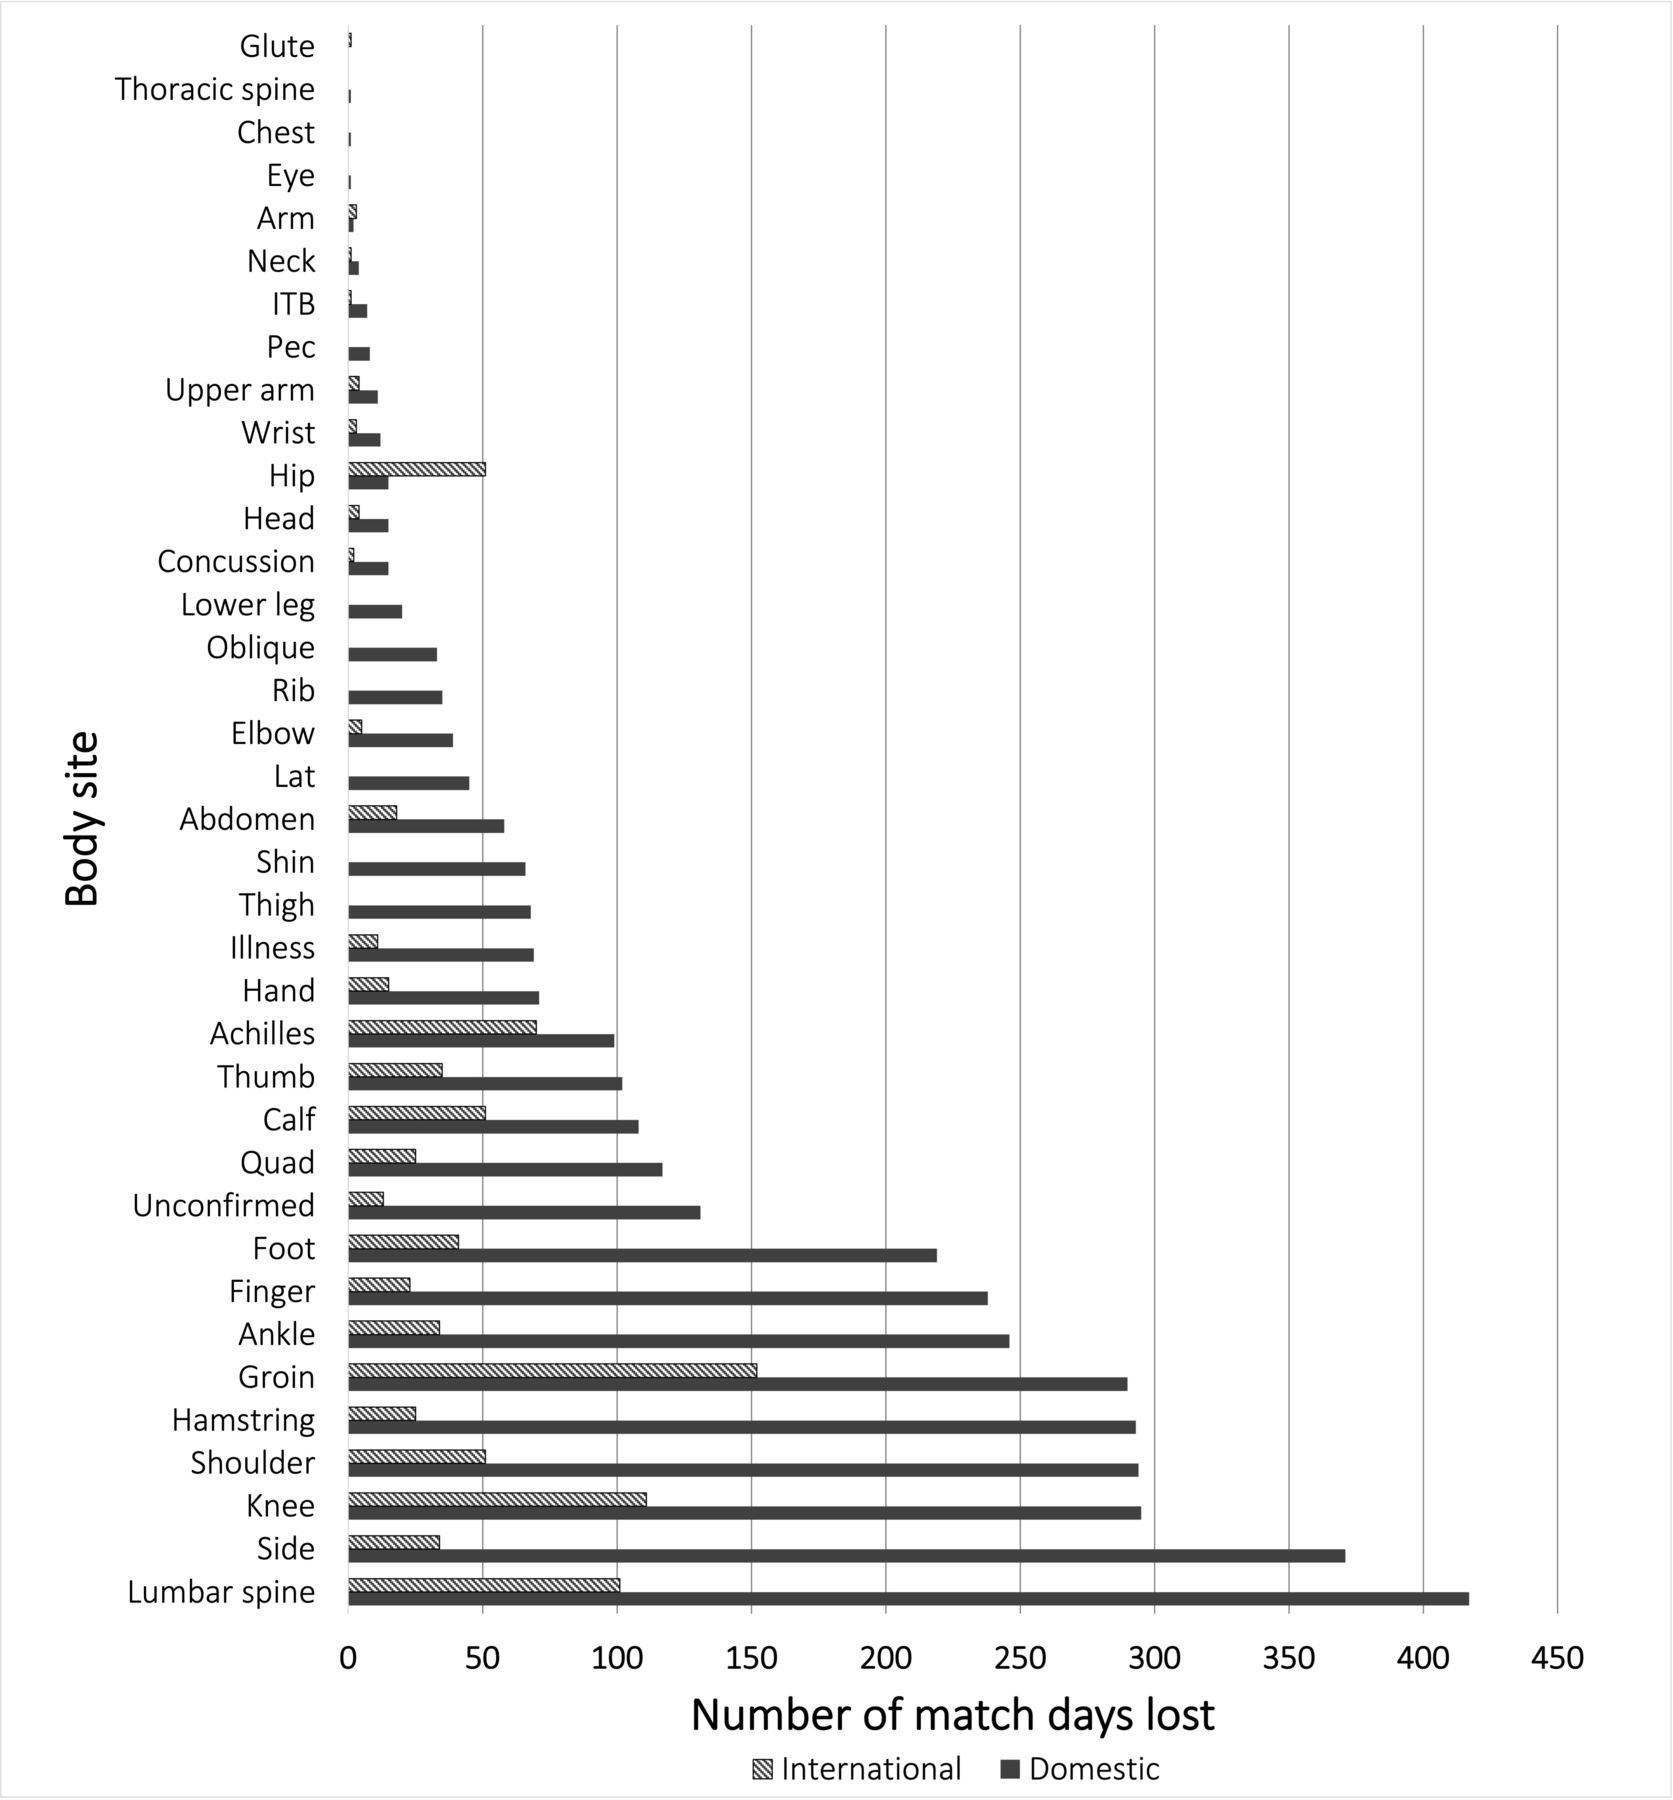
Lumbar spine injuries resulted in the most match days lost (417 days, 10.9% of total) in the domestic competition (figure 2), followed by side (371, 9.7%), hamstring, knee and shoulder (7.7%) and groin injuries (7.6%). In international competition, groin injuries (152, 17.2%) resulted in the highest number of lost match days followed by knee (111, 12.5%) and lumbar spine injuries (101, 11.4%). Lower limb injuries resulted in the most match days lost in both playing levels when viewed by body region (online supplemental table S3).

The total number of match days lost to injury recorded by body site from the 2009–2010 to 2014–2015 surveillance period in domestic and international cricket. ITB, iliotibial band.
DISCUSSION
Injury incidence
This study aimed to explore the injury incidence and prevalence rates within New Zealand over a period where T20 cricket gained international and domestic momentum as a serious competitive format. Methods for reporting incidence and prevalence rates remained consistent with previous research in NZC1 while also reporting match injury incidence rates per 1000 player days as per the updated cricket injury reporting consensus statement14 to facilitate comparison with contemporary research. Variance in matches played, and therefore, hours of exposure between seasons was observed over the surveillance period (online supplemental table S1).
The domestic T20 total new match injury incidence rate per 10 000 player hours was approximately 2.2 times higher than one-day and first-class injury rates. This is consistent with the 2002–2008 period1 though the match injury rate in T20 was not as high as the other domestic formats. The total new match injury incidence rate in T20 domestic cricket was higher in 2009–2015 compared with 2002–2008 (74.5 vs 45.8 injuries per 10 000 player hours). The combined total new match injury incidence for all formats also increased from 27.2 to 37.0 injuries per 10 000 player hours in this surveillance period. Full-time physiotherapists were introduced into domestic teams from season 2012/2013 with this increased presence of medical staff possibly influencing an increased reporting of injuries.
At international level, total new match injury incidence rates per 10 000 player hours for this surveillance were the highest total incidence rate per format was for T20 cricket followed by one-day matches, then test cricket, similar to 2002–2008. Total new match injury incidence rates compared with 2002–2008 for international T20, one-day matches and the overall combined format total. Similar injury incidence rate order of new and recurrent injuries per 10 000 player hours is seen in combined Australian national and international level female cricketers from seasons 2014/2015 to 2015/2016.16
Expressing match injury incidence per 10 000 player hours in this instance allows incidence rate comparison with previous research.1 However, the short match duration of T20 may result in reporting higher injury incidence rates per player hours due to fewer overs played compared with one-day and multiday matches.2 Measuring the number of injuries per 1000 player days is therefore recommended to better represent the actual risk.14 When injury rates were expressed per 1000 player days the one-day match format demonstrated the highest new and recurrent match injury incidence rate at both domestic and international levels. Our findings are consistent with similar studies in Australian domestic and international cricket, and English and Welsh domestic cricket which also reported the highest new and recurrent match injury incidence rate per 1000 player days in the one-day format.11 17 These consistent observations could support the notion that a denominator of player days is indeed more appropriate for comparison between match formats.
The shorter formats of T20 and one-day cricket are more intensive than multiday cricket, which may explain the higher match injury incidence rates in these forms of cricket in this study. T20 and one-day cricketers have demonstrated greater amounts of sprinting per hour compared with multiday cricket.3 One-day cricketers have also been reported to cover greater distances at faster running speeds, have less recovery time between efforts, and fielders cover greater distances compared with multiday cricket.4 Consideration of these variables could be included in future injury prevention strategies.
Playing level
Total new match injury incidence rates were higher in international than domestic level cricket in this cohort as well as a statistically significant difference between injured and non-injured players. The increasing popularity of T20 cricket has seen the rise of global T20 tournaments, providing opportunities for further play outside of New Zealand. Due to the commercial, competitive and performance-driven nature of these tournaments, players of international status are often recruited resulting in increased exposure to T20 cricket which is known to have increased physical demands.3 T20 cricket also introduces workload variability compared with other match formats. A bowler, for example, cannot bowl more than four overs in a T20 match but has no ruling limit in test cricket. Such spikes in workload are challenging to manage and fewer days rest due to increasing amounts of days played in a season have been shown to increase the risk of injury.18–28 This increase in T20 cricket may explain the higher injury incidence rates for international level New Zealand cricketers. While the in-match player movement of Australian domestic and international bowlers and fielders has demonstrated similar distances covered between playing levels,4 no current research has compared the physical demands of all match formats between domestic and international level play. Future research will help the understanding of any physical demand differences between playing levels.
Playing role
Pace bowlers are known to demonstrate the highest injury prevalence of all roles1 11 29 and were similarly the most injured playing role with statistical significance compared with non-injured players in this study. Practitioners may, therefore, choose to prioritise injury prevention intervention for pace bowlers and can be guided by several known injury risk factors for these players including workload,19–26 28 muscle morphology,30–33 lumbopelvic control and balance,34–36 lower limb mechanics,33 35 37 and previous injury.26 38
Injury prevalence
Compared with previous data, the total match injury prevalence rates in domestic cricket decreased slightly from 9.7% in 2002–2008 to 7.6% in this study, and from 12.0% to 10.0% in international cricket.1 An average match injury prevalence of all cricket formats in combined domestic and international Australian cricketers from 2006 to 2016 has been reported as a slightly higher 12.5%.11
Injury location and impact
In the international playing cohort, groin injuries were the most frequent incident and contributed the most match days lost. Compared with the 2002–2008 study by Frost and Chalmers1 the impact of groin injuries increased in this research period, being responsible for 13.5% vs 3.5% of all incidents and 17.2% vs 2.1% of lost match days. Lumbar spine injuries in domestic cricket contributed to the most match days lost to injury (417 days) but had reduced by 44.5% compared with 751 lost days from the 2002 to 2008 surveillance period.1 Injury to the ‘thigh’ recorded the highest number of incidents both in this and the previously studied domestic cricket cohort.1 Similarly, hamstring strains recorded the highest annual injury incidence in elite Australian cricketers.11
Limitations
As only exposure data for matches played was collected in the NZC injury surveillance system, injury was only considered when it affected the ability of a player to participate in a major competitive match. While match time-loss was the definition of injury in both original13 and updated14 cricket injury reporting consensus documents, this method alone has been reported to risk underestimating the true impact of injury.7 Multiple definitions of injury are now included in the updated reporting guidelines for future studies to provide a more accurate reflection on the injury incidence rates and the impact of injury.14 The lead researcher had no opportunity to influence the data fields as the surveillance database was set prior to this study. Match density in the playing schedule could also overestimate injury incidence and impact, while injuries at the end of a season could under-report burden as match days lost were no longer under surveillance. Although OSICS injury codes were used to classify injuries, unconfirmed injuries contributed to many incidents and days lost, implicating potential under-reporting of injury severity by body region. Finch et al39 suggest OSICS coding to a two-digit level is appropriate for epidemiological application. The number of unconfirmed injuries was also higher in domestic cricket where part-time medical staff were employed until 2012/2013 compared with a full-time medical team overseeing international players. Future databases will benefit from clearly differentiating regional or tissue-based injuries. Side, oblique and abdominal injuries were standalone diagnoses in this dataset that in the future may be grouped under one diagnostic region, which will facilitate reporting consistent with the International Olympic Committee injury surveillance consensus.40
Conclusion
This study provides an injury incidence and prevalence update within elite NZC from 2009 to 2015, capturing injury incidence and prevalence over a period where T20 cricket became increasingly prolific as a genuinely competitive format both domestically and internationally. The methods for data collection and reporting were consistent with earlier research from 2002 to 2008, then expanded using updated recommendations which will allow for comparison with future studies. International level New Zealand cricketers demonstrated a higher injury incidence than in domestic cricket, and higher rates in T20 and one-day formats. International level players and pace bowlers were the most injured individuals. Shorter forms of cricket are known to have high physical demand, and the increasing match exposure of global T20 cricket for these cricketers could be an influencing factor for higher injury rates. Consistent surveillance will continue to inform those working with cricketers what impact the growing popularity of shorter form matches have on player injury rates.
Data availability statement
All data relevant to the study are included in the article or uploaded as online supplemental information.
Ethics statements
Patient consent for publication
Ethics approval
The Auckland University of Technology Ethics Committee (AUTEC) granted ethical approval for this research, ethics application number 16/121.
Acknowledgments
The authors would like to thank the staff of NZC and the domestic cricket Major Associations involved with setting up, monitoring, providing data and processing the NZC injury surveillance system for analysis. We acknowledge the AUT staff who aided the statistical analysis and to AUT for granting research approval. This study was conducted from components of the lead authors Master’s research which was partly assisted with a Postgraduate Fees Scholarship from AUT.
References
Supplementary materials
Supplementary Data
This web only file has been produced by the BMJ Publishing Group from an electronic file supplied by the author(s) and has not been edited for content.
Footnotes
Contributors TD conducted this study and analysis with collaboration and supervision from DR. The injury surveillance system was implemented and supervised by DS. All authors contributed to review and critical appraisal of the final version of this paper. TD is the guarantor.
Funding The authors have not declared a specific grant for this research from any funding agency in the public, commercial or not-for-profit sectors.
Competing interests None declared.
Provenance and peer review Not commissioned; externally peer reviewed.