Article Text

Abstract
Objectives To determine whether the relationship between training load and injury risk is non-linear and investigate ways of handling non-linearity.
Methods We analysed daily training load and injury data from three cohorts: Norwegian elite U-19 football (n=81, 55% male, mean age 17 years (SD 1)), Norwegian Premier League football (n=36, 100% male, mean age 26 years (SD 4)) and elite youth handball (n=205, 36% male, mean age 17 years (SD 1)). The relationship between session rating of perceived exertion (sRPE) and probability of injury was estimated with restricted cubic splines in mixed-effects logistic regression models. Simulations were carried out to compare the ability of seven methods to model non-linear relationships, using visualisations, root-mean-squared error and coverage of prediction intervals as performance metrics.
Results No relationships were identified in the football cohorts; however, a J-shaped relationship was found between sRPE and the probability of injury on the same day for elite youth handball players (p<0.001). In the simulations, the only methods capable of non-linear modelling relationships were the quadratic model, fractional polynomials and restricted cubic splines.
Conclusion The relationship between training load and injury risk should be assumed to be non-linear. Future research should apply appropriate methods to account for non-linearity, such as fractional polynomials or restricted cubic splines. We propose a guide for which method(s) to use in a range of different situations.
- statistics
- injury
- training
- methodological
Data availability statement
Data are available in a public, open access repository. Data are available on reasonable request. Data used for simulations are available in a public, open access repository (https://github.com/lenakba/load-injury-non-linearity-study). The Norwegian elite U-19 football data, Norwegian Premier League football data and Norwegian elite youth handball data are available on reasonable request. These are anonymised based on requirements of the Norwegian Data Protection Agency. The removal of background variables for the anonymisation renders the data unusable for any reproducibility purposes; the data are only available for the sake of transparency.
This is an open access article distributed in accordance with the Creative Commons Attribution Non Commercial (CC BY-NC 4.0) license, which permits others to distribute, remix, adapt, build upon this work non-commercially, and license their derivative works on different terms, provided the original work is properly cited, appropriate credit is given, any changes made indicated, and the use is non-commercial. See: http://creativecommons.org/licenses/by-nc/4.0/.
Statistics from Altmetric.com
Key messages
What is already known?
Hypotheses suggest that the relationship between training load and injury risk is non-linear.
Methods used in previous training load and injury research often assume linearity.
Categorisation has been proven a suboptimal alternative for handling non-linearity.
What are the new findings?
A non-linear relationship (p<0.001) between session rating of perceived exertion and the probability of injury in elite youth handball players would not have been discovered if linearity had been assumed (p=0.24).
Acceptable Brier scores and C-statistics from a linear model do not mean that the relationship is linear.
Categorising training load by quartiles could not model a linear relationship under skewed data conditions.
Fractional polynomials and restricted cubic splines were the only methods capable of exploring non-linear shapes.
How might it impact clinical practice?
Clinical researchers will have the tools available to perform causal and predictive research on training load and injury risk more accurately.
More consistent methodology between training load and injury risk studies will improve comparability, reproducibility and facilitate meta-analyses.
Introduction
Injuries can hamper athlete and team performance in a variety of sporting disciplines.1 Overuse injuries, in particular, are considered preventable, and in the last decade, researchers have investigated how training load affects injury risk in different football codes and other sports.2 Results have been conflicting; some studies have found an increased risk with increased training loads, some have found that lower loads increase injury risk and some have found no association at all.3 4 Hence, the relationship between training load and injury remains uncertain.
In 2013, Gamble theorised a U-shaped relationship between training load and injury risk. Too little and too much load increases risk,5 with the middle section of the spectrum representing the lowest risk point. This hypothesis was revisited in 2016 by Blanch and Gabbett6 who, based on three training load-injury datasets in different sports, postulated a workload–injury relationship that closely resembled a J-shaped curve; however, the statistical methodology in that paper has been questioned.7 Gabbett8 theorised a non-linear relationship between training load and injury risk with the rationale that training load may increase the risk of injury and build beneficial physiological adaptations such as aerobic capacity and strength, factors associated with decreased injury risk. The hypotheses of both Gamble and Gabbett suggest a non-linear relationship between different measures of training load and injury risk, prompting recent calls for better handling of non-linearity in the field.9 10
Despite these hypotheses and calls, methods that assume a linear relationship between training load and injury risk, such as Pearson correlations and logistic regression, are commonly used in the field.11 If the training load and injury relationship is non-linear, such methods are expected to produce conflicting, irreproducible—and sometimes simply wrong—results. Nevertheless, no study has so far determined alternative methods for handling non-linearity.
The ideal method to handle non-linearity should be able to: (1) explore non-linear shapes and thus may confirm or reject previously outlined hypotheses; (2) model the non-linear relationship accurately; and (3) offer interpretable results.
The overall aim of this study was to identify the best methods for handling non-linearity in training load and injury research. First, we ascertained the relationship in three sports populations to reveal any potential evidence of non-linearity, to illustrate the problems and to present solutions. Second, we compared different methods in their ability to explore and accurately model potential non-linear shapes. Finally, we used the comparisons to develop a guide for which method(s) to use in different situations.
Materials and methods
Participants
We obtained training load and injury data collected from three cohorts: Norwegian elite U-19 football players (n=81, 55% male, mean age: 17 years, SD: 1 year),12 one male football team from the Norwegian Premier League (n=36, mean age: 26 years (SD: 4))13 and elite youth handball players recruited from Norwegian sports high schools (n=205, 36% male, mean age: 17 years (SD: 1)).14 These cohorts were followed for 104, 323 and 237 days, respectively, during the competitive season.
All participants provided informed consent. Ethical principles were followed in accordance with the Declaration of Helsinki.
Training load definition
In all three cohorts, players reported the number of training sessions and matches daily. They also reported the duration of each activity and their rating of perceived exertion (RPE)15 on the modified Borg CR10 scale.16 To derive the session RPE (sRPE),16 we multiplied the RPE by the activity duration in minutes.
Missing sRPE values are reported in online supplemental table S1 and were 24% for elite U-19 football, 41% for Premier League football and 64% for elite youth handball. The missing values were imputed using multiple imputation (online supplemental figure S1), a method that also performs well in cases of high amounts of missing (80%),17 and the imputed values were deemed valid (online supplemental figure S2).
Supplemental material
All load measures were based on players’ daily ratings of perceived exertion (sRPE). We calculated an acute:chronic workload ratio (ACWR) in two different ways:
Daily ACWR 7:21-period
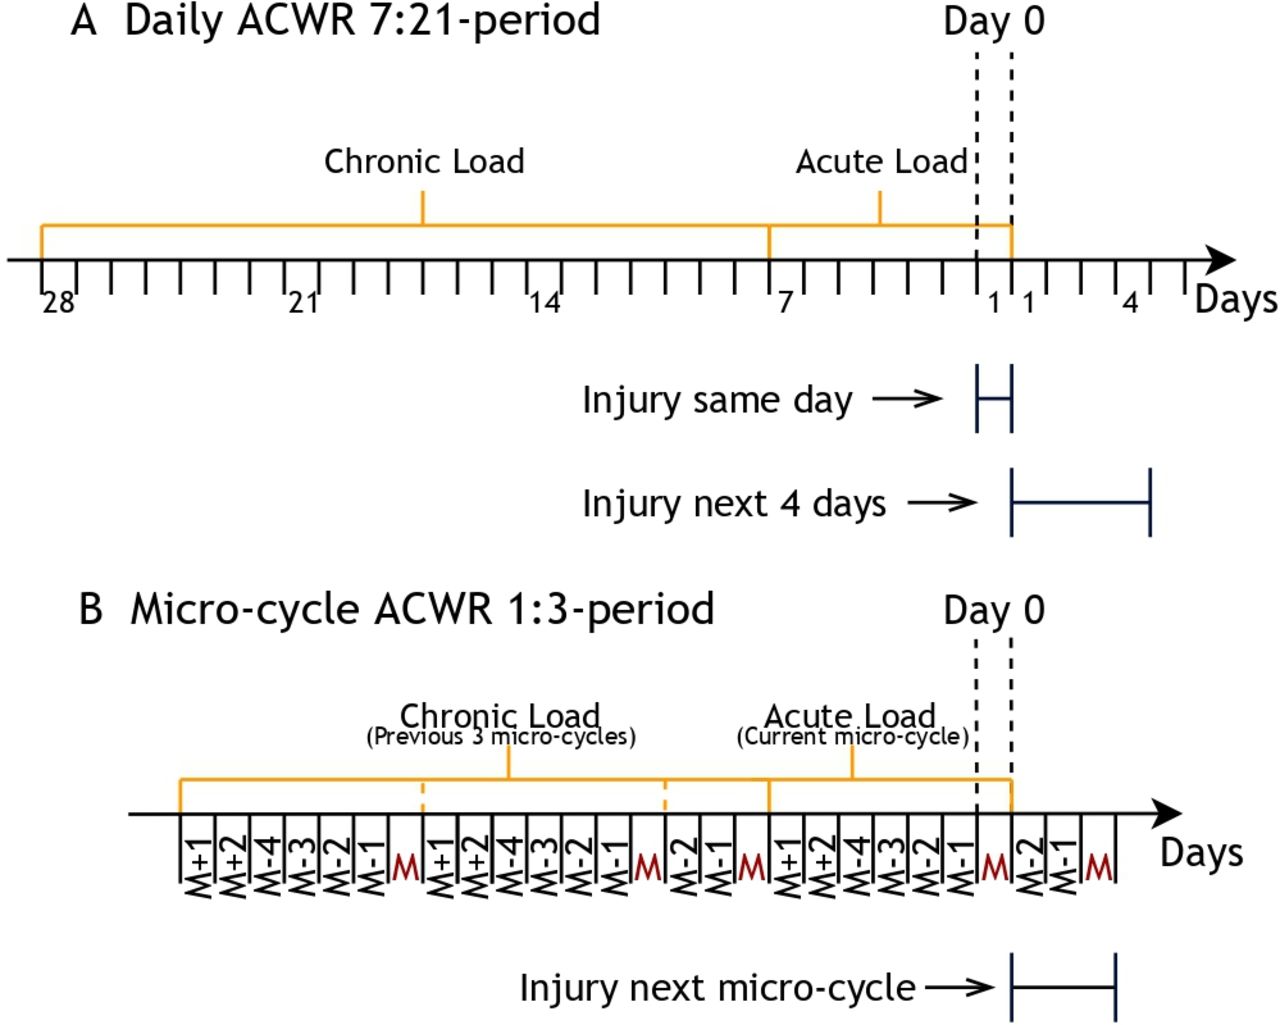
The mean sRPE across 7 days divided by the exponentially weighted moving average (EWMA) of the previous 21 days, uncoupled (figure 1).18 The calculation was performed on a sliding window moving 1 day at a time from and including the 28th day.19 The last day in the acute load is considered day 0 (figure 1).

Illustration of time periods for calculating (A) daily ACWR 7:21-period and (B) micro-cycle ACWR 1:3-period. The first day that ACWR is calculated from is denoted day 0. The space between two tick marks represent 1 day (24 hours). For B, a microcycle period consists of all activity before a new match (M). That is, recovery days after the previous match as well as the training days before the next match. Days denoted with negative numbers are training days before the next match (M-1: being the day before the match; M-2: 2 days before a match and so on). Days with positive numbers are recovery and training days after a match (M+1: being the day after a match, M+2: 2 days after a match). The number of days between matches varies by the match schedule. How a team plan their training and recovery activities varies and is dependent on the teams’ philosophy. For A, injury on the same day is defined as an injury on day 0, and future injury is defined as an injury occurring during the next 4 days excluding day 0. For B, future injury was defined as an injury occurring during the next microcycle excluding day 0. ACWR, acute:chronic workload ratio.
Microcycle ACWR 1:3-period
The mean sRPE for each microcycle divided by the EWMA of the previous three microcycles uncoupled (figure 1). A microcycle was defined as all recovery days after the previous match and the training days before the next match. The next microcycle started on the first training day after the match and so on. For an illustration of a microcycle, see figure 1. The ACWR calculation was performed in the same manner as described for daily ACWR, on a sliding window moving one microcycle at a time from and including the fourth microcycle. The last day of the fourth microcycle was considered day 0 (figure 1).
When computing a ratio, one assumes that there is no relationship between the ratio and the denominator after controlling for the denominator; a ratio is only effective when the relationship between the numerator and the denominator is a straight line that intersects the origin.20 Tests of this assumption are reported in online supplemental figure S3.
Injury definition
The same online questionnaire was used to collect daily health status and training information from all three sports cohorts. The elite U-19 football data and elite youth handball data were collected via the Briteback AB online survey platform, while the Norwegian Premier League football data were collected with Athlete Monitoring, Moncton. The players daily reported whether they had experienced ‘no health problem’, ‘a new health problem’ or ‘an exacerbation of an existing health problem’. In the youth elite handball study, if players reported any new health problems, they were immediately prompted to specify whether it was an injury or illness in the questionnaire. In the football studies, if players reported any new health problems, a clinician contacted them by telephone the following day for a structured interview and classified the health problem as an injury or illness with the UEFA guidelines.21 Players were asked to report all physical complaints, irrespective of their consequences on sports participation or the need to seek medical attention.22
Statistical analyses
To estimate the relationship between training load and injury risk, mixed effects logistic regression was used.11 23
We considered two outcomes: (1) occurrence of an injury on the same day as the observed training load (day 0) and (2) occurrence of injury in the future, where the current observation day (day 0) was not included. For unmodified training load values and daily ACWR 7:21-period, the future injury was defined as an injury occurring during the next 4 days excluding day 0. For microcycle ACWR 1:3-period, the future injury was any injury occurring during the next microcycle excluding day 0 (see figure 1 for an illustration of injury time periods and online supplemental table S2 for a list of the different models).
We adjusted for player age in all analyses. In addition, we adjusted for sex in the U-19 elite football and the elite youth handball models. In all models, the relationship between sRPE and injury risk was modelled with restricted cubic splines (RCSs).24 The models were repeated without splines to simulate the relationship we would have discovered if we had assumed linearity. When using RCS, the estimated regression coefficients do not have a clinically meaningful interpretation, and only their p values are numerically interpretable.24 The main result is, therefore, a visualisation of the model predictions (with uncertainty) to determine the shape of the relationship between training load and injury risk.
More details about data preparation and calculations are available in a supplementary file in .pdf format (online supplemental file 2). Our analyses served to illustrate whether there is any evidence for non-linearity in training load and injury research and should not be interpreted as causal inference.
Supplemental material
Simulations
In addition to analysing real data, we performed (stochastic) simulations to compare different methods for ascertaining non-linear and linear relationships between training load and injury risk. The simulations were based on the elite U-19 football dataset since it had the least missing data (24%). The methodology here is focused on a causal research setting; however, the methods may also be applied in predictive research.25 A detailed description of the simulation process and equations, as well as justifications for our methodological choices, is available as supplementary material (online supplemental file 2).
Two datasets were created. The first kept the original 8495 sRPE and 6308 ACWR values. In the second, sRPE and ACWR were sampled with replacement to generate 22 500 training load values.
Artificial injuries were simulated under different assumed scenarios for the relationship between training load and injury risk:
A U shape.
A J shape.
A linear shape.
A U shape between training load and injury risk indicates that the injury risk at lower levels of training load is equal to the injury risk at higher levels of training load. In contrast, moderate levels of training load have the lowest risk. In a J shape, moderate levels of training load have the lowest injury risk, followed by low levels of training load having intermediate risk. Finally, high levels of training load have the highest injury risk. For the U and linear relationship shapes, the simulated probability of an injury was based on the sRPE, while for the J shape, it was based on the ACWR. Any reference to the ‘true’ probability refers to the simulated probability we have created for a given scenario and which we aim to model.
We used mixed effects logistic regression models to estimate the relationship between training load and predefined injury risk, and we compared seven different methods to model the relationship:
Linear model.
Categorising by quartiles (data driven).
Categorising by subjective cut-offs (subjective).
Quadratic model.
Fractional polynomials.
RCSs with automated knots (data driven).
RCSs with subjectively placed knots (subjective).
The root-mean-squared error (RMSE), coverage of prediction intervals, Brier score for model fit and C-statistics for predictive ability were calculated as performance measures. RMSE is a combined measure of accuracy and precision, where the lower the RMSE, the better the method. RMSE is only interpretable by comparing values in the same analysis – the values are meaningless in isolation.26
In summary, the four steps of the simulations were:
Sample training load values from the elite U-19 football data.
Simulate injuries with three different shapes for the relationship between injury risk and training load.
Fit seven different models with injury as the outcome and training load as the explanatory variable.
Calculate performance measures.
Steps 1–4 were repeated 1900 times.
For the U-shaped relationship, predicted values were visualised alongside the predefined shape to determine each method’s ability to capture the true relationship. RMSE was also visually compared for the non-linear shapes.
All statistical analyses and simulations were performed using R V.4.0.2.27 A GitHub repository is available with R code and data files.28
Results
Evidence of non-linearity in training load and injury risk relationship research
A strong J-shaped relationship was found between sRPE and the probability of injury on the same day for elite youth handball players (p<0.001, figure 2A, online supplemental table S3). The linear model did not find this relationship (OR=1.0, 95% CI 0.99 to 1.00, p=0.24, figure 2B, online supplemental table S4). Additionally, for the handball cohort, an uncertain ∩-shaped relationship was present between sRPE and probability of injury in the next 4 days (p=0.06, figure 2B). These results also conflicted with the linear model showing no relationship (OR=1.0, 95% CI 0.99 to 1.00, p=0.35, figure 2B). For microcycle ACWR, the assumption that the relationship between the numerator and the denominator is a straight line intersecting the origin was supported, while for daily ACWR, the assumption was violated (online supplemental figure S3). No other relationships had significant p values or practically notable effect sizes (online supplemental table S3, figure S5 and S6).

Probability of injury in elite youth handball on (A) the sameday and (B) the next 4 days, for each level of session rating of perceived exertion (sRPE) measured in arbitrary units (AU), as predicted by mixed effects logistic regression models with restricted cubic splines. The predictions pertain to a 17-year-old female. The yellow area represents 95% cluster-robust CIs around predicted values. The straight line shows the same predictions from an equivalent model without splines (ie, assuming linearity). For figure part B, modelling the response of injury in the next 4 days, multiple injuries on the same day were considered one event and an injury event would pertain to four load values and are therefore included four times.
Simulations
The quadratic model, fractional polynomials (FPs) and RCSs with subjectively placed knots were the only methods capable of modelling the non-linear U-shaped relationship (figure 3). FPs and RCS with subjectively placed knots (RCS subjectively) had the lowest RMSE and were, therefore, the best methods for the U shape (figure 4A). The linear model had—by far—the highest RMSE and the data-driven RCS the second highest (figure 4A). In contrast, RCS (subjectively) had among the highest RMSE (figure 4B) regarding the J-shaped relationship. For the J shape, FPs and the quadratic model were the best methods (figure 4B). FPs had second-to-lowest RMSE for non-linear relationships (figure 4) and consistently had the best coverage (table 1).

Probability of injury for each level of session rating of perceived exertion (sRPE) as predicted by seven different methods of modelling load. The yellow line represents the ability of the method to capture the U-shaped relationship (shown by the black line). The yellow area corresponds to the prediction interval. The predictions are based on 8494 sRPE values sampled from a highly skewed distribution in a Norwegian elite U-19 football dataset.

The mean root-mean-squared error (RMSE) of 1900 permutations for seven different methods modelling a non-linear (A) U-shaped relationship between session rating of perceived exertion (sRPE) and probability of injury, and (B) J-shaped relationship between acute:chronic workload ratio (ACWR) and probability of injury. The methods are arranged from top-to-bottom by the method with highest RMSE (most error) to the method with lowest RMSE. Thus, the best methods (those with lowest RMSE) are arranged towards the bottom. For figure part A, fractional polynomials and restricted cubic splines (subjectively) were the best methods, while for figure part B, fractional polynomials and the quadratic model were the best methods. The calculations are based on a Norwegian elite U-19 football dataset with 8494 sRPE values for (A) U shape and 6308 ACWR values for (B) J shape. RMSE cannot be compared between the two shapes, only within each shape.26
A comparison of mean root-mean-squared error, Brier score, C-statistic and coverage of prediction intervals for 1900 permutations of modelling the relationship between training load and risk of injury in seven different ways, with predetermined relationship shapes
All methods had a similar degree of error, predictive ability and model fit for the linear relationship (table 1).
The categorisation methods had the lowest coverage for the U and linear shapes, and categorising by quartiles had particularly poor coverage for the linear shape (25% vs >99% for other methods, table 1). For the J shape, the linear model performed worse than categorisation with 55% (vs 79% and 89%) for n=6308 (table 1). Predictions from the linear model could not form the U shape (figure 3) and had the highest degree of error for both non-linear shapes (highest RMSE; table 1, figure 4) but showed high predictive ability for the U shape (C-statistic >0.8) and moderate to poor predictive ability of the J shape (C-statistic=0.77 for n=6308, C-statistic=0.62 for n=22 500) in line with the other methods (table 1).
The differences in evaluation metrics between the two different sample sizes, n=22 500 and n=8494 for sRPE, and n=22 500 and n=6308 for ACWR, were negligible (table 1). Model fit determined by Brier score also failed to notably differentiate methods (table 1).
Discussion
This is the first study exploring the potential for non-linearity in the relationship between training load and injury risk for football and handball. We found a J-shaped relationship between training load measured as the sRPE and probability of an injury on the same day in an elite youth handball cohort (figure 2A).
We also found that three methods were able to model the non-linear relationships between training load and injury explored in this paper: the quadratic model, FPs and RCSs, which managed to accurately recreate all simulated risk shapes (figure 4).
Evidence of non-linearity in training load and injury risk relationship research
All modelled relationships between training load and injury risk were either flat (no relationship) or non-linear. The results showed that the strength and direction of the relationship varied between training load—and injury—definitions in the handball population, while no relationships were found in the two football populations.
If we had assumed linearity and modelled the data accordingly, we would not have discovered these relationships. More grievously, we would have concluded there was no relationship between training load and injury risk for elite youth handball players for injury on the same day (linear model, p=0.24, type II error), when it was, in fact, a strong U-shaped parabola (RCS model, p<0.001, figure 2A). This may happen when a relationship is not only non-linear but non-monotonic. In monotonic relationships, the response variable Y (injury probability) moves only in one direction as X (training load) increases, while in non-monotonic relationships, Y sometimes increases and sometimes decreases when X increases.9
In 2013, Gamble5 theorised a U-shaped relationship between training load and risk of injury. Data presented by Blanch and Gabbett6 suggested a J-shaped relationship between ACWR and injury, although the methodology and interpretation of this finding have recently been questioned.7 Here, we reproduced a J shape between sRPE and injury occurring on the same day for elite youth handballers but not for the relative training load described by the ACWR in the same cohort. In Lathlean et al,29 a U shape was discovered between training load and the risk of future injury in an Australian football cohort. These findings might suggest that the training load and injury relationship is different for different sports and populations. Since non-linearity is possible in a training load and injury context, we recommend assuming the data have an unknown, non-linear relationship when conducting statistical analyses.
Methods for addressing non-linear relationships
As expected, standard logistic regression could not model the U and J shapes, as it assumes linearity. For the U shape, the RMSE was threefold higher for the linear model than all other models (RMSE=2.9 vs RMSE≈0.95, figure 4A), showing that violation of the linearity assumption causes major bias and can substantially alter conclusions based on the results. Misleadingly, the linear model had a great C-statistic score (>0.8) and comparable Brier scores. This happened because the sRPE values were highly skewed (online supplemental figure S4). Over 90% of the data points were congested in the left-hand side of the U shape (figure 3, online supplemental figure S4). The linear model, which only managed to model the left-hand side of the U shape, therefore predicted most of the values well, causing the impressive C-statistic. However, it could not predict the right-hand side of the U shape at all and therefore had high RMSE. Consequently, a researcher who measures model fit by predictive ability alone may be falsely assured that the linearity assumption holds true.
Categorisation has previously been explored thoroughly in Carey et al30 and proven a poor method for modelling non-linear relationships. The results were reproduced in our study using a football population, where the RMSE and coverage for categorisation were consistently outperformed by other methods (table 1). In addition, our results showed that categorising by quartiles was suboptimal for modelling non-linear relationships and also suboptimal when the relationship between training load and injury risk was linear (coverage of 25% vs >99% for all other methods).
Recently, some studies have added a quadratic term to the training load and injury model to test for linearity: if the term was non-significant, it was discarded for a linear model; if significant, they categorised the training load variable to handle non-linearity.31–33 If the quadratic term is significant, the researchers correctly choose other options over a linear model. However, the quadratic term only tests for a parabolic shape—not non-linearity in general. A significant quadratic term does not mean the relationship is quadratic (parabolic). It means that a quadratic shape fits better than a linear shape. If the quadratic term is not significant, it does not necessarily mean the underlying relationship is linear, either, only that a quadratic shape fits poorly. Furthermore, testing non-linearity with a quadratic term has been shown to inflate type I error rates by 50%.34
Blanch and Gabbett6 and Carey et al19 used quadratic regression assuming a parabolic relationship between training load and injury risk. In our study, quadratic regression modelled the U-shaped risk profiles with low degrees of error (figures 3 and 4A) and had the best performance for the J-shaped relationship (figure 4B). This is expected, as the J shape was initially constructed from a quadratic model in Blanch and Gabbett.6 Contrary to a real-life setting, however, we knew the risk profiles before analysing our data. Quadratic regression does not explore shapes but constrains the model to follow a specific pathway. We think it is only appropriate when strong evidence from previous studies support a parabolic relationship. We recommend assuming non-linearity of unknown shapes and using methods not to test for linearity but to explore and model non-linearity to discover the relationship. Based on our findings and previous research in other fields such as medical statistics,35 FPs and RCSs appear to be the best methods for doing this.
FPs modelled all risk shapes accurately (figure 4, table 1). FP has recently been used in a training load and injury risk study.29 This method requires minor subjective influence, and the results are intuitive, especially for users familiar with quadratic regression. Although it appears the superior choice at first glance, the method has a disadvantage: FPs are defined only for positive values, which means that an FP model is unable to model negative values and the value 0. In the context of training load and injury risk research, training load is (traditionally) never measured on a negative scale.36 If it can be justified, adding a small constant (such as 0.001, or whatever is considered small in the context of the measuring scale) to all training load values can solve the problem with 0 and allow the use of FPs.
RCSs performance depended on how knot locations (the points where the polynomials that make up cubic splines are joined, see online supplemental file 2 for details) were chosen. In the data-driven method, where knots were automatically placed by the default setting, RCS failed to model the U-shaped scenario (figure 3). When knot position was chosen based on the range of the training load variable, RCS modelled the U accurately (figure 3). However, the results were the opposite for the J-shaped relationship where the data-driven method was among those of lowest error, and the subjectively located knots had the highest amount of error (figure 4B). The default placement algorithm was by quartiles, and in the highly skewed distribution of the sRPE values used in the U-shaped relationship (online supplemental figure S4), it caused the knots to be placed tightly together (figure 3). Therefore, it could not model the shape, while the subjective version was created with the range of the values in mind. The ACWR values used in the J shape had a Gaussian distribution (online supplemental figure S4), and using quartiles was a feasible choice. This shows the importance of careful model calibration using clinical knowledge and knowledge of the data.
RCS produces effect sizes that are difficult to use in a practical setting, and results can only be interpreted in the form of p values and visualisation (such as in figure 2). RCS is less ideal than FP in causal research. Still, its disadvantages are not as relevant in predictive research where interpretability is of minor concern.25 We propose a guide for when FP is recommended and when RCS is recommended (box 1).
Recommended methods to model non-linear relationships between training load and injury risk
To model non-linear relationships, either Fractional Polynomials (FP) or Restricted Cubic Splines (RCS) can be used.
Fractional polynomials are easier to interpret. We recommend FP under the following conditions:
When the main objective is causal research, FP is preferred. When the training load measure does not include negative numbers or 0. This includes:
Studies that use the Acute-Chronic Workload Ratio or other metrics that cannot be the value 0 or a negative value.
Studies that model the relationship between training load and injury risk on the same day, or other scenarios where the researchers may wish to remove the days where the athletes were not exposed to any training load from the dataset.
Studies that can justify applying a small constant (such as 0.001, or whatever is considered small in the context of the measuring scale) to all training load values.
We recommend restricted cubic splines under the following conditions:
When the main objective is predictive research, RCS is preferred.
When the training load measures must have the value 0. This includes studies that wish to capture a change in the effect, regardless how small, going from no training load at all to any amount of training load.
When training load is included in the study merely to adjust for it as a potential confounder and is not the main variable of interest.
We do not recommend changing the study aims or the chosen measure to use FP, nor do we recommend using FP under certain conditions and RCS for other conditions in the same study.
A step-by-step guide to performing FP and RCS in R can be accessed on the primary author’s GitHub page.39 40
Limitations
A limitation of this study was the sample size, the number of injuries and consequently statistical power. Neither of the two football cohorts satisfied the recommendation of >200 injuries to detect a small to moderate effect.37 The elite youth handball data, despite having a sufficient number of injuries, had high amounts of missing sRPE values (64%), and this may have caused selection bias. We emphasise that the exploration of non-linearity in these data were for illustrative purposes and not to show causal inference.
We used statistical methods commonly used and recommended in the field to demonstrate how non-linear relationships can be ascertained with existing methods. We were consequently limited in the choice of methods. The ACWR model is under debate, and the pros and cons of the method have been explored extensively in recent publications.12 18 38 The purpose of this paper was not to provide additional insight into that discussion but rather to demonstrate how a continuous training load variable should be modelled to account for non-linearity. For this reason, we opted to use ACWR, as it is currently the most used training load method in the field of training load and injury risk research.4
Conclusion
Exploratory analyses showed evidence of a non-linear relationship between training load and risk of injury in a sports population. Researchers should assume that the relationship between training load and injury risk is non-linear and use appropriate methods that explore relationships rather than constrain them. Linear methods should only be used when the relationship is first proven to be linear. We promote FPs or RCSs to model non-linear relationships, depending on the scenario.
Data availability statement
Data are available in a public, open access repository. Data are available on reasonable request. Data used for simulations are available in a public, open access repository (https://github.com/lenakba/load-injury-non-linearity-study). The Norwegian elite U-19 football data, Norwegian Premier League football data and Norwegian elite youth handball data are available on reasonable request. These are anonymised based on requirements of the Norwegian Data Protection Agency. The removal of background variables for the anonymisation renders the data unusable for any reproducibility purposes; the data are only available for the sake of transparency.
Ethics statements
Ethics approval
Study protocol for all three studies were approved by the Norwegian Centre for Research Data: Norwegian elite U-19 football (5487), Norwegian Premier League football (722773) and Norwegian elite youth handball (407930). They were also approved by the Ethical Review Board of the Norwegian School of Sport Sciences. The Norwegian elite U-19 football study was also approved by the South-Eastern Norway Regional Committee for Medical and Health Research Ethics (2017/1015).
Acknowledgments
We would like to thank Christian Thue Bjørndal for access to the elite youth handball data. We would also like to thank Garth Theron for high-quality programming of the Norwegian Premier League football database. This research would not be made possible without the collaboration of coaches and athletes, and we would like to thank the participants who contributed.
References
Supplementary materials
Supplementary Data
This web only file has been produced by the BMJ Publishing Group from an electronic file supplied by the author(s) and has not been edited for content.
Footnotes
Twitter @lena_kbm, @DocThorAndersen, @torsteindalen, @benclarsen, @FagerlandWang
Contributors LKB-M designed the study and performed statistical analyses in collaboration with and under supervision from MWF and TEA. TDL constructed the novel idea of using microcycles instead of calendar weeks. All authors contributed with notable critical appraisal of the text and approved the final version.
Funding The Oslo Sports Trauma Research Centre provided all funding for performing this study.
Competing interests None declared.
Patient and public involvement Patients and/or the public were not involved in the design, or conduct, or reporting, or dissemination plans of this research.
Provenance and peer review Not commissioned; externally peer reviewed.