Article Text

Abstract
Objective To analyse rider’s subjective responses after a standardised bicycle ergonomic adjustment method.
Methods Experimental study of 160 healthy, amateur mountain bikers analysed previously and 30 days after a bike-fitting session. The main outcome measures were subjective comfort level (Feeling Scale, FEEL), fatigue (OMINI Scale) and pain (Visual Analogue Scale, VAS).
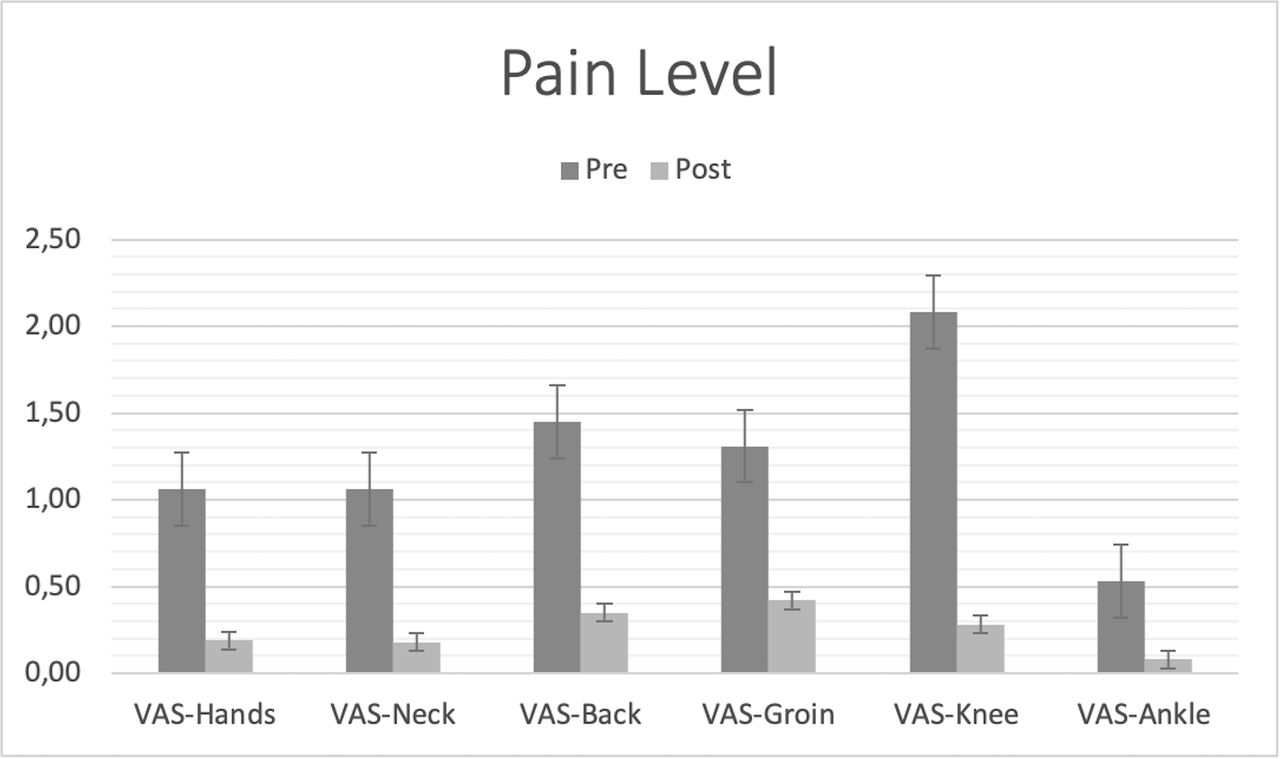
Results All variables demonstrated statistical significance between groups pre and post bike-fit session (p<0001). FEEL, OMNI and VAS-knee demonstrated large effect sizes (d=1.30; d=1.39 and d=0.86, respectively). VAS-hands, VAS-neck and VAS-back indicated moderate effect size (d=0.58; d=0.52 and d=0.43, respectively). VAS-groin and VAS-ankle indicated a small size effect (d=0.46 and d=0.43, respectively).
Conclusions Overall discomfort, fatigue and pain in healthy mountain biker adults improved according to all three scales. The major improvements in pain levels were detected on the knee, hands, back and neck compared with presession values. Groin and ankle pain had smaller improvements but were still significant. Future clinical trials should address the bias effects of this experimental study.
- cycling
- fatigue
- biomechanics
- sports & exercise medicine
Data availability statement
No data are available. Data from this research were not allowed to be shared. Additional data was not allowed to be shared by the participants.
This is an open access article distributed in accordance with the Creative Commons Attribution Non Commercial (CC BY-NC 4.0) license, which permits others to distribute, remix, adapt, build upon this work non-commercially, and license their derivative works on different terms, provided the original work is properly cited, appropriate credit is given, any changes made indicated, and the use is non-commercial. See: http://creativecommons.org/licenses/by-nc/4.0/.
Statistics from Altmetric.com
Key messages
What is already known
Ergonomic adjustments on bicycles may improve comfort while riding.
There is little scientific information on joint angular reference values for a comfortable and pain-free riding experience.
The effect of ergonomic adjustments on cycling comfort and pain is usually measured in the short term.
What are the new findings
A bike-fit process may improve pain, discomfort and fatigue in different degrees.
Our study’s joint angular ranges and measurements may be used as reference values for bike fitters and future scientific studies to compare outcomes.
Bike fitters may use the combination of these three subjective scales as tools to measure their fitting process’ degree of improvement.
How might our findings impact practice?
Currently, there is no quantitative measurement tool for the effects of ergonomic changes performed on the bicycle in cycling. The use of these three scales proved to be accessible, practical and with sufficient scientific validity for clinical practice to be compared and improved.
Introduction
The increasing popularity of cycling as a mode of transportation, recreation and sport has led to an increase in the incidence of musculoskeletal injuries related to its practice.1 These injuries often occur due to incorrect posture on the bicycle due to incorrect equipment adjustments according to the rider’s body measurements and physical conditions.2 These adjustments aim for more comfort, less pain and musculoskeletal overload from repetitive cycling gestures, known as ‘bike-fit’ or ‘bike-fitting’.3 4
There are currently few scientific studies examining the effects of the bike-fit technique on cyclist comfort, its effectiveness in reducing repetitive strain injuries or improving cycling performance.1 The few studies on the subject focus on knee angular measurements during pedalling, given the high incidence of pain and injury on that joint.5 However, other musculoskeletal injuries affect cyclists. Despite this, it is unknown what would be the best configuration of a bicycle to produce a cycling posture with a better relationship between comfort, injury prevention and performance.6
Although it may be obvious that ergonomically adjusted equipment could generate more comfort to a user, it is unknown if this general improvement of comfort is a result of reduced pain, fatigue or both. There is no scientific confirmation or rejection of this relationship in cycling to the best of our knowledge. However, as fatigue is an important component of performance development, a separate analysis of both components could give cycling professionals a better understanding of the benefits of bike-fitting and its impact on comfort and performance improvement. A standardisation of optimal joint angular measurement may improve this knowledge as a comparison between bike-fitting methods would become possible.
The purpose of this study is to analyse riders’ subjective responses to a standardised ergonomic adjustment made on their bicycles. We hypothesise that subjective pain levels, discomfort and fatigue would continue to be lower even after 30 days of a standardised bike-fitting method.
Methods
Design
This is an experimental study based on data from clinical records of professional bike fitters. It was made in parallel with a scientific validation of the equipment used. This research report followed the recommendations of the Strengthening the Reporting of Observational Studies in Epidemiology Statement,7 and its design followed the recommendations of the Improving Healthcare Decisions Task Force.8 According to the Declaration of Helsinki, the study was carried out following the Ethical Standards in Sports and Exercise Science Research.9
There was no involvement from patients or public members in the design, conduct, reporting or dissemination plans of the research.
Participants
The sample size calculation used similar studies concerning cycling kinematic analysis.5 Using an alpha level of 5%, loss of follow-up limited in 10% and power of 90%, we found that 76 participants would be necessary. Most kinematic studies found reported data from homogeneous cycling populations, so we decided to double the participants’ minimum number. Our group of candidates become too heterogeneous with both sexes and a wide range of ages and weekly mileage. All calculations used G* Power Software (University of Dusseldorf, Germany).
It included a prospective convenience sample of 160 amateurs, adult mountain bike cyclists (120 men and 40 women), classified as recreational (n=76) and competitive (n=84), according to a recent categorisation based on weekly training/practice volume in kilometres.10 The participants were selected after an online advertisement on social media looking for candidates to participate in a biomechanic cycling study concerning bike-fitting mountain bikers. Demographic and anthropometric information of the sample is presented in table 1.
Demographic and anthropometric characteristics of the sample (values with means±SD)
The purpose, experimental procedures, possible risks and benefits of the study were explained to the candidates, who provided a written informed consent form to confirm participation in the study. Participants’ personal data were deleted after extraction to guarantee anonymity. Final data were stored on a password secure, internet cloud-based website to avoid the risk of information leak or loss.
Eligibility criteria
To be included in this study, cyclists (or mountain bikers) had to participate in cycling for the last 3 months fully. Candidates who had an osteomuscular injury that could remove them from sports participation were excluded from the sample. Other criteria for exclusion from the sample were current treatment for pain or the intake of any analgesic medication in the last 24 hours; localised pain or excessive fatigue while pedalling; cyclists younger than 18 years old; less than a month of experience with its current bicycle.
Instruments
For data collection, a scientific validated,11 led-emitting infrared tridimensional camera system (Vantage Camera System, Retul, Boulder, Colorado, USA) was used in bike fitting (also known as Retul 3D cameras). This study was made in parallel with this system scientific validation. Calibration followed the manufacturer’s manual instructions.
Each participants’ bicycle was connected to a hydraulic indoor direct-drive smart trainer (Suito, Ellite, Italy), equipped with a built-in power meter. A set of common mechanical tools (like screwdrivers and hex keys) was used to adjust and modify bicycle components.
Three validated subjective scales were used to improve feedback during the session: an overall riding comfort scale (Feeling Scale, or FEEL),12 an overall riding fatigue scale (OMNI)13 and a Visual Analogue pain Scale (VAS).14 The VAS was used for five specific body parts, most commonly targeted for cycling injuries and discomfort while pedalling (hands/wrists, neck/shoulders, back/hips, groin/pelvis, knee/thigh, ankle/feet).1
For data storage and processing, we used a MacBook Pro Notebook (Cupertino, California, USA), equipped with a Microsoft Office software package for Mac (V.2011, Redmond, Washington, USA) and SPSS from IBM (Armonk, New York, USA).
Procedure
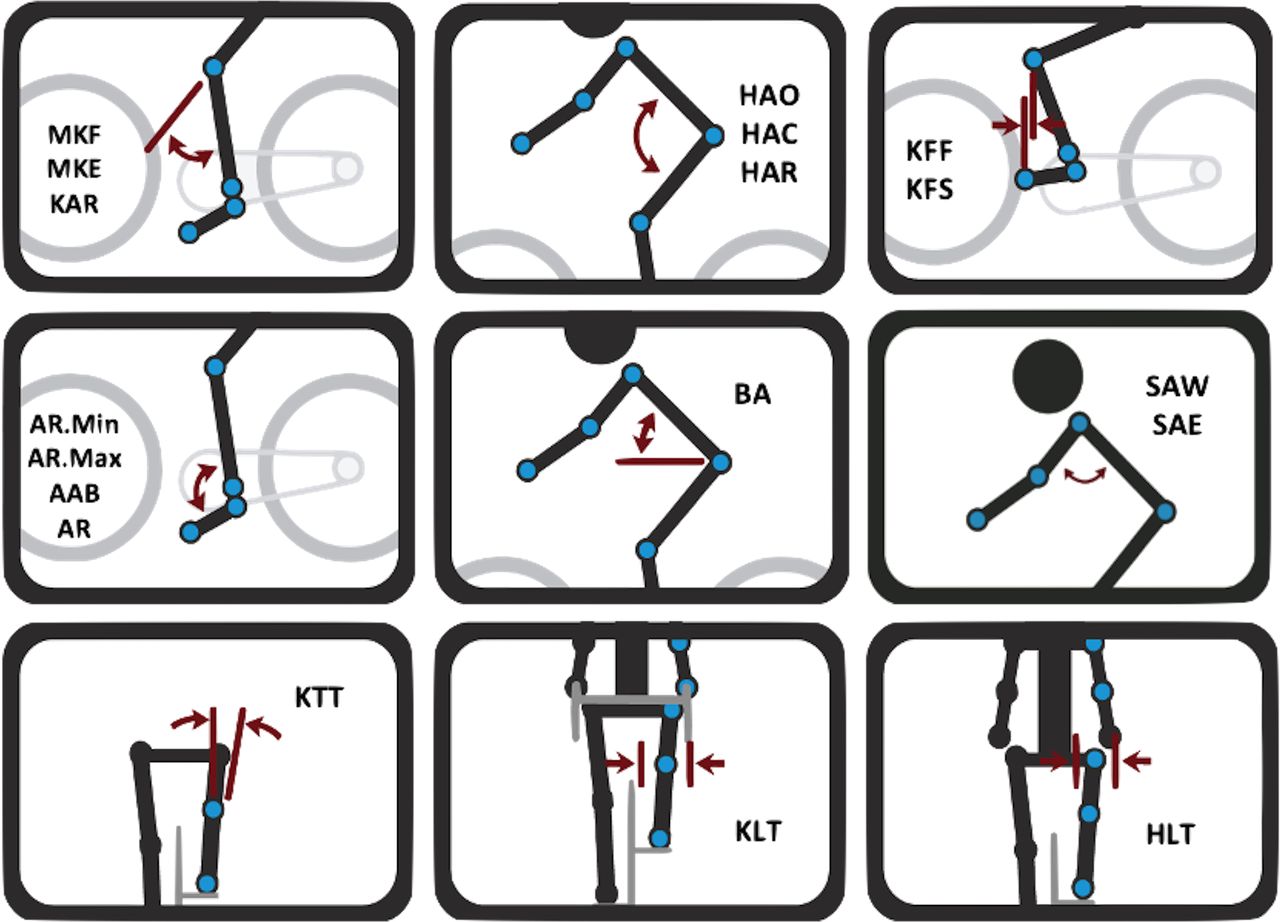
The participants were subjected to a standardised bike-fitting protocol based on 3D kinematic data. Reference values of joint angles, riding posture and spatial relation with bicycle geometry were used to guide the adjustments of bicycle components. These reference joint angle ranges were collected by the Retul 3D cameras manufacturer from the last 7 years from bike fitter users worldwide. Table 2 shows all 18 reference values with those measurements’ descriptions. Figures 1 and 2 show a schematic layout of all measurements with rider body markers.
Recommended measurements and joint angular ranges for cycling 3D kinematics analysis
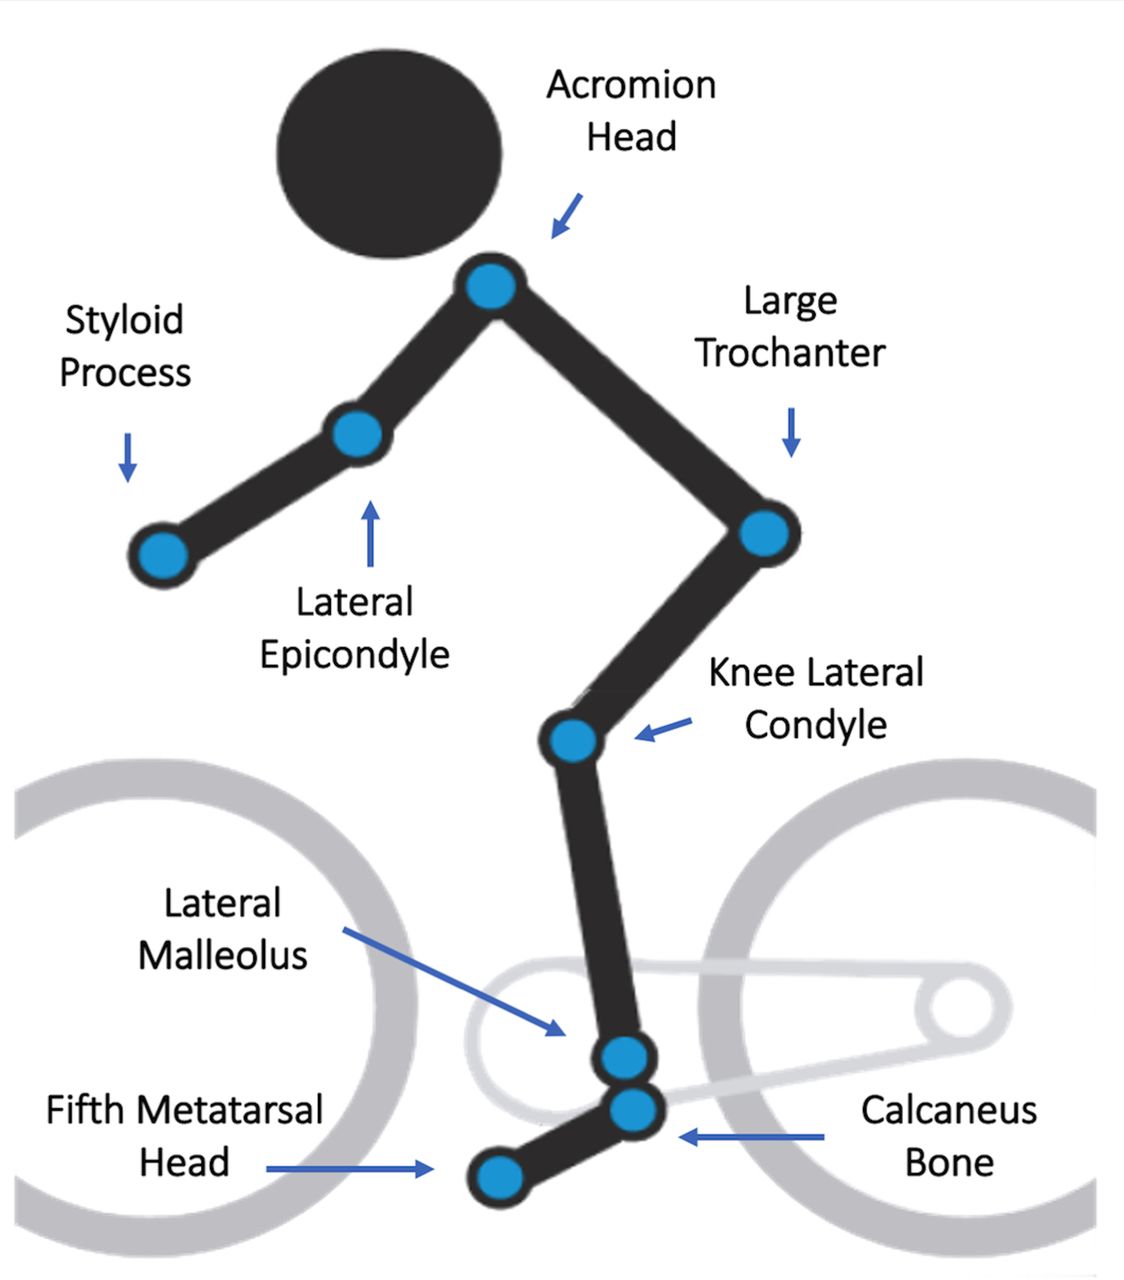
Body markers for 3D kinematic tracking.

Kinematic measurements. AAB, ankle angle at bottom; AR, ankle range; AR.Max, ankle maxmium; AR.Min, ankle minimum; BA, back angle; HAC, hip angle closed; HAO, hip angle open; HAR, hip angle range; HLT, hip lateral travel; KAR, knee angle range; KFF, knee forward of foot; KFS, kee forward of spindle; KLT, knee travel tilt; MKE, maximum knee extension; MKF, maximum knee flexion; SAE, shoulder angle to elbow; SAW, shoulder angle to wrist.
Participants were asked to bring their bicycle to the laboratory on a convenient predetermined schedule between 8am and and 12am from Monday to Friday. They receive a list of recommendations, including wearing proper cycling clothing and shoes; do not practice strenuous exercise up to 6 hours before the bike-fit session, and avoid fasting 3 hours before the session. During the session, they are allowed to drink freshwater on demand. The indoor temperature was maintained at 23°C, and humidity levels were between 68% and 80%. The same physiotherapist, with 10 years of experience, performed all analyses. The Retul 3D camera system recorded the rider’s right side.
On arrival, participants were provided with an appropriate explanation and demonstration of all procedures. Cyclists provided their personal data, level of experience with the current bicycle, weekly riding distance, objectives, expectations and complaints (when they had to answer all three subjective scales—VAS, FEEL and OMNI). Before the session began, anthropometric data were recorded following the International Society for the Advancement of Kinanthropometry level 01-certified anthropometrist protocol.15
After the interview and physical assessment, the subjects were asked to ride their bicycles on the smart trainer for 120 s, at 70–90 rpm, with an automatically controlled load of 100 W.16 Once they finished the time, they could drop from the bike and rest while their bicycle was subjected to the first ergonomic adjustments by the bike fitter. Measurements’ reference values were used to guide the adjustment decision-making process, allowing joint angles to be inside recommended ranges. When at least 15 of all 18 measurements were according to recommended ranges, the session ended.
The participants were discharged with instructions not to change any bicycle component or measurement until contacted again in 30 days. The cyclists should maintain their weekly mileage during this period to report the most accurate impression of the bike-fit long-term effects. After 30 days, we made contact with each participant to answer all three scales one last time.
Data analysis
Demographic and anthropometric data extracted were sex, age, height, weight, wingspan, body mass index, experience (familiarity) with the current bicycle in months, rider training (practice) volume in kilometres per month. Table 1 shows all demographic and anthropometric data of the sample.
Feeling Scale (FEEL) values, VAS values and OMINI Scale (OMINI) values were collected at two moments: just before the bike-fit session (pre) and 30 days after the bike-fit session (post). These data were recorded for inferential analysis, and the results are displayed in table 3.
Inferential analysis of the sample with means and SD
The normality of all data was confirmed using visual inspection and the Kolmogorov-Smirnov test. Homogeneity of variance was assessed via Levene’s test. A Student’s t-test was used to identify statistically significant differences between pre and postbicycle adjustments. Cohen’s d effect sizes were calculated with a custom script math software to interpret the magnitude of differences using the following classification: standardised mean differences of 0.2, 0.5 and 0.8 for small, medium and large effect sizes, respectively.17 All data were processed using SPSS V.20 (IBM, Chicago, Illinois, USA) with a level of statistical significance set at alpha level p<0.05.
Results
Inferential analysis results are presented in table 3. The results show that all variables demonstrated statistical significance between the pre and post bike-fit sessions (p<0001). FEEL, OMNI and VAS-knee demonstrated large effect sizes (d=1.30; d=1.39 and d=0.86, respectively). VAS-hands, VAS-neck and VAS-back indicated moderate effect size (d=0.58; d=0.52 and d=0.43, respectively). VAS-groin and VAS-ankle indicated a small size effect (d=0.46 and d=0.43, respectively). Figures 3 and 4 illustrate the results.

Visual Analogue Scale (VAS).

FEEL Scale and OMNI Scale. FEEL, Feeling.
Discussion
The purpose of this study was to analyse riders’ subjective responses after ergonomic adjustments were made on their bicycles using a group of standardised joint angular ranges. To measure the subjective impact of the ergonomic changes, three subjective scales (FEEL, VAS and OMNI), respectively, for comfort, pain and fatigue, were used before and 30 days after the bike-fitting session. Our results indicate a significant decrease in all three scales, improving the riding experience while riding. Also, our hypothesis was confirmed, as all three reports (riding pain, discomfort and fatigue) were reduced even 30 days after the bike-fitting session.
To the best of our knowledge, this was the first scientific study using three subjective scales to measure the effectiveness of a standardised bike-fitting technique. Other authors have developed studies concerning cycling postures that could improve performance or reduce injury risks but used various bike-fitting techniques, making comparisons difficult, at least.1 3 18–30 Aside from the different technical approaches employed in these studies, most have found and agree that a bicycle ergonomic adjustment improves overall cycling comfort and reduces pain while riding. These effects could, to some degree, improve cycling performance.30–33
In our sample, knee pain was the body part most benefited from the ergonomic adjustments, showing a large effect size of 0.86. This is of most importance, as most pain reports of professional cyclists are to the knee joint,1 indicating necessary ergonomic maintenance through bike fitting to avoid sports injury from inadequate alignment. To amateur cyclists, the most important find was the very large effect size in discomfort and fatigue decreases (1.30 and 1.39, respectively), measured by FEEL and OMNI Scales. Once diminished, those two reports may improve the cycling experience for beginners and amateurs, motivating the adhesion to the sports practice, reducing motorised traffic, and overall health improvement.
The scientific community’s major interest in this field is performance improvement, leaving small importance to ergonomic issues that directly or indirectly impact performance and injury prevention. Once discomfort, pain and fatigue are reduced, performance may improve, which should be considered in future studies on this subject.32–35
Conclusions
Overall discomfort, fatigue and knee pain are significantly decreased after a standardised bike-fit session in healthy mountain-bike adults. Pain levels on hands, back and neck had a moderate improvement when compared with presession values. Groin and ankle pain had smaller improvements but were still significant. Overall discomfort and fatigue and knee pain had a large improvement, even after 30 days.
The recommended angular ranges used in our study may be used as guidelines for mountain bike ergonomic adjustments, mostly to improve overall comfort, fatigue and reduce knee pain. Those reports are common among beginners and amateur cyclists.
Limitations
As an experimental study, this work has limitations on its conclusions. An absence of a control group makes it difficult to ascertain the degree of placebo influence on the final results.
Data availability statement
No data are available. Data from this research were not allowed to be shared. Additional data was not allowed to be shared by the participants.
Ethics statements
Ethics approval
All procedures performed in studies involving human participants were in accordance with the ethical standards of the institutional or national research committee and with the 1964 Helsinki declaration and its later amendments or comparable ethical standards. Our University Human Research Ethics Committee fully approved the protocol (number 39223556).
References
Footnotes
Contributors Conceptualisation: RDS; database research: TE, MS; data management: TE, MS; writing—original draft: RDS; writing—editing: PRdO; writing—review: LMAF, JJBM; supervision: CA, RB. We declare that all authors were fully involved in the study and preparation of the manuscript. The material within has not been and will not be submitted for publication elsewhere. No other author contributed to this article. Diversity statement: We did not choose our study group members based on gender, race, religion or political reasons. We would love to have female members as there are many female cyclists with specific needs to be analysed, but unfortunately, no female student from our five university partners showed interest in our study field, so far.
Funding The authors have not declared a specific grant for this research from any funding agency in the public, commercial or not-for-profit sectors.
Competing interests None declared.
Provenance and peer review Not commissioned; externally peer reviewed.