Article Text

Abstract
Background There is limited information about the association between long-term leisure time physical activity (LTPA) participation and healthcare costs. The purpose of this study was to investigate the association between LTPA over adulthood with later life healthcare costs in the USA.
Methods Using Medicare claims data (between 1999 and 2008) linked to the National Institutes of Health-American Association of Retired Persons (NIH-AARP) Diet and Health Study, we examined associations between nine trajectories of physical activity participation throughout adulthood with Medicare costs.
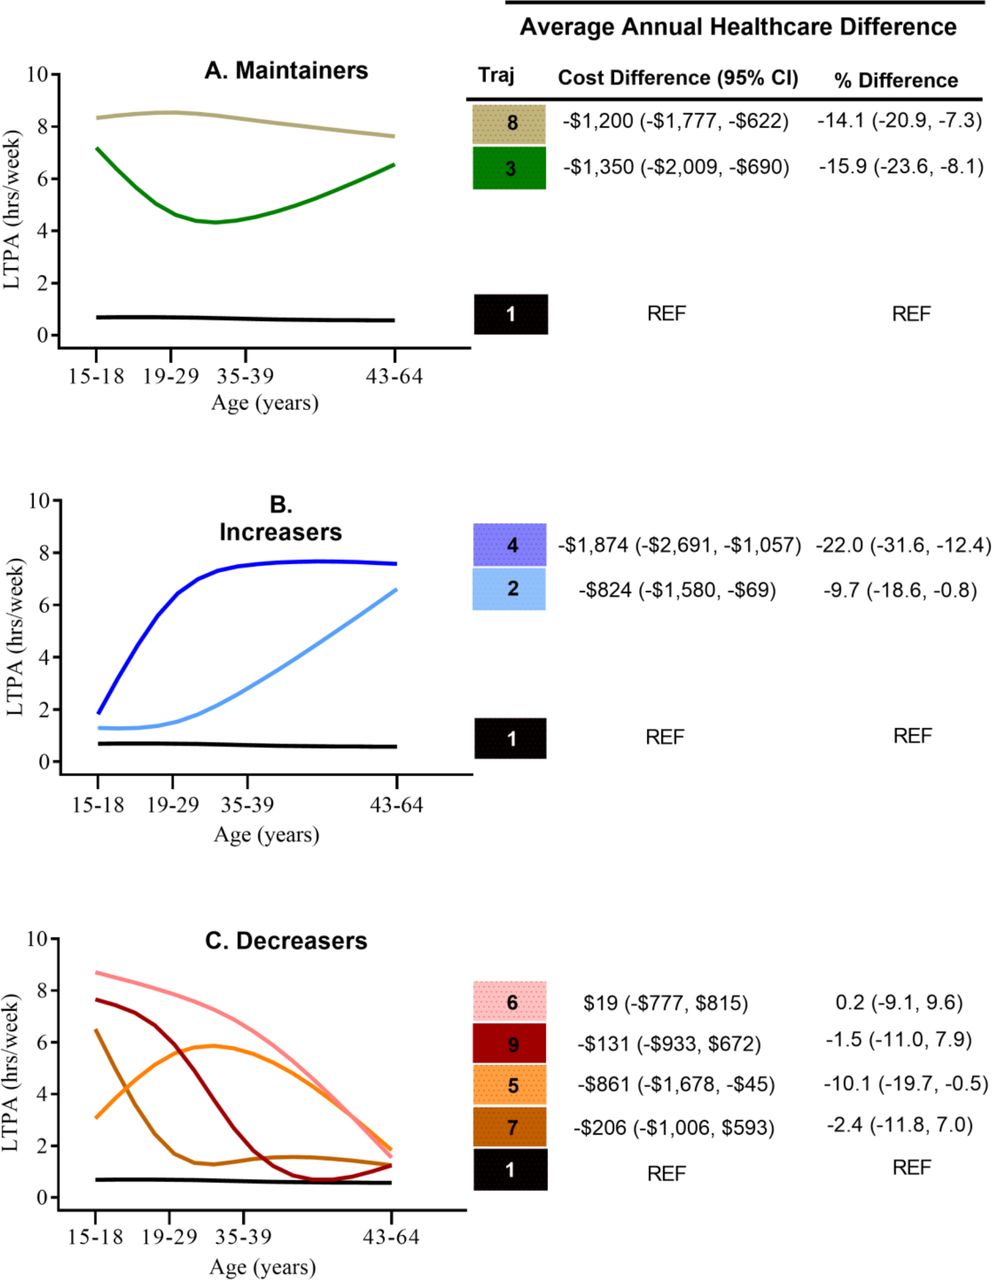
Results Compared with adults who were consistently inactive from adolescence into middle age, average annual healthcare costs were significantly lower for maintainers, adults who maintained moderate (–US$1350 (95% CI: –US$2009 to –US$690) or −15.9% (95% CI: −23.6% to −8.1%)) or high physical activity levels (–US$1200 (95% CI: –US$1777 to –US$622) or −14.1% (95% CI: −20.9% to −7.3%)) and increasers, adults who increased physical activity levels in early adulthood (–US$1874 (95% CI: US$2691 to –US$1057) or −22.0% (95% CI: −31.6% to −12.4%)) or in middle age (–US$824 (95% CI: –US$1580 to –US$69 or −9.7% (95% CI −18.6% to −0.8%)). For the four trajectories where physical activity decreased, the only significant difference was for adults who increased physical activity levels during early adulthood with a decline in middle age (–US$861 (95% CI:–US$1678 to –US$45) or −10.1% (95% CI: −19.7% to −0.5%)).
Conclusion Our analyses suggest the healthcare cost burden in later life could be reduced through promotion efforts supporting physical activity participation throughout adulthood.
- physical activity
- public health
- epidemiology
- longevity
This is an open access article distributed in accordance with the Creative Commons Attribution Non Commercial (CC BY-NC 4.0) license, which permits others to distribute, remix, adapt, build upon this work non-commercially, and license their derivative works on different terms, provided the original work is properly cited, appropriate credit is given, any changes made indicated, and the use is non-commercial. See: http://creativecommons.org/licenses/by-nc/4.0/.
Statistics from Altmetric.com
Key messages
What are the findings?
This study fills the evidence gap in showing that trajectory of leisure time physical activity from adolescence is informative in aiding the understanding of the association with later life healthcare costs.
In a large US sample, we found, healthcare costs in later life were significantly lower for maintainers, adults who maintained moderate (US$1350/year or 15.9%) or high (US$1200/year or 14.1%) physical activity levels and increasers, adults who increased physical activity levels in early adulthood (US$1874/year or 22.0%) or in middle age (US$824/year or 9.7%) compared with adults who were consistently inactive from adolescence into middle age.
In general, adults who decreased their physical activity levels later in later had moderate cost reductions (<US$206/year or 2.4%), only one trajectory, adults who increased physical activity levels during early adulthood with a decline in middle age, showed a significant difference (US$861/year or 10.1%) compared with adults who were consistently inactive.
How might it impact on clinical practice in the future?
Our work may be illustrative to clinicians counselling their patients to maintain or increase their physical activity throughout adulthood.
Individuals can use the physical activity trajectory analysis to consider their likely financial healthcare implications in later life.
Introduction
Physical activity is considered a ‘best buy’ for public health.1 Participation in physical activity is associated with lower risk for several diseases including cardiovascular disease, type 2 diabetes, several cancers and lower risk of premature death.1 In the USA, physical activity levels inadequate to meet current guidelines are associated with annual healthcare expenditures of approximately US$117 billion.2 The importance of examining the cost of healthcare associated with inadequate physical activity trajectories throughout adulthood is relevant to the rising cost of treatment for chronic diseases incurred by individuals, families and the nation.3
Studies investigating the benefit of physical activity on healthcare costs have generally assessed physical activity at one point in time in middle age (eg, 40—60 years)4–6 or during short interim periods.7–9 Physical activity is a modifiable health behaviour that can change over time; therefore, these studies may not provide a complete description of physical activity’s influence on healthcare costs. Adults who maintain or increase their physical activity levels over time experience substantial chronic disease and mortality benefits compared with those who decline.10 11 To fully understand how physical activity is associated with future healthcare costs, it is important to examine patterns in physical activity levels over the life course and the healthcare costs associated with different patterns of change. To date, only one study has examined long-term physical activity with relation to healthcare costs later in life among Australian women.12 Information about the influence physical activity throughout adulthood has on later life healthcare costs can help inform public and private decision-makers on research, policy and physical activity programme priorities.
To improve the understanding of how physical activity may influence later in life healthcare costs, the aim of this study was to examine how leisure-time physical activity (LTPA) participation from adolescence (15–18 years) into early (19–29 years), middle (35–39 years) and later adulthood (43–64 years) is associated with subsequent Medicare costs.
Methods
Study design
The National Institutes of Health (NIH)-Formerly American Association of Retired Persons (AARP) Diet and Health Study has been described previously.13 14 Between 1995 and 1997, a baseline questionnaire was administered to AARP members aged 50–71 years living in six states and two metropolitan areas eligible for the study (ie, not reporting as currently having colorectal cancer, breast cancer, prostate cancer or renal disease). Approximately 6 months later, participants were asked to complete a Risk Factor Questionnaire (RFQ). In 2004–2006, a Follow-Up Questionnaire was mailed to all living participants, and asked for consent to access their Medicare records to sanction the NIH-AARP Medicare dataset.
Analytical sample
The analytical sample used in this study from the NIH-AARP Medicare dataset is derived from two main components. First, the NIH-AARP Diet and Health Study comprised 566 398 AARP members who responded to the baseline questionnaire. This baseline cohort represents about 17.6% of the 3.5 million AARP members who were sent the initial questionnaire.14 Subsequently, 324522 returned the RFQ with 315 059 providing complete physical activity data. To answer our research question, we restricted to the 180 029 respondents less than 65 years of age (first year Medicare entry) without LTPA limitations such as renal disease, emphysema or self-reported to be in poor health.
From the follow-up questionnaire, 313 363 returned the questionnaire consented to or were deceased at the time of Medicare linkage. We further restricted the sample to 74 983 adults with complete Medicare part A+B coverage from the available Centers for Medicare and Medicaid Services files from 1 January 1999 to 31 December 2008 but without Healthcare Maintenance Organisation coverage entitlement. We had 69 780 respondents who received Medicare entitlement due to age and had eligibility for at least 12 months of Medicare claims.
Once both components were linked, the final analytical sample of 21 750 consisted of respondents who had LTPA data and were 65 years of age at time of Medicare eligibility, having at least 12 months of claims data and not having any major chronic condition that limits physical activity (see online supplemental figure S1). Respondent characteristics were based on self-reported history of the following clinical conditions: heart disease, diabetes, osteoporosis and stroke along with self-rated health status from the RFQ.
Supplemental material
Measures
Leisure-time physical activity
The RFQ included a question about participation in moderate-to-vigorous physical activity at ages 15–18 years, 19–29 years, 35–39 years and the past 10 years before study baseline, or in the past 10 years (age range: 43–64 years (mean: 60 years)) (see online supplemental figure S2).
Responses were coded as the midpoint of the ranges in hours/week of LTPA survey response option at each life period (ie, 1–3 hours/week (2.0 hours/week)). Evaluation of the 6-month test–retest reliability for these questions in 870 AARP members (50–74 years) found intraclass correlation coefficients of 0.55 for PA at 15–19 years, 0.53 for 19–29 years, 0.52 for PA at 35–39 years and 0.55 in the past 10 years.15
Consistent with previous work using the main NIH-AARP Diet and Health Study cohort,10 LTPA trajectories were organised using semiparametric group-based mixture models to allow determination of groups of trajectories across age periods. Models to identify LTPA trajectories were computed using SAS Proc Traj.16 We determined the number of trajectories for analysis using the Bayesian Information Criterion associated with models and the sample sizes in the final groups. For each of the final trajectory groups we described the membership probability or likelihood that a participant’s individual LTPA pattern matches that of a certain group/trajectory (ie, which in most models resulted in probabilities of 0.9 or greater) to assure homogeneity and support exclusiveness of group assignment. This was determined using maximum likelihood estimators with polynomial functions of LTPA reported at each time period.
Medicare utilisation and cost
The Medicare linkage employed direct identifiers (Social Security number and birthdate) and data were extracted from the MedPAR (inpatient), Outpatient, Carrier (non-institutional providers such as physicians), Durable Medical Equipment, Skilled Nursing Facilities, Home Health and Hospice files. Claims data were complete in all data files between 1999 and 2008 along with chronic disease information. Services billed to Medicare included the amount reimbursed by Medicare, the funds reimbursed by third-party insurance, and the amount paid by the patient, including deductibles and copayments. From these pooled data, we calculated average total annualised healthcare costs for the time period.4 The Personal Healthcare Expenditure Price Index was used to adjust all costs to 2008 dollars.17
Statistical analysis
First, we examined the association between middle age (aged 43–64 years) LTPA levels and average annualised total healthcare costs later in life using a two-part model.18 The first-part estimated the probability of incurring a healthcare cost over the time period and the second-part fitted a generalised linear model for average annualised total healthcare costs based on Modified Park’s test (Poisson distribution) and goodness-of-link test (log link) with robust standard errors.18 Second, we examined the association between each LTPA group trajectory with average annualised total healthcare costs using the same two-part model process. Associations were determined using the consistently inactive trajectory (ie, participants who reported never, rarely <1 hour/week of LTPA at each of the time points (ie, 15–18 years, 19–29 years, 35–39 years and 43–64 years; trajectory 1) as the referent group). To calculate per cent differences with the referent group, we first estimated marginal effects. The percent difference was calculated by dividing the estimated marginal effects for each trajectory by the estimated reference trajectory cost using the recycled prediction method.19
Covariates included sex, race, marital status, education, smoking history, body mass index (BMI) at age 18 and state of residence at study enrolment from the baseline questionnaire and age and television viewing status from RFQ questionnaire (model 1).
Sensitivity analysis
Additional examinations included BMI at 53–64 years of age to distinguish the effect of LTPA from BMI (model 2). For both middle age and trajectory analyses, we stratify by sex. To assess the consistency of the overall trajectory findings, we present the findings by strict trajectory assignment probability criteria (ie, greater than 0.8 trajectory assignment probability) and after excluding the last 12 months of claims for both models.
All analyses were carried out in Stata v.14.2 (StataCorp). A detailed description of the two-part model (twopm) employed is available in the Stata Journal.20
Patient and public involvement
No patients were involved in the planning, design or research idea for this analysis or data collection for this work.
Results
Participants on average were 60 years of age at the time of baseline questionnaire, mostly white (94.8%), male (54.2%), married (72.3%) and were at least high-school graduates (78.2%). The greater the amount of LTPA a respondent reported at middle age, the more likely they were to report a normal weight (BMI <25 kg/m2) and the less likely they were to be a smoker or have a history of diabetes at baseline (table 1—for full sample characteristics see online supplemental table S1). In this sample, 371 respondents recorded US$0 Medicare-related costs in the time period. We consider these values to be valid and included them in our analyses.
Selected respondent and Medicare-data linkage characteristics stratified by middle age LTPA status
Middle age LTPA and later life healthcare costs
Higher LTPA in middle age was associated with lower average annualised total healthcare costs after age 65 years (see table 2). The average annualised total healthcare cost differences ranged from −US$1365 (1–3 hours LTPA/week) to −US$2079 (7+ hours LTPA/week) per year compared with those reporting <1 hour LTPA/week. This corresponds to 15.0%–22.8% lower healthcare costs for those with higher activity compared with those reporting <1 hour LTPA/week. In sensitivity analyses, the inclusion of BMI at time of questionnaire had a small impact overall, corresponding to overall estimates of 13.4% to 18.9% lower healthcare costs, with a slightly larger impact on females (see model 2 in online supplemental table S2).
Association between middle age LTPA status and average annual healthcare costs in later life
LTPA trajectories and later life healthcare costs
Nine LTPA trajectories were identified reflecting long-term physical activity participation between adolescence (15–18 years of age) and middle age (43–64 years of age). Trajectories were classified into three categories—maintainers, increasers and decreasers based on previous evaluation of mortality outcomes.10 The referent group (Traj 1) included adults who were considered consistently inactive (ie, reported never, rarely or <1 hour/week of LTPA from adolescence into middle age, n=4016 (18.4% of the total sample)). See participant characteristics for each trajectory in online supplemental tables 3–5.
Compared with adults who were consistently inactive from adolescence into middle age (Traj 1), average annual healthcare costs were lower for each of the trajectories examined although not all differences were significant (see figure 1). For maintainers, cost differences for adults who maintained moderate (−US$1350 −15.9%), Traj 3) or high physical activity levels [−US$1200 (−14.1%), Traj 8) were significantly lower than the reference group and comparable to one another. Among the increasers, adults who initiated LTPA participation in early adulthood (increase between 15–18 and 19–29 years (Traj 4)) and maintained higher LTPA throughout adulthood had a significant cost difference of −US$1874/year (−22.0%), while adults who initiated LTPA later in adulthood (after age 35–39 years (Traj 2)) had a significant cost difference of −US$824/year (−9.7%). For the four trajectories where physical activity decreased (ie, higher LTPA early in life followed by reduced activity in early adulthood or middle age—decreasers), the only significant difference was for adults who increased physical activity levels during early adulthood with a decline in middle age (Traj 5: −US$861/year (−10.1%)).

Association between LTPA trajectory and average annual healthcare cost in later life in 1999–2008. Adjusted for age, sex, marital status, race/ethnicity, education attainment, smoking status, BMI at age 18, location of residence and television viewing status (model 1). Per cent difference calculated using recycled predictions of adjusted reference group (reference group: Traj 1 US$8453/year). BMI, body mass index; LTPA, long-term leisure time physical activity.
Sensitivity analyses
With the addition of BMI at time of questionnaire (model 2), the overall association between LTPA and future Medicare costs held for most trajectories although with slight reduction in magnitude (see online supplemental figure S3). Most notably, the cost difference for Traj 2 was no longer statistically significant. The effect of BMI on the association varies between females and males (see online supplemental tables S6 and S7).
We addressed two threats to the validity of our overall results. We limited our analysis to adults with greater than 0.8 trajectory assignment probability (n=18 883, 86.8% of the initial sample) to evaluate the influence of heterogeneity in the trajectory assignments. To evaluate the influence of end-of-life costs on our primary results, we also excluded the last 12 months of claims (table 3). In both analyses, we found similar significant associations to our main analysis for the maintainers (Traj 8 and 3) and increaser trajectory 4. For increaser trajectory 2 and decreaser trajectory 5, while the per cent differences were similar in magnitude to our main analysis, these differences were no longer significant. See online supplemental table S8 for distribution of trajectories for these sensitivity analyses and online supplemental table S9 for analysis with BMI at time of questionnaire.
Sensitivity analysis excluding respondents with trajectory assignment probability <80% and excluding the last 12 months of claims data
Discussion
In this study, adopting and maintaining a physically active lifestyle in adulthood was associated with lower Medicare costs. Respondents who increased their physical activity early in adulthood incurred the lowest average annual Medicare costs in later life. Compared with adults who were consistently inactive, adults who maintained moderate or high physical activity levels throughout adulthood also incurred significantly lower healthcare costs. Our study suggests the national healthcare cost burden could be reduced through health promotion efforts that provide access and opportunities for participation in physical activity throughout adulthood.
Elaboration on main findings
Explanations to why trajectory 4 had the greatest cost reductions is likely related to their health status. These respondents were proportionally less likely to report having a health problem or history of chronic conditions. It is unclear why a decreasing trajectory (Traj 5) was associated with a larger difference in healthcare costs than the other trajectories in this category. The result could be due to the benefits of respondents being physical activity for much of their life with only a later decline in physical activity. The trajectories labelled as decreasers were challenging to categorise due to their heterogeneity. While they all decreased, the timing of this decrease varied. While we present our findings for the broad group of decreasers, this classification may not accurately reflect the true nature of each individual pattern.
Comparison with previous studies
Our findings are consistent with previous studies using a one-time measure of LTPA in middle age that self-reported assessment of physical activity has an association with healthcare costs7 8 21 or with cardiorespiratory fitness.4 22 23 For example, participation in a fitness programme was estimated to produce savings of US$1200 per annum (~15%) for the most active Medicare enrollees.21 Our findings expand on previous studies by using a longitudinal study design9 24 25 to examine economic outcomes by using a rigorous group-based trajectory modelling methodology over a longer time span. Including physical activity participation from adolescence into middle age is a novel contribution to the economic literature on physical activity.26 The recent 12-year trajectories of physical activity and health costs in mid-age Australian women found that maintaining ‘active’ physical activity status was associated with up to 40% lower health costs over 3 years.12 This study used a ‘lasange plot’, a method of modelling changes in categorical variables in longitudinal studies, which does not offer the flexible of conducting sensitivity analysis based on the exposure variable.12 Our longitudinal findings appear to be robust to several potential threats from confounding or bias. Association with Medicare costs by LTPA trajectory patterns were generally similar when more stringent trajectory membership requirements were applied and when we excluded the last 12 months of claims data from each respondent. Future work may wish to examine this association in cohorts with different sociodemographic characteristics, such as race/ethnicity, to further confirm our findings.
Strengths and limitations
Our study has several strengths. We expand on current literature by examining changes in LTPA throughout adulthood in a comprehensive prospective cohort study using a rigorous analytical approach. As opposed to previous epidemiological and economic studies that only included a baseline measure of physical activity, our study takes into account the changing nature of physical activity over the course of adulthood.2 4 5 7–9 27 While the NIH-AARP Diet and Health study respondents are not a probability sample, the respondents come from different geographic regions in the USA and have varying socioeconomic levels based on educational attainment. Our study is the first to avail of the linkage of the survey to Medicare data with a large sample of 21 750 respondents. The analytical approach of using group-based trajectory modelling and subjecting our main findings to sensitivity analysis helps strengthens our findings that physical activity throughout adulthood is associated with lower Medicare costs.
There are also several limitations of this study beyond the attrition of original NIH-AARP Diet and Health Study sample to be included in this study. First, LTPA participation was self-reported using categorical classifications of LTPA duration (hours per week). Reporting of lifestyle behaviours could be susceptible to systematic and random errors, however, there is evidence of validity for historical reports of LTPA.27 Second, available Medicare data were limited to 10 years (1999–2008). To minimise bias, the analytical sample was restricted to those from first year eligibility to Medicare coverage. This reflected the Medicare data of participants in the age range of 65–75 years. Third, our Medicare claims data do not include all health-related costs, most notably pharmacy claims (Medicare part D was introduced in 2006). Fourth, our results are most generalisable to more educated white adults in the USA who were long-term participants in the NIH-ARRP Diet and Health study. Finally, our study is an observational study, and while its prospective design establishes temporal sequence between LTPA and healthcare costs, we cannot rule out residual and unmeasured confounding.
Implications of research
Our study suggests that encouraging people to start and maintain a physically active lifestyle will benefit later-life healthcare costs. About half of the US adult population is not meeting the minimum nationally recommended level of aerobic physical activity.28 There are a number of evidence-based strategies available to help increase physical activity.1 Some strategies involve working with people one-on-one or in small groups to change their physical activity. Other strategies can be implemented more broadly at the community level through programmes, practices and policies that make physical activity an easy choice. Based on our findings, large-scale efforts to improve physical activity could help reduce healthcare costs associated with low-levels of physical activity. For example, Centers for Disease Control and Prevention Active People, Healthy Nation initiative seeks to help 27 million Americans become more physically active by 2027 through implementation of evidence-based strategies across sectors and settings to increase physical activity.29 We envisage that this study may be useful for stakeholders in a variety of disciplines including business, healthcare and policy reaffirming the public health message of the benefits of physical activity.1
Conclusion
Our findings show that adopting or maintaining a physically active lifestyle is associated with lower Medicare costs. Despite recent improvements in US adults meeting physical activity guidelines over the last 10 years, only one in two adults and one in four adolescents participate in sufficient physical activity to meet current aerobic guidelines and this remains a public health concern across the USA.28 Cross-disciplinary efforts to broadly promote and implement strategies that work to improve physical activity are likely to help reduce the burden of low levels of physical activity on healthcare costs.
Acknowledgments
The authors thank the participants of the NIH-AARP Diet and Health Study who allowed for linkage to their Medicare records. Thanks also to John Mullahy (University of Wisconsin) and John Wildman (Newcastle University, UK) for econometric advice; David Leonard (The Cooper Institute Dallas, Texas) and Maryam Doroudi (NCI) for research design support. DC would like to acknowledge the support of the Cancer Prevention Fellowship Program of the NCI and the Health Research Board in Ireland.
References
Supplementary materials
Supplementary Data
This web only file has been produced by the BMJ Publishing Group from an electronic file supplied by the author(s) and has not been edited for content.
Supplementary Data
This web only file has been produced by the BMJ Publishing Group from an electronic file supplied by the author(s) and has not been edited for content.
Footnotes
Twitter @D6Coughlan
Contributors CEM, PFS-M and DC contributed to the acquisition of data, DC, PFS-M, SAC, JF and CEM were involved in the conception and design of this study, DC and PFS-M conducted the analyses, all authors were involved in interpretation of the data; DC prepared the first draft and all authors critically reviewed and revised this several times, with addition of important intellectual content. All authors gave final approval of the version to be submitted.
Funding This research was supported (in part) by the Intramural Research Program of the NIH, National Cancer Institute.
Disclaimer The findings and conclusions in this report are those of the authors and do not necessarily represent the official position of the National Institutes of Health and the Centers for Disease Control and Prevention.
Competing interests None declared.
Patient and public involvement Patients and/or the public were not involved in the design, or conduct, or reporting, or dissemination plans of this research.
Patient consent for publication Not required.
Ethics approval Ethics approval and consent to use this dataset was granted by the NIH-AARP steering committee (Proposal ID: 201705-0016; date submitted 05/08/2017). The Special Studies Institutional Review Board of the US National Cancer Institute approved the study.
Provenance and peer review Not commissioned; externally peer reviewed.
Data availability statement Data are available on reasonable request. The NIH-AARP Diet and Health Study was developed by the Nutritional Epidemiology Branch of the National Cancer Institute (NCI), a component of the National Institutes of Health, to improve our understanding of the relationship between diet and health. (Website: https://dietandhealth.cancer.gov/resource/)Access to this data is available by submitting a proposal via theNIH-AARP Diet and Health Study Tracking and Review System (STaRS) website and approval by the steering committee. The linked Medicare data for this the study is under license and so are not publicly available. Requests for this linked data may also be requested via the STaRS website.