Article Text

Abstract
Objectives In this study, we investigated daily fluctuations in molecular (gene expression) and physiological (biomechanical muscle properties) features in human peripheral cells and their correlation with exercise performance.
Methods 21 healthy participants (13 men and 8 women) took part in three test series: for the molecular analysis, 15 participants provided hair, blood or saliva time-course sampling for the rhythmicity analysis of core-clock gene expression via RT-PCR. For the exercise tests, 16 participants conducted strength and endurance exercises at different times of the day (9h, 12h, 15h and 18h). Myotonometry was carried out using a digital palpation device (MyotonPRO), five muscles were measured in 11 participants. A computational analysis was performed to relate core-clock gene expression, resting muscle tone and exercise performance.
Results Core-clock genes show daily fluctuations in expression in all biological samples tested for all participants. Exercise performance peaks in the late afternoon (15–18 hours for both men and women) and shows variations in performance, depending on the type of exercise (eg, strength vs endurance). Muscle tone varies across the day and higher muscle tone correlates with better performance. Molecular daily profiles correlate with daily variation in exercise performance.
Conclusion Training programmes can profit from these findings to increase efficiency and fine-tune timing of training sessions based on the individual molecular data. Our results can benefit both professional athletes, where a fraction of seconds may allow for a gold medal, and rehabilitation in clinical settings to increase therapy efficacy and reduce recovery times.
- circadian rhythms
- muscle tone
- exercise performance times
- molecular rhythmicity analysis
This is an open access article distributed in accordance with the Creative Commons Attribution Non Commercial (CC BY-NC 4.0) license, which permits others to distribute, remix, adapt, build upon this work non-commercially, and license their derivative works on different terms, provided the original work is properly cited, appropriate credit is given, any changes made indicated, and the use is non-commercial. See: http://creativecommons.org/licenses/by-nc/4.0/.
Statistics from Altmetric.com
Summary box
BMAL1 and PER2 expression show daily changes in human blood, hair and saliva cells, which are distinctive for every individual tested.
Sport performance displays daily variations between 9h, 12h, 15h and 18h and peak performance is time-of-day dependent, with different optimal timing for strength exercises as compared with endurance exercises.
Biomechanical muscle properties in resting muscles undergo daily fluctuations, which correlate with exercise performance and clock gene expression variations observed in saliva.
Salivary gene expression of BMAL1 and PER2 can potentially serve as personalised predictors of exercise performance fluctuations and individual peak times in performance.
Introduction
Physiological and behavioural processes of most organisms follow a daily rhythm of approximately 24 hours in synchrony with the geophysical time. Such rhythms are generated by an endogenous timing-mechanism, the circadian clock, and regulate the timing of cellular processes.1–4 In mammals, the clock consists of a molecular network of core-clock genes and proteins, connected via autoregulatory positive and negative feedback loops that generate ~24 hours rhythms in gene expression.1 2 5 The core-clock elements brain and muscle, ARNT-like (BMAL1) and circadian locomotor output cycles kaput (CLOCK) activate the expression of direct target genes CRY1,2 (CRYPTOCHROME), PER1,2,3 (PERIOD), and the nuclear receptors REV-ERBs (REV-ERBα,β) and RORs (RORα,β,γ).6 The clock network influences many aspects of physiology, through the subsequent regulation of clock-controlled genes, including metabolism, core body temperature (CBT), hormone release, heart rate and sleep/wake cycles6–9 and reviewed in Patke et al.10 The disruption of circadian rhythms negatively impacts health, inducing alterations in metabolism, as well as physical and mental (cognitive) performance and is associated with several diseases (eg, sleep disorders, depression, diabetes, Alzheimer’s disease, obesity, cancer).10–14
Given the regulation of cellular processes and subsequent described impact on physiology, the internal clock is thought to have an influence on the athletic performance, and exercising at different times of day results in different outcomes.3 15–23 Several physiological features which influence athletic performance show circadian variation including CBT,16 hormone levels24 and cardiac dynamics (blood pressure and heart rate variability).25 Accordingly, performance improvements were most often observed in the early evening hours.26 The clock affects exercise performance via core-clock genes (eg, CLOCK and BMAL1), which influence the function and structure of skeletal muscles, where the core-clock machinery seems to be closely aligned to metabolic flux.27–31 Also, specific mutations in PER3 correlated with intra-individual variation in athletic performance at different times of day.32 Exercise, on the other hand, can change the clock machinery as well. Indeed, AMPK (adenosine monophosphate-activated protein kinase), a key energy sensor in skeletal muscle, can reduce the stability of CRY1 and PER2 and serves as a circadian time cue.33–35 Though exercise can affect the circadian clock if practised over periods of many years, the extent and duration of this effect relies heavily on the intensity and duration of the exercise as reported for professional athletes.23 36
However, the putative correlation between expression of clock genes and exercise performance remains elusive. Likewise, the impact of the rhythmic expression of clock genes on the biomechanical properties of muscles (eg, muscle tone) and exercise performance, at different times of the day, has not been systematically investigated. One of the main bottlenecks in the field is the lack of non-invasive and easy to use methods for the molecular characterisation of circadian rhythms. The available methods for clock assessment are either not sufficiently accurate or mostly invasive and often require medical assistance.37–41
Here, we explored the molecular characterisation of the core-clock using different types of human biological samples. We report an effective non-invasive experimental approach to analyse circadian rhythmicity in human peripheral tissues including hair follicle cells and saliva. As a comparison, we also investigated the expression profiles of core-clock genes in human peripheral blood mononuclear cells (PBMCs). The use of saliva is of particular interest as it is non-invasive, contains white blood cells and epithelial cells and hence provides information on gene expression level.42 43 Saliva content relates to health status44–47 and circadian rhythms for human and murine submandibular salivary glands have been reported.48 49 We collected unstimulated saliva from individuals during 45 hours and measured the expression of core-clock genes to generate a molecular profile of the individual’s circadian rhythm. We characterised the circadian rhythm of BMAL1 and PER2 in a group of 15 (7 women and 8 men) participants and compared their circadian profile to the measured variation in exercise performance at different times of the day. We used both strength and endurance performance exercises and complemented these data with measurements of biomechanical properties of resting muscles as an indicator of muscle health status using a non-invasive handheld digital palpation device (MyotonPRO).50 Our data indicated that resting muscle tone has a time-of-the-day variation both in female and male participants. We further used computational methods to correlate the daily variations in exercise performance with fluctuations in molecular and key biomechanical muscle properties throughout a day. Our work forms a basis for non-invasive profiling of the circadian phenotype from easily sampled body fluids (saliva), and non-invasive data collection from resting superficial muscle (tone and stiffness). The sampling can be easily carried out by each participant on-site without clinical support. Thus, the methods reported are appropriate to analyse potential clock dysregulations and may enable us to circumvent them to improve and maintain health. This knowledge can help us to develop preventive measurements to diminish the negative effects of circadian disruption on human physiology and health. Further, it can be used to optimise the timing of exercise leading to increased physical performance or to guide muscle tone and rehabilitation treatment in clinical settings.
Results
Characterisation of circadian phenotypes in peripheral clocks using human biological samples from hair follicles, PBMCs and saliva
To assess the circadian phenotypes of human cells under normal environmental conditions, we developed an experimental pipeline for sampling of different human peripheral tissues, namely hair follicles, saliva and PBMCs from whole blood (figure 1A). We then analysed the data regarding fluctuations in the expression of core-clock genes for the different peripheral tissues (figure 1B–E and online supplemental figure 1). All participants maintained their usual sleep–wake patterns and dietary habits, and no sampling was conducted during night-time, to avoid interfering with their endogenous clock. The anonymised list of participants who took part in the different assays is provided in online supplemental table 1. We analysed the fluctuations in BMAL1 and PER2 expression in every participant using hair, saliva and PBMC samples during 1 day, normalising gene expression to its earliest measurement. To compare the clock in different tissues, we chose three time points, representing early, middle and late time-points of sampling within one circadian cycle (figure 1B–E). Our comparative analysis showed variations in expression for both BMAL1 and PER2 for all sample types and in all participants between time-points. This variation is also detectable in the average expression data from all four participants and for all biological materials tested (online supplemental figure 1A).
Supplemental material

Experimental methodology and sampling schemes for circadian rhythmicity for different human peripheral tissues. (A) RNA for time-course RT-qPCR was extracted (dark blue arrows) from human hair follicles, human saliva and human PBMCs. Red arrows denote sampling time points. (B–E) Three time-point comparison of BMAL1 and PER2 expression for participants 1, 2, 5 and 13 (aged 30.60±7.02 years; mean, SD). Expression data are normalised to the first time-point (early). For hair and saliva data early, middle and late time-points represent 9h, 17h and 21h, respectively. For PBMCs data early, middle and late time-points represent 10h, 16h and 19h, respectively. Depicted are mean±SEM, error bars represent technical replicates. PBMCs, peripheral blood mononuclear cells.
Next, we evaluated circadian rhythmicity of core-clock gene expression profiles in hair samples. We carried out a sampling protocol with multiple time points (figure 1A) for three male participants (participant 1, participant 2 and participant 13). The yield for RNA extracted from female follicles was very low, as previously reported, and more hairs would be required per time point.40 The expression levels of core-clock genes BMAL1 and PER2 in participants 1, 2 and 13 fluctuated over the day (online supplemental figure 1B). BMAL1 expression showed a significant oscillation within the period range of 20–28 hours for participant 2 (harmonic regression, f-test, p=0.038, period=20 hours) and participant 13 (harmonic regression, f-test, p=0.014, period=20 hours).
PBMCs are an important part of the immune system, consisting of lymphocyte and monocyte cells,51 and a mutual interplay between the immune system and circadian rhythms has been previously reported.52–54 We investigated the expression levels of seven core-clock genes (BMAL1, CLOCK, NPAS2, PER2, CRY2, NR1D1 and RORB) for participant 2 (man) and participant 5 (woman) as indicated (figure 1A). All of the genes showed variations in their mRNA expression level over time with one of the genes (PER2) showing significant circadian oscillations for Participant 2 in the period range of 20–28 hours (harmonic regression, f-test, p=4.78E−04, period=20.8 hours) (online supplemental figure 1C). Overall, we obtained comparable variations in the expression of core-clock genes extracted from hair follicles and saliva, in particular for BMAL1 and in Participants 2 and 13, where BMAL1 expression shows a similar change in expression in saliva and hair samples from early, to middle and late time-points (online supplemental figure 1). Altogether, we were able to detect daily variations in the expression of core-clock genes, namely BMAL1 and PER2 using human peripheral tissues and our experimental pipeline. Given the simplicity and the non-invasiveness of the method, we favoured the saliva sampling for future measurements of circadian rhythmicity in humans.
Characterisation of circadian phenotypes in peripheral clocks using a two-day saliva sampling protocol
To increase the statistical power for gene expression rhythmicity analysis, we now used two consecutive days sampling of saliva from each participant with four sampling time-points per day (figure 2A). The saliva collection was performed at 9h, 13h, 17h and 21h on the first day. On the second day, the data were collected at the same time, which allows for the detection of repetitive patterns. For visualisation purposes, the experimental values were then represented using a harmonic regression (figure 2B), which aims at fitting a smooth curve based on linear cosine/sine functions and extrapolates the lack of sampling during the night. We have chosen not to sample during the night to avoid disturbing the sleep/wake cycles of the individuals.
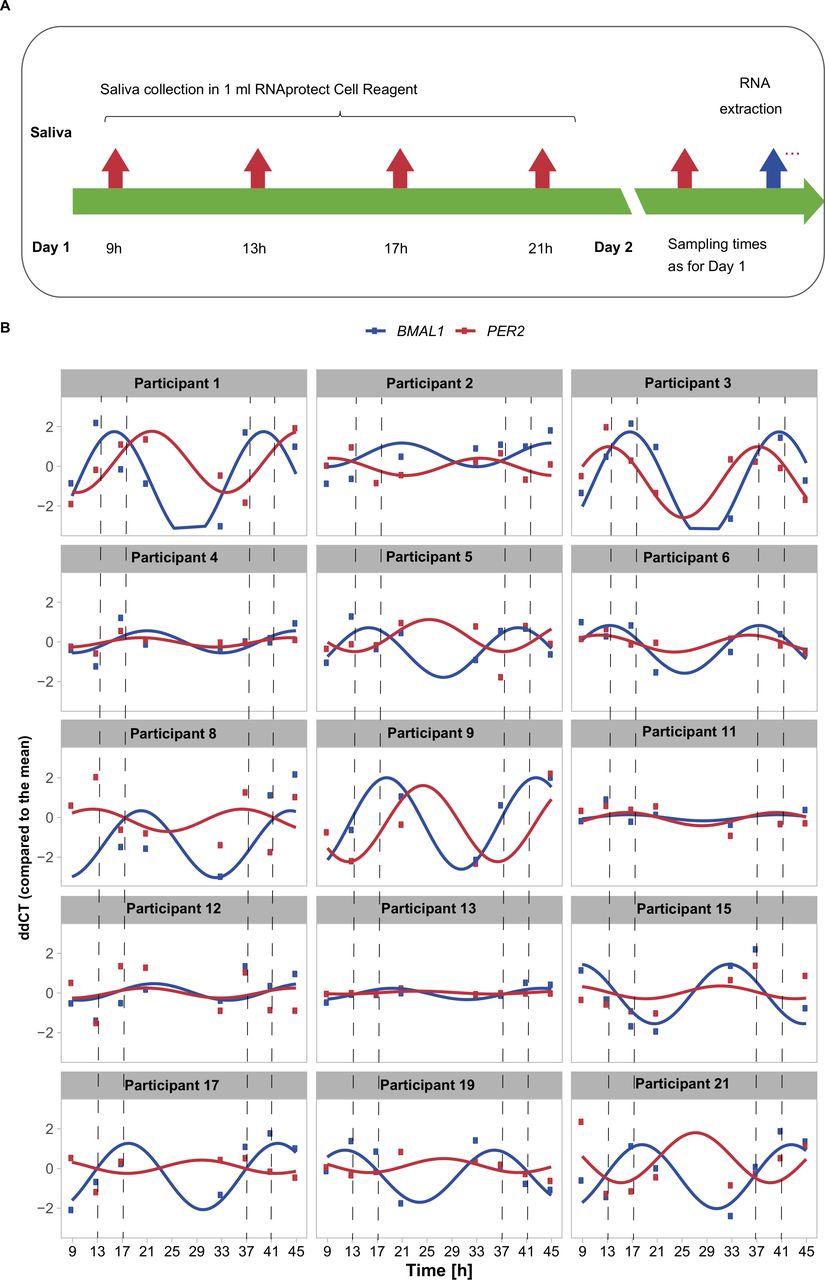
Time-course measurements of unstimulated saliva show fluctuations in gene expression across 45 hours. (A) Sampling schemes for saliva collection at eight time points in two consecutive days (day 1—9h, 13h, 17h, 21h; day 2—as day 1). (B) Time-course RT-qPCR measurements of human saliva normalised to the mean of all time points (ΔΔCT) of BMAL1 (blue), and PER2 (red) of 15 participants (7 women and 8 men) with a fitted linear sine–cosine function (online supplemental table 1).
Of note, for the measurements of RNA expression profile the collected cells in saliva were immediately stabilised and fixed after mixing the saliva with the RNA stabilising reagent (see Materials and methods section).
We measured BMAL1 and PER2 expression over time and analysed circadian rhythmicity (figure 2B, online supplemental table 1) for 15 participants (7 women, aged 31.17±6.05 years; mean±SD and 8 men, aged 31.25±4.65 years; mean±SD). For all participants we detected expression fluctuations both in BMAL1 and PER2, which show intra-participant variability in terms of peak of expression, amplitude of the oscillations and phase shift between the two core-clock genes. In addition to the core-clock genes, we measured the expression of the clock and sport related gene AKT1, a serine-threonine protein kinase, involved in metabolism and the response to aerobic exercise55 56 in eight participants (online supplemental figure 2). Our data show fluctuations of AKT1 expression during the day for all participants tested with a significant correlation to BMAL1 average expression.
Impact of time of day in exercise performance
To investigate the influence of circadian rhythms, namely in the daily expression of clock genes, on exercise performance, we selected a group of 16 sportily active individuals to carry out exercise sessions at different times of the day (online supplemental table 2). To aid in the selection of the exercise times likely to show variations in performance, three participants carried out a hand-strength-test (HST) between 9h and 18h in 1 hour intervals. The results indicated fluctuations in performance across the day with lower values at around 9h and higher performance in the afternoon between 15h and 16h (online supplemental figure 3, online supplemental table 3). Based on this data we selected four time points for the exercise sessions (T1—9h; T2—12h; T3—15h; T4—18h). A total of 6 women (aged 30.17±6.37 years, BMI=19.97 ± 1.30; mean±SD) and 10 men (aged 32.30±4.50 years, BMI=27.04 ± 3.10; mean±SD) participated in the tests (online supplemental table 2). Two rounds of tests were carried out. The first round was conducted over 2 weeks with two exercise sessions per week and the second round was conducted over 4 weeks with one exercise session per week, during the same season. The second round of tests was a repetition of the first round in order to (a) increase the number of participants and evaluate the significance of our findings and (b) to test whether we would obtain similar tendencies in performance (morning schedules vs afternoon schedules) even with a more relaxed exercise schedule (one exercise session per week vs two exercise sessions per week). The repetition round was performed within the same season to avoid potential seasonal influences on the circadian clock and the exercise schedule was arranged in accordance with the sports facility’s capacity. Since for the second round we had considerably less participants who completed all four exercise sessions, in the evaluation of the results, we compared only morning versus afternoon performances and not all four exercise times. Participants completed a health questionnaire at the beginning of the study to assure their good physical conditions.
Assuming that participants did not perform any intense sport activity throughout the study, as requested, the effect of normal daily activities on re-synchronising the body clock would be non-considerable. Of note, for each participant the exercise performance throughout the day was compared between the different time-points during the day for the same participant, and not between different participants.
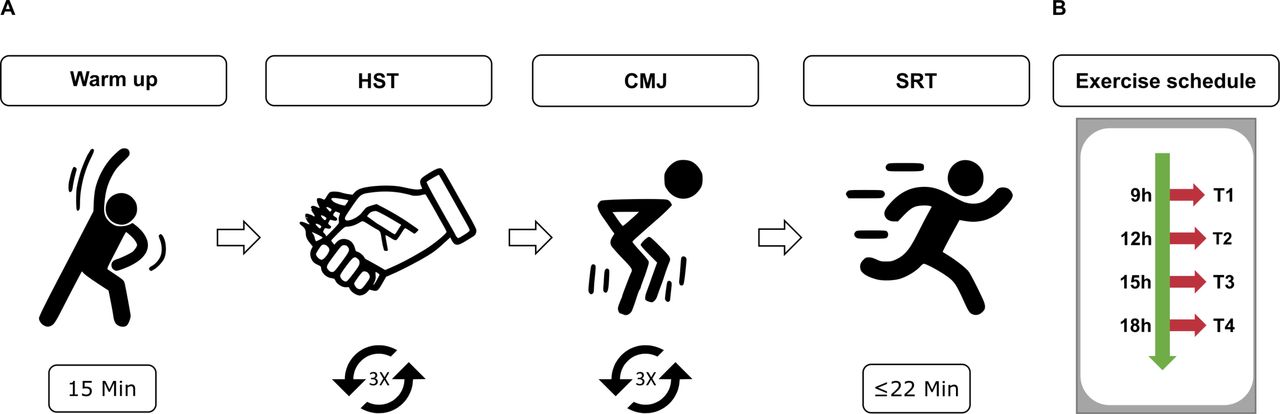
The exercise sessions included a standardised 15 min warm-up programme, followed by three different exercises to assess strength and endurance performances: HST, counter-movement-jump (CMJ) and shuttle-run-test (SRT) (figure 3). Participants were allocated to different groups that fitted their daily routine and to avoid a bias regarding the order of the times of the exercise (table 1). In each exercise session, the participants carried out a familiarisation trial for each exercise. For the HST and CMJ, each participant carried out three repetitions and the average value reached for the specific exercise was considered. Short breaks were introduced in between exercises to avoid muscular fatigue. The warm-up programme aimed at increasing CBT and prepare the body for the subsequent exercises in order to avoid injuries. It involved a gradual increase in intensity in physical activity (a ‘pulse raiser’) and joint mobility and dynamic stretching exercises (online supplemental table 4). The subsequent strength exercises aimed at testing different groups of muscles. The HST measured the force generated when closing the hand using mostly the Musculus adductor pollicis. The CMJ was used to test the strength in the lower limbs (Musculus rectus femoris, Musculus biceps femoris, Musculus gastrocnemius).57 58 To avoid coordinative influence on the results due to arm swing, all participants were asked to keep their arms on the hips during jumping. The SRT (shuttle-run-test), is an aerobic cardiovascular endurance test, widely used to test cardiovascular fitness of athletes.59–61 To minimise motivational influence on the results, participants were only informed on the results of their exercise performance at the end of the entire test series. In addition, the participants completed the Morningness/Eveningness Questionnaire62–64 for an overall evaluation of the individual chronotype, and were allocated to one of five categories: definite morning type (DMT), moderate morning type, intermediate type, moderate evening type and definite evening type (DET). Within the group of participants there were no extreme chronotypes (DMT, DET) (figure 4A, online supplemental table 2).

Schematic representation of the exercise. (A) An exercise session consisted of 15 min warm up and three exercises (approximate duration of 15 min/exercise): 3×HST, 3×CMJ, 1×SRT. (B) Exercise schedule. CMJ, counter-movement-jump; HST, hand-strength-test; SRT, shuttle-run-test.
Time-schedule for the exercise sessions for each participant

Analysis of exercise performance for all participants. (A) Chronotype distribution from all individuals who performed the exercise tests (round one and two). (B) Cumulative ranking scores for all participants and exercise (n=19, three participants took part in both rounds). (C) Overall z-scores scores for participants who completed all four exercise sessions (n=15) (D, E, F) Z-scores per exercise (n=15), and overall z-scores (G, H, I) for women (n=6) and (J, K, L) men (n=9) who participated in all four exercise sessions. Significance is provided relative to the first time point (9h), the median value is indicated. *p<0.05, **p<0.01, ***p<0.001; Friedman test. CMJ, counter-movement-jump; HST, hand-strength-test; SRT, shuttle-run-test.
To analyse the daily variation in exercise performance, we used a ranking system and attributed points to each performance per participant and exercise. The best test result was given four points, the second best three points, the third best two points and the worst result received one point (figure 4B, online supplemental table 5). The overall exercise performance was highest at 15h (figure 4C). Interestingly, while the strength exercises (HST and CMJ) showed a maximum of performance at T3, the endurance exercise (SRT) had a maximum at T4 (figure 4D, online supplemental figure 1). The overall performance was significantly higher during the afternoon (T3, T4) as compared with morning-times (T1, T2) (figure 4E). Overall significant differences were observed for T1 vs T3 (Friedman test, p=0.034), T3 vs T4 (Friedman test, p=0.005) and T2 vs T3 (Friedman test, p=0.005) (figure 4C). In particular, we found statistical differences for CMJ (Friedman test, T1 vs T3, p=0.034, T2 vs T3, p=0.005 and T3 vs T4, p=0.005) and for SRT (Friedman test, T1 vs T2, p=0.0003, T1 vs T3, p=0.0008, T2 vs T4, p=0.027 and T3 vs T4, p=0.011). We further analysed possible gender differences in daily variation of exercise performance and found similar time variation in performances for both genders (figure 4G and H). For men we observed statistically significant results for CMJ (Friedman test, T1 vs T3, p=0.015, T2 vs T3, p=0.005 and T3 vs T4, p=0.005) and for SRT (Friedman test, T1 vs T2, p=0.017, T1 vs T4, p=0.00003 and T3 vs T4, p=0.034). See online supplemental table 6 for statistical analysis for the exercise sessions for each test and for gender wise comparison of the results. Both male and female participants have best performance for the CMJ exercises at 15h and for the SRT test at around 18h. Thus, both male and female athletes would profit from exercise at specific times of the day. Additionally, we compared the results of the first and second round of tests independently (peak performance time) and observed in both cases an overall better performance in the afternoon sessions as compared with the exercises carried out in the morning sessions (online supplemental figure 4).
Supplemental material
Daily fluctuations in muscle biomechanical properties
To capture a potential daily variation in biomechanical characteristics of muscles, which correlates with the observed differences in exercise performance, we used a portable handheld device, the MyotonPRO, for digital palpation that measures different parameters related to muscle tone, biomechanical and viscoelastic properties of muscles.50 65 66 We measured six different muscles (figure 5A): Musculus deltoideus, Musculus triceps brachii, Musculus adductor pollicis, Musculus biceps femoris, Musculus rectus femoris and Musculus gastrocnemius (online supplemental table 7). We focused our analysis on the frequency (F), as oscillation signal representing muscle tone (figure 5B–F), this was reported to be associated with higher exercise performances.67 We observed significant variations in resting muscle tone across the different exercise session times and observed significant fluctuations (Friedman test, p<0.05) in resting muscle tone across the day for both female and male participants (online supplemental table 8, online supplemental figure 5). Interestingly, while M. adductor pollicis has a higher tone at 15h, which correlates with the peak of performance for HST, the muscles of the lower limbs show diverging daily fluctuations. Both the M. biceps femoris and M. rectus femoris showed reduced frequency signal values (Hz) and thus lower tone at 15h, but the M. gastrocnemius showed increased values, and thus higher tone at the same time. These muscles were mainly used during CMJ, which also shows a performance peak at 15h. Thus, the increased resting tone of the M. gastrocnemius seems to contribute the most to the daily variation in CMJ performance.

Myotonometric analysis shows daily variation in resting muscle tone (frequency, F). (A) Schematic representation of skin measurement points (MP) at the arms, hands and legs. MP1—M. deltoideus, MP2—M. triceps brachii, MP3—M. adductor pollicis, (activated mainly during HST), MP4—M. rectus femoris, MP5—M. biceps femoris, MP6—M. gastrocnemius (activated mainly during CMJ). Only participants who completed all exercise sessions were included in the myotonometric analysis (n=11). (B) Z-scores for the myotonometric parameter frequency (Hz) for each exercise session (9h, 12h, 15h, 18h) and each muscle (M. deltoidus, M. triceps brachii, M.adductor pollicis, M. rectus femoris, M. biceps femoris, M. gastrocnemius, respectively). The measurements were carried out from top to bottom on the right (R—blue line) and the corresponding left (L—red line) side of the body. A gender-based analysis is presented in online supplemental figure 5. Significance is provided relative to the first time point (9h), the median value is indicated. *p<0.05, **p<0.01, ***p<0.001; Friedman test. CMJ, counter-movement-jump; HST, hand-strength-test.
Correlation between molecular, biomechanical and exercise performance data using a computational analysis
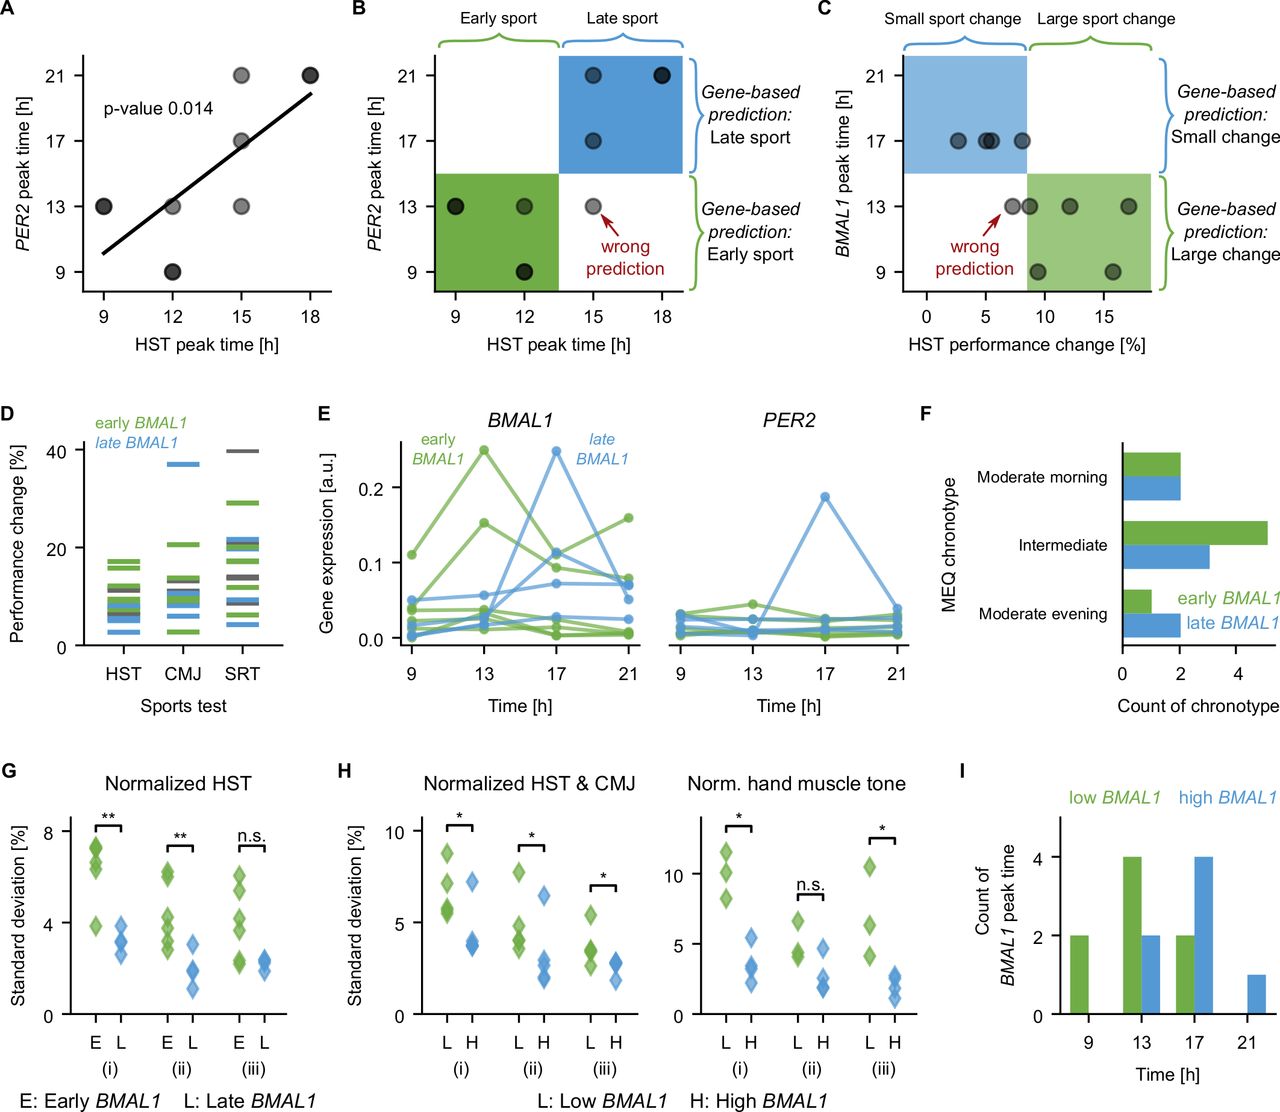
To evaluate the potential power of the circadian molecular profile obtained from saliva in order to predict two salient features of exercise performance, we carried out a pilot analysis of the 10 participants with both molecular and exercise data (5 men, 5 women). Of major interest for athletes is the time of the best exercise performance (peak performance time), as well as the amplitude of the daily variation in exercise performance. For the HST, both peak and variation in exercise performance of individuals can be predicted from their respective genetic data by machine learning. Our analysis suggests that HST peak performance time is correlated with PER2 (figure 6A, p = 0.014). This correlation can be used to predict whether the HST peak time occurs early (9h or 12h) and late (15h or 18h) based on the PER2 peak time: an early PER2 peak predicts an early HST peak, and a late PER2 peak predicts a late HST peak, resulting in nine correct and just one false predictions (figure 6B). The prediction of the peak HST time can be successfully repeated using a machine learning algorithm. For that, we trained a classifier (linear support vector machine) 10 times on nine out of 10 participants, and attempted to predict the HST peak time as early or late for the left-out participant. Performance could be predicted with an accuracy of 80% when providing the PER2 peak time as input. When using the full profile of mean-normalised PER2 expression levels as input for the predictions, the prediction accuracy was increased to 100%, that is, all attempted predictions were correct. Improved predictions likely result from the higher content of information in the full genetic profile compared with the single information on the peak time.
Correlations between molecular rhythms of core-clock genes, muscle tone, and exercise performance. (A) The peak time of PER2 correlates with the time of peak performance of the HST (linear regression with p=0.014). (B) The peak expression of PER2 plotted against the peak performance of the hand-strength-test (HST) as in (A) (dots). The peak expression of PER2 can be used to predict whether the HST performance peak is early (green, 9h or 12h) or late (blue, 15h or 18h). Using an early PER2 peak to predict of an early HST performance peak, and a late PER2 peak to predict a late HST performance peak, as marked on the right side of the graph, results in five correctly classified subjects with early HST performance peak (green box), four correctly classified subjects with late HST performance peak (blue box) and one subject with late HST performance peak classified wrongly as early (lower right quadrant). (C) The peak expression of BMAL1 plotted against the diurnal change in exercise performance of the hand-strength-test (HST) for 10 participants (dots). Using the peak expression of BMAL1 to predict whether the change in HST performance is large (top five subjects) or small (lower five participants) as marked on the right of the graph results in five correctly classified participants with large changes (green box), and four correctly classified participants with small changes (blue box), and one participant with small changes in HST performance classified wrongly as large change (lower left quadrant). (D) Performance change over the day (max compared with min), colour code as in (E). (E) Red and blue groups have an early and late BMAL1 peak time, respectively. (F) Early or late BMAL1 peaks occur in any of the three investigated MEQ chronotypes, see also online supplemental figure 6A). (G) SD calculated on the normalised HST performance for data from different (i) repetitions and timepoints (p=0.0095), (ii) timepoints (p=0.0095), (iii) repetitions (p=0.057), Mann-Whitney U test. (H) Separating the groups by the mean expression level of BMAL1 instead of the peak time results in significant differences in the SD of the exercise performance of HST and CMJ (left, Mann-Whitney U test, all p=0.0476) and of the hand muscle frequency (right, Mann-Whitney U test, p=0.0286, p=0.11, p=0.0286). Non-significant differences for exercise and muscles data are shown in online supplemental figure 6E–H). (I) Histogram of the time of the day with the highest BMAL1 expression based on the eight saliva samples. Significantly earlier peaks are found for the group with low BMAL1 expression (ranksum test, p=0.044). CMJ, counter-movement-jump; HST, hand-strength-test; MEQ, Morningness/Eveningness Questionnaire; SRT, shuttle-run-test.
The diurnal change in HST performance, that is, the difference between maximum and minimum performance normalised by the minimum performance, varies between 3% and 17% (figure 6C), and we found that whether a participant has a small diurnal change (up to 8.5%) or a large change (above 8.5%) can be predicted based on BMAL1. The HST change correlates with the peak of BMAL1 expression (linear regression with p = 0.032), and, as above, this correlation allows for a direct prediction of the HST change (figure 6C). Attempting this prediction via machine learning results in a good accuracy of 0.9, that is, out of the 10 attempted predictions, nine were correct and one was false.
The relation between performance change and BMAL1 peak is weaker for the other exercise tests (figure 6D, corresponding BMAL1 profiles are shown in figure 6E). Chronotypes cannot be used to predict exercise performance, as peak times do not correlate with chronotype (figure 6F, online supplemental figure 6A). The observed HST change, which can in alternative be quantified as the SD calculated over all HST data points (figure 6G (i)), seems to result from diurnal variation and not merely from sport repetitions, since grouping participants by BMAL1 peak results in different SDs when considering the temporal change of the mean of the repetitions (figure 6G (ii), p<0.01), but not for SDs for the repetitions (figure 6G (iii), Mann-Whitney U test, p=0.057). A large performance change over the day is thus predicted by an early BMAL1 peak time. In addition, we find that a large performance change is also related to a small mean level of BMAL1 expression: calculating SDs for two groups with low (<0.04) and high (>0.04) BMAL1 mean expression levels, we found significant higher SDs for the group with low BMAL1 levels for the mean of HST and CMJ (figure 6H left panel, Mann-Whitney U test, p<0.05), as well as for the muscle tone of the hand muscles (myotonometric data for three men, four women), figure 6H, right panel, Mann-Whitney U test, p(i)=0.029, p(ii)=0.11, p(iii)=0.029). We thus find larger fluctuations in performance (HST and CMJ) and muscle tone (hand) for participants with low mean BMAL1 levels. Indeed, in our data, BMAL1 levels and BMAL1 peak time are related, participants with low mean BMAL1 level showed significantly earlier BMAL1 peak times (figure 6I, Mann-Whitney U test, p=0.044).
As reported previously,68 the mean BMAL1 levels differ between participants with a professional sports background versus active but amateur participants (online supplemental figure 6B, Welch’s t-test, p<0.0001). Our data also show a significant difference of mean BMAL1 levels between men and women (online supplemental figure 6C, Welch’s t-test, p<0.0001), and the visual separation is even more prominent when plotting the PER2/BMAL1 ratio (online supplemental figure 6D, Welch’s t-test, p<0.0001); all participants with high ratios in online supplemental figure 1D are women. A larger sample is required to distinguish which feature, sex or sports level, is more salient to explain differences in BMAL1 level. Both trends are not visible for the 10 participants used for the predictions above; the groups of five participants with low or high BMAL1 levels contain each two or three men and women, as well as sports professionals and amateurs.
Our analysis suggests that the circadian oscillation of exercise performance mainly depends in its amplitude on BMAL1 expression and in its phase (peak performance) on the expression of PER2. For the HST, we can predict early versus late peak performance based on the peak expression time of PER2, or even better based on the circadian profile of PER2, and we can predict small versus large diurnal changes in performance based on the peak expression time of BMAL1, or, in alternative, the mean expression level of BMAL1 (for HST and CMJ). The mean expression level of BMAL1 also correlates with muscle tone. To decide whether BMAL1 peak time or mean expression level is the best predictor for diurnal variation in exercise performance more data are needed.
Discussion
The circadian clock regulates several aspects of physiology (CBT, hormone release, heart rate, metabolism), which impact athletic performance.3 69 70 In the current study, we aimed at finding molecular (gene expression) and physiological (muscle tone) connections determined from human body fluids (saliva), peripheral cells (hair follicles, PBMCs) and biomechanical muscle properties and investigated their contribution to exercise performance in healthy human individuals at different times of the day.
Characterisation of circadian rhythms in human biological samples
To date, the available methods for assessment of the circadian phenotype using human biological material include dim light melatonin onset (DLMO),37 blood samples,37–39 71 hair samples (hair follicle cells) and urine samples.40 41 These methods are either not sufficiently accurate or invasive and often require medical assistance and thus are not easy-to-perform.37–40
Here, we explored a method of saliva sampling as a reliable, non-invasive and easily accessible source of biological material to determine rhythmic gene expression in humans. Our method can be used in any environment and without the need for medical supervision. The sampling interval during the active phase (9h to 21h) allows individuals to keep their normal daily rhythm, which could be perturbed by sampling during the sleep phase. Our saliva gene expression data show that BMAL1 and PER2 rhythms, as well as the apparent phase shift of BMAL1 and PER2 varies between individuals. However, it seems that BMAL1 fluctuations throughout the sampling period are higher than PER2 for all individuals tested. Interestingly, the diurnal variation in the expression of AKT1 (which regulates clock and aerobic exercise outcome),55 56 detectable in human saliva samples, closely follows that of BMAL1 in the tested participants, which hints towards the circadian regulation of exercise and physical performance throughout the day.
Differential exercise performance within 24 hours: strength versus endurance peak performance times
The results from our exercise performance tests indicated a significant difference between the exercise performance in the morning and in the afternoon with a peak at 15h, and no significant difference in exercise performance between the morning exercise sessions (9h vs 12h). These results are consistent with previous studies, which found that athletic performance is higher later in the day.15–19 26 32 72 Diurnal performance variations on the order of 10% were also observed in other studies,18 reviewed by Drust et al.15 The peak of performance correlates with the known peak time of CBT, and increased CBT due to warm environments seems to diminish diurnal variations in athletic performance.16 In our study, we evaluated performance at two time points in the afternoon (15h and 18h). Interestingly, despite the reduced motivation reported by some participants to execute the tests at later times, their athletic performances did not decrease in the course of the test series and was still better in the afternoon exercise sessions in comparison to morning.
Drust et al found that athletic performance of skill-based exercise (coordinative exercises) and those requiring complex competitive strategies and decision-making are better completed in the morning. Exercise that requires high effort and strong physical performance performed better in the evening.15 Our results showed that strength tests (CMJ and HST) displayed better results at 15h as compared to the morning exercise sessions. Previous studies have also reported diurnal variation in CMJ with the best performance at 16h.19 73 In contrast, the endurance performance of the SRT in our study was the lowest at 9h and the highest at the latest exercise session, which started at 18h. Thus, our SRT tests were carried out almost 1 hour after the start (at around 19h) in agreement with the results of Facer-Childs et al that showed a maximum performance in the SRT at 19h for late circadian types.18 74 Interestingly, the daily variation in performance was observed for both genders, and thus both male and female athletes would benefit from an exercise, which is optimised to the time of the day and their internal clock.
Muscle tone shows a 24 hour fluctuation and influences performance
Our results show that there is a close relationship between athletic performance and resting muscle tone and suggest that increased frequency signals reflecting resting muscle tone could result in a higher performance outcome of a particular muscle. This is in agreement with a previous study which showed that higher muscle tone is good for better performance in sub-elite football players.67 In our study, the variations in muscle tone in the upper extremities also correlates with the variation in exercise performance in the course of the day in the HST. Likewise, variation in the tone for M. gastrocnemius correlates with the performance peak for CMJ. Thus, the observed daily variations in the parameters are not a causality of the exercises, but rather of the internal daily variation in physiology.
Can circadian rhythm profiles be used to predict individual times for best exercise performance?
Chronotype and time since awakening seem to be important predictors for the athletic performance.18 74 For a personalised prediction, however, the chronotype is in our case not sufficient (online supplemental figure 6A). On the molecular level, the circadian clock influences exercise outcomes and exercise itself serves as a strong circadian time cue75 and reviewed in Wolff and Esser.23 For instance, the average core-clock gene expression (BMAL1, ROR-α, CRY1, PER2, PER1 and NR1D1) in blood samples of male rugby players was significantly higher than of a control male group.68 It was also shown that jetlag (circadian misalignment) impairs athletic performance in major league baseball players with striking effects on home runs.76 In our study, we observed variation in the expression of the core-clock genes BMAL1 and PER2 across the day. Despite the complex interplay between biological clock and physical activity, we can use gene expression profiles to predict properties of exercise performance. We identified PER2 as predictor for the timing of exercise performance, compatible with a previous study where PER2 was particularly suitable to predict internal time as measured by DLMO.38 Both genes seem to contain information, which together allows to predict individual optimal exercise performance time. Interestingly, while for PER2 this information is related to the peak time of expression, for BMAL1 our study suggests that the information is related to both the peak time, as well as the overall expression level between participants.
Limitations
Our data provide a strong indication for the influence of circadian rhythms at the molecular and physiological levels in exercise performance, still to increase statistical power, more participants would be needed. While resting muscle tone determined by non-invasive myotonometry can be used as indicator for acute muscle status for example in apparently healthy normal populations, as well as in athletes, the exact mechanisms of resting muscle tone outcome (ie, structural, metabolic, neurophysiological) remain to be determined. Likely muscle groups or athletes with higher performance potential may show stronger fluctuations over the course of the day. Routine electromyographic (EMG) recordings (to verify resting tone neurophysiologically) were not performed due to the non-invasive study character. Future studies should also consider larger groups of participants with extreme chronotypes and with stronger variability in the expression of core-clock genes. In addition, it would also be important to consider seasonal fluctuations and thus repeat molecular, myotonometric and exercise sessions four times throughout the year.
Conclusions
The characterisation of an individual’s clock (ie, circadian rhythms) based on the expression of clock genes can aid to schedule different daily activities or exercise sessions with profound implications for physiology and exercise performance. Our data showed higher exercise performance in the late afternoon, in agreement with previous data with significant variations in performance, depending on the type of exercise (eg, strength vs endurance) and the individual. In addition, expression of core-clock genes and muscle tone changed during the course of the day and a higher resting muscle tone correlated with better performance both in female and male participants. Various training programmes can profit from these findings to increase outcome efficiency. For example, high-performance athletes often have two training sessions a day, according to our results training sessions that require mostly strength should be carried out in the mid afternoon while exercises that require more endurance capacity rather in the late afternoon and evening. The timing of the training session can be further fine-tuned based on the individual molecular data for the core-clock genes. Both professional athletes, for whom a fraction of a second decides on a gold medal, and individuals who have the possibility to organise their physical training at different times of the day can benefit from it. Also the efficacy of rehabilitation programmes or general training protocols can likely be optimised and increased if the training is adapted to the circadian rhythms of each individual. This can be achieved by personalised circadian rhythm analysis with simple non-invasive tests and implemented in future training scenarios.
Materials and methods
Sampling and RNA isolation of hair follicle cells
Prior to all sampling procedures, participants refrained from eating, drinking (and oral hygiene procedures, only for saliva sampling, described below) for at least 1 hour prior to sample collection. Caffeine and high sugar drinks were avoided during the sampling days. The sampling scheme is shown in figure 1A. Samples from three male participants were collected; at each time point, 10 hairs were pulled from the scalp and stored in 5 mL RNAlater (Qiagen, Hilden, Germany) at 4°C before usage. For the RNA extraction, samples were homogenised with TRIzol (Thermo scientific, Massachusetts, USA) using a BeadBug 6 Homogenizer (Benchmark Scientific, Sayreville, New Jersey, USA) according to the manufacturer’s instructions followed by incubation for 5 min to allow for the complete dissociation of the nucleoprotein complex. Subsequently, 0.2 mL chloroform (MERCK, Darmstadt, Germany) were added and the solution was centrifuged for 15 min at 12 000 ×g at 4°C. After centrifugation, to remove genomic DNA, the aqueous phase was taken and passed through a gDNA column (supplied by the RNeasy Plus Mini Kit, Qiagen) with centrifugation at maximum speed for 3 min. Pre-cooled 75% ethanol and isopropanol were used for the total RNA precipitation and purification following the manufacturer’s instructions (TRIzol). For cDNA synthesis, 500 ng RNA were reverse transcribed as described below.
RNA isolation and purification in human PBMCs
Blood (7 mL) was drawn into a 9 mL blood collection tube VACUETTE (Greiner bio-one, Kremsmünster, Austria) containing EDTA. The blood was diluted with a supplement of 10 mL PBS (Gibco, California, USA) containing 2% FBS (Gibco). Subsequently, the blood was deposited on top of 10 mL Lymphoprep (Stem Cell Technologies, Vancouver, California, USA) to avoid mixing of the fluids. The final solution was centrifuged at 800×g for 20 min at room temperature. The mononuclear cell (MNC) layer was absorbed and washed twice with pre-warmed PBS. 4.5 mL RPMI 1640 (Gibco, California, USA) were added into the MNC and separated evenly into 5 mL polystyrene tubes (DB Falcon, New Jersey, USA). Time point 0 was defined when all samples were placed at 37 °C in a humidified atmosphere with 5% CO2. The sampling scheme is shown in the figure 1A, samples from two participants, one man and one woman, age, 35.5±8.5, were harvested at 10h, 13h, 16h, 19h. In contrast to the repeated sampling of hair and saliva, the blood drawing only took place once followed by repeated RNA extractions from isolated PBMCs. For RNA extraction of MNC, the RNeasy Micro Kit (Qiagen, Hilden, Germany) was used according to the manufacturer’s instructions.
Sampling and RNA isolation of human saliva
For the first round, saliva was collected at five time-points during two consecutive days (day 1: 9h, 13h, 17h and 21h; day 2: 9h). In the second round, eight samples were collected during two consecutive days (day 1: 9h, 13h, 17h and 21h; day 2: 9h, 13h, 17h and 21h). At each collection time point, ca. 1 mL of unstimulated saliva was collected in a pre-cooled 2 mL tube containing 1 mL RNAprotect Cell Reagent (Qiagen, Hilden, Germany) and mixed immediately to stabilise the saliva RNA. Participants were asked to wash their mouth 5 min before each sampling time-point with water (without swallowing the water) and to collect only unstimulated saliva (no tissues or mucus) in each sampling tube after the washing step, in order to avoid any sample contamination. The collected samples were kept at −20°C until RNA extraction. Prior to RNA extraction, the saliva/RNAprotect Cell Reagent mixture was thawed completely and equilibrated to room temperature. RNA extraction was performed using a combination of the methods as described in the manufacturer’s instructions of TRIzol (Invitrogen, Thermo Fisher Scientific, Carlsbad, California, USA) and RNeasy Micro Kit (Qiagen, Hilden, Germany). The samples were centrifuged at 10 000×g for 10 min at room temperature to generate cell pellets. Pellets were homogenised with 500 µL TRIzol followed by the addition of 100 µL chloroform. After centrifugation, the top aqueous phase containing the total cell RNA was mixed with 70% ethanol and transferred into a RNeasy MinElute spin column (Qiagen, Hilden, Germany) and further processed according to the manufacturer’s instructions. Fifteen individuals participated in the saliva study (seven women, eight men).
Patient and public involvement
Patients and/or the public were not involved in the design, or conduct, or reporting, or dissemination plans of this research (see also Ethics Approval).
cDNA synthesis and RT-qPCR
For RT-qPCR analysis, the extracted RNA was reverse transcribed into cDNA using M-MLV reverse transcriptase (Invitrogen, Thermo Fisher Scientific, Carlsbad, California, USA), random hexamers (Eurofins Genomics, Ebersberg, Germany) and dNTPs Mix (Thermo Fisher Scientific, Waltham, Massachusetts, USA). RT-qPCR was performed using human QuantiTect Primer assays (Qiagen, Hilden, Germany) and SsoAdvanced Universal SYBR Green Supermix (Bio-Rad laboratories, Hercules, California, USA) in 96-well plates. The qPCR reaction was performed using a CFX Connect Real-Time PCR Detection System (Bio-Rad laboratories, Hercules, California, USA) using QuantiTect Primer Assay (Qiagen, Hilden, Germany). A melting curve analysis was performed to detect potential non-specific amplification products. The expression levels were first normalised to GAPDH (ΔCT) and then to the mean expression value of each gene (time-course analysis), to the expression of the target gene in the early time-point (comparative analysis) or in relation to the respective control gene (BMAL1) for single-time point data (ΔΔCT). The relative quantification was performed using the 2−ΔΔCt method.77 Technical triplicates were included into RT-qPCR data of human tissues.
Analysis of rhythmicity
Circadian rhythmicity of genes was tested (significance was bounded by p value<0.05) and circadian parameters (phase and relative amplitude) were determined for sample sets with at least seven data points (3 hours sampling interval) for a period range of 20–28 hours with a 0.1 hour sampling interval by fitting a linear sine-cosine function to the time-course data (ΔΔCT normalised to the mean of all time points) using the R package HarmonicRegression.78 The harmonic regression procedure fits the model y(t)=m+ a·cos(ωt)+b·sin(ωt) in order to estimate absolute amplitudes (A=√(a2 +b2)) and phases (φ=a·tan2(b,a)) along with confidence intervals and p values.78
Statistical analysis
Overall variation assessed between exercise performance tests at different times, using a ranking approach. Each participant was given a rank score from 1 to 4 according to their individual maximum and minimum performance using rowranks function in R matrixStats package (V.0.56.0). These scores were summed up for each test. Following overall assessment of the ranks, raw data were normalised based on each participant’s respective average. Then, z-score transformation which is formulated as z= (x−μ)/σ) implemented using rowMeans and rowSds function compiled in matrixStats package (V.0.56.0). The boxplots were generated using ggplot2 package in R (V.3.3.0). The data analyses were carried out for the individuals who completed four exercise sessions (n=15). For pairwise comparisons, total rank sums for each time point and normalised raw data were compared using the Friedman test functionality in rstatix package. The results were corrected using false discovery rate (FDR) and the statistically significant values are depicted based on the FDR adjusted p values (q values) threshold 0.05.
Exercise test: technical setup
Warm-up programme: A 20 m track marked with a cap was used. The different exercises and their functions are described in online supplemental table 2. HST: The manual force measurement was carried out with the EH101 (Deyard). Each participant carried out a familiarisation trial, care was taken to ensure that the elbow joint (Articulatio cubiti) was bend at a 90° angle and that no abduction took place in the shoulder joint (Articulatio humeri). CMJ: the participants carried out the measurements on a 1D four channel force plate (four piezo sensors equipped plate, Freie Universität Jena, Custom-Made). The force plate was connected to a standard PC. LabVIEW 2017 Version 17.0.1d3 (https://www.ni.com/de-de/support/downloads/software-products/download.labview.html#329486) was used to produce a force curve, the difference between the max and min values on the curve were extracted for each participant and used for further analysis. SRT: the participants were required to increase the running speed for each 20 m (marked by lines) shuttle to be able to keep track with the shortening intervals between the audio cues of the different levels, and were allowed two failed attempts to reach the line. On the third failure the test was stopped and the total running time reached by the participant was recorded. The participants could also abort the test at any time, and the time achieved was recorded. A commercially available speaker connected to an iPad with an app from the Institute for Applied Training Science (https://www.iat.uni-leipzig.de/datenbanken/shuttle-run-app/), specially developed for the SRT were used. The participants were asked not to perform strenuous or other prescribed exercise (eg, work-out in sports club) over their normal daily activities (walking, biking to work and so on) during the study. However, we did not record the normal daily activity of the participants by using for example step counter devices. Participants conducted two rounds of exercise test within the same season where the second round was considered as a repetition of the first round to increase the overall number of participants and the statistical significance of the findings.
Myotonometric measurements
The measurements were carried out about 1 hour after the exercises (to overcome potential exercise oedemas), in a quiet room under full body relaxation conditions and always following the same procedure for the four exercise sessions (T1, T2, T3, T4). Myotonometry was carried out at the body measurement points (MP) with a portable handheld device used for digital palpation that measures biomechanical parameter of muscles, the MyotonPro (https://www.myoton.com/, Myoton AS, Tallinn, Estonia). Measurements were carried out as indicated in previous studies50 and data was collected for four parameters: Elasticity (D, (log decrement)), Relaxation time (R, (ms)), Stiffness (S, [N m−1]), Tone (F, (Hz)). In the present work, we focused our analysis on oscillation frequency changes (ΔHz) representing muscle tone as key muscle property, but all parameters are provided in online supplemental table 7. After a gentle compression of the skin surface, the MyotonPro outputs five mechanical short pulses (precompression constant load 0.18 N and an impulse of 0.4 N, total force of 0.58 N), generated by the test probe at the end of the device (3 mm).79 The measurements were computed and stored by the default software of the device. For the measurements the MPs were identified for each participant by manual palpation and marked with a dermatologic marker pen. Myotonometric parameters were collected for six muscles (12 MPs from right and left body sides) as illustrated in figure 5A starting with the ventral MPs followed by the dorsal MPs.
Supplemental material
Computational analysis
The analysis was performed on the expression levels (two to the power of ΔCT) of BMAL1 and PER2. The peak time of the gene expression was identified as the time of the day of the maximum of the time series with eight data. The saliva data was separated into two groups with high mean BMAL1 expression (≥0.04) and low mean BMAL1 expression (<0.04) or early (9h and 13h) and late (17h or 21h) BMAL1 peak time. Measures of SDs were compared between the groups, and statistically significant lower values in one group compared with the other were tested using a one-tailed Wilcoxon-Mann-Whitney test, as implemented in matlab with ranksum() function. For exercise and Myoton data, the mean over the repetitions at each timepoint was considered; for the Myoton data the mean was taken over right and left muscles as well as different muscles within two muscle groups, hand muscles (M. adductor pollicis) and leg muscles (M. rectus femoris, M. biceps femoris, M. gastrocnemius). The exercise data and the Myoton data were normalised by the mean value over all data points, and three different uncorrected sample SDs were calculated for this data base: (i) The SD of all data points, including all timepoints and all repetitions. (ii) The SD between different timepoints, where the value for each timepoint results from a mean over the repetitions at this timepoint. (iii) The SD was calculated over the repetitions for each timepoint individually, and then the mean was taken over all timepoints. The latter two measures were meant to separate circadian variations in the data from experimental or physiological noise; the SD between timepoints (ii) is likely to be related to daily variations, while the SD of the repetitions (iii) rather quantifies measurement noise. For classification, we used the python package sklearn. The timing of the maximum for the mean exercise performance was labelled as early (9 hour or 12 hours) or late (15 hours or 18 hours). Advantageous for classification, the HST resulted in balanced classes with five participants each, while the other tests resulted in unbalanced classes with at least seven participants in the late class. For predicting early versus late HST performance with machine learning, the predictive power of different features of the saliva data was tested: the expression levels of BMAL1 and PER2 (averaged between the 2 days and normalised by the mean expression), the mean expression levels, the peak times (presented in a one-hot encoding) and the relative expression levels (PER2 divided by BMAL1). A linear support-vector-machine was fitted to predict early or late maximal exercise performance based on these features (sklearn.svm.LinearSVC()). Using leave-one-out cross-validation, classification performance was evaluated by computing the accuracy, that is, the number of correct predictions divided by the total number of predictions.
Supplemental material
Acknowledgments
We are grateful to all volunteers who participated in this study for their endurance during the exercise performance testing and the time dedicated to the study, to the trainers of the karate department of the BTSC and in particular to Christopher Krähnert and Peter Waitschies from the BTSC for logistic support. We thank Dr Tobias Stauber, Freie Universität Berlin and MSH Medical School Hamburg, Dr Frederick Damm Charité, Universitätsmedizin Berlin, members of their groups, and Dr Desiree Vaslaitis, STEMCELL Technologies for technical support, and Dr Henning Budde, MSH-Medical School Hamburg for critical reading. Some of the vector icons used in the graphical abstract and in figure 3, in this article were downloaded from Flaticon (https://www.flaticon.com/) and modified to better represent the message of the figure.
References
Supplementary materials
Supplementary Data
This web only file has been produced by the BMJ Publishing Group from an electronic file supplied by the author(s) and has not been edited for content.
Supplementary Data
This web only file has been produced by the BMJ Publishing Group from an electronic file supplied by the author(s) and has not been edited for content.
Footnotes
AB, MY and DH contributed equally.
Contributors AR contributed to conceptualisation; AB, DH, OA, YL, ZA contributed to methodology; AB, MY, JH contributed to formal analysis; AB, MY, DH, OA, YL, ZA, JH, JG, RE-A, MH, DB, AR contributed to investigation; AB, AR contributed to writing—original draft preparation; AB, MY, DH, OA, YL, ZA, JH, JG, RE, MH, DB, AR contributed to writing—review and editing; AB, MY, OA, JH, RE contributed to visualisation; AR, DB contributed to supervision; AR, DB contributed to funding acquisition. All authors have read and agreed to the published version of the manuscript.
Funding The work in the group of AR was funded by the German Federal Ministry of Education and Research (BMBF)—eBio-CIRSPLICE - FKZ031A316 and the Dr. Rolf M. Schwiete Stiftung. M.Y. was additionally funded by the Einstein Foundation. Y.L. was additionally funded by Jinan Huaiyin Hospital. M.Y., Y.L. and A.B. were additionally funded by the Berlin School of Integrative Oncology (BSIO) graduate program funded within the German Excellence Initiative, and the German Cancer Consortium (GCC). O.A. was additionally funded by the Inventors for Health (I4H) program of the Stiftung Charité. D.B., M.H. were supported by a grant from the Federal Department of Economy and Energy (BMWi) (Grant No. 50WB1718) through Deutsches Zentrum fuer Luft- und Raumfahrt (DLR e.V., Bonn-Oberkassel, Germany).
Competing interests None declared.
Patient consent for publication Not required.
Ethics approval The protocol and the scientific usage of human samples for experimental purposes was approved by the ethics commission of the Charité - Universitätsmedizin Berlin (EA2/188/18; EA4/040/20). All participants provided written informed consent to take part in the work and having their samples being used in scientific research. The participants were free to withdraw at any stage of the work.
Provenance and peer review Not commissioned; externally peer reviewed.
Data availability statement All data relevant to the study are included in the article or uploaded as supplementary information.