Article Text

Abstract
Background Ball velocity, accuracy and game statistics represent three methods used to measure pitching performance. However, individual determinants of pitching performance are more elusive.
Objectives The aims of this study were to classify the performance factors associated with baseball pitchers, to identify the methods used to quantify their abilities through all features of the game and to document relationships between performance factors and indicators.
Design Scoping review.
Data sources Electronic searches of MEDLINE, Academic Search Complete, CINAHL, SportDiscus, PubMed, PsycINFO, Cochrane and of grey literature were undertaken from inception to January 2019.
Eligibility criteria for selecting studies Cross-sectional studies that investigated the relationship between performance indicators and individual performance factors in healthy baseball pitchers were selected.
Results Thirty-four cross-sectional studies investigating individual potential factors of pitching performance met the inclusion criteria. The primary performance factors investigated were kinematic, kinetic, timing outcomes, personal characteristics, physical tests and range of motion. Shoulder horizontal adduction (SHA), upper torso forward flexion, maximal shoulder external rotation, upper torso rotation angle, upper torso lateral flexion, lead knee flexion (LKF) and forward trunk tilt (FTT) were identified as key kinematic features associated with increased ball velocity. Shoulder proximal force and peak elbow proximal forces were associated with greater ball velocity. Individual performances in jumping tests and body weight (BW) are also associated with pitching performance.
Summary/conclusion Based on studies presenting low and moderate risk of bias, we conclude that BW, age and kinematics, such as FTT, LKF, SHA and lateral trunk tilt, are associated with pitching performance.
- baseball
- performance
- biomechanics
- evidence-based review
This is an open access article distributed in accordance with the Creative Commons Attribution Non Commercial (CC BY-NC 4.0) license, which permits others to distribute, remix, adapt, build upon this work non-commercially, and license their derivative works on different terms, provided the original work is properly cited, appropriate credit is given, any changes made indicated, and the use is non-commercial. See: http://creativecommons.org/licenses/by-nc/4.0/.
Statistics from Altmetric.com
What is already known
Pitching velocity and accuracy are used as metrics to assess baseball pitchers’ performance.
Potential factors of pitchers’ performance are numerous and include anthropometrics, kinematics and timing parameters.
What are the new findings
Original studies investigating individual factors of baseball pitching performance are heterogenous.
Anthropometrics and kinematics are the most relevant factors associated with pitching performance
Introduction
Baseball is a popular sport worldwide. In the USA only, 15.64 million individuals participated in baseball in 2017.1 Strength and power are most certainly crucial physical qualities that characterise every elite baseball player and are considered central to the development of successful young baseball players.2 Three key basic skills need to be mastered for players to play at an elite level: running, batting and pitching. For the latter skill, ball velocity is considered an important performance parameter sought after by recruiters and coaches.3 The throwing motion, however, is a complex motor skill, which can be divided into six distinct phases: windup, early cocking phase, late cocking phase, acceleration, deceleration and follow through.4 To achieve high ball velocity, it is believed that the global throwing motion needs to be properly, if not perfectly, executed.5 Typical baseball throwing motion phases are presented in figure 1.
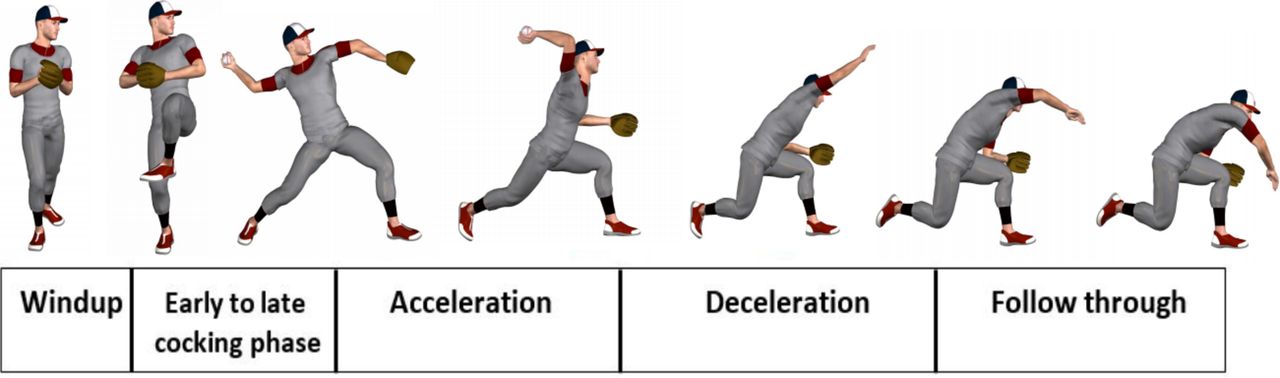
Baseball throwing motion phases.
Most published scientific studies have focused on ball velocity, because it is easier to assess than other pitching parameters. Ball accuracy, however, also seems to be an important factor when assessing pitching performances. According to Kawamura et al,6 a player showing high ball velocity but poor throwing accuracy will not have better outcomes than other pitchers. Kawamura et al used three different methods to assess pitching accuracy: pitch location accuracy, pitch location trajectory, and finally, the distance and the direction of the errors from the target position.6 The authors proposed that those methods are reasonable and sufficient to assess pitching accuracy.
Finally, the performance of the pitcher can also be easily evaluated using game statistics.7 For instance, Whiteside et al used the fielding independent pitching (FIP), an indicator focusing solely on the events a pitcher has the most control over,8 as an indicator of pitching performance for players from the Major League Baseball (MLB)9 and players from the National Collegiate Athletic Association.10 Specifically, they used statistics unique to pitchers: home runs (HRs) conceded, number of unintentional walks (BB), number of pitches that hit the batter (HBP), strikeouts (K) and number of innings pitched (IPs) to assess pitchers’ performances. The lower the value of the FIP, the better the pitching performance is. Alternatively, using a different approach to game statistics focusing on the number of IPs, strikeouts per inning (BBin), walks per inning, walks plus hits per inning pitched (WHIP) and batting average against (BAA), Chaudhari et al investigated the correlation between lumbopelvic control and individuals’ pitching statistics.11
Ball velocity, accuracy and game statistics represent three methods used in combination or separately to objectively measure pitching performance. To the best of our knowledge, no study has summarised nor systematically assessed the scientific evidence regarding factors associated with pitching performance. Given the various methodological approaches identified to assess pitching performances and the wide range of potential individual and technical indicators of pitching performance, it is believed that a better understanding of individual determinants of a pitcher’s performance could help coaches focus on specific aspects of training and improve athletes’ performances. Therefore, the aim of this study was to list and classify performance factors associated with baseball pitchers’ performance, to describe the methods used to assess pitching performance through all features of the game, and most importantly, identify individual factors associated with baseball pitching performance through a scoping review.
Methods
A scoping review was chosen as a way to address a broad sport-performance research question on a topic that has been investigated mostly through cross-sectional designs using multiple variables and research tools. This scoping review was conducted according to Levac et al framework and presents a five-step method review.12
Identifying the research question
This scoping review was conducted in order to answer the following research questions: What are the individual performance factors associated with baseball pitching performances, how are they measured, and what are the relationships between these factors and pitching performance?
Identifying relevant studies
The article search was conducted with the assistance of a university’s librarian from January 10 to January 14, 2019, in the following databases: MEDLINE, Academic Search Complete, CINAHL (Cumulative Index to Nursing and Allied Health Literature), SportDiscus, Pubmed, PsycINFO and Cochrane. The following terms (MESH or non-MESH) were used in combination when the databases search was implemented: (baseball) AND (performance OR pitch* OR throw*) AND (kinetic* OR kinematic* OR motion OR mechanic*). Additional data sources were searched in consultation with baseball experts and included searches in bibliography of book chapters and the reference list of articles to identify other relevant published peer-reviewed studies. An EndNote library V.X8 (Clarivate Analytics, Boston, Massachusetts, USA) was created to import all studies from the initial search results. The search strategy was not restricted by year of publication.
Studies selection and screening
Inclusion and exclusion criteria
To be included in the first step of the selection of articles, all studies had to be published in a peer-reviewed journal and written in either French or English. Only studies focusing on baseball pitching were included. All other sports or baseball position and technical skills were excluded. Studies involving injured players or player presenting pain were also excluded. After a preliminary keyword search and consultation with field experts, the following variables were chosen as performance indicators: ball velocity, accuracy, game statistics and spin rate and axis. To be included, studies needed to report on at least one of these performance indicators.
The following study designs and types of publication were excluded from the review: opinion and commentary papers, letters, editor’s responses, conference abstracts, randomised controlled trial, cases and case series studies.
Study screening
The article search was completed by one of the authors (M.A.M.), whereas record screening by title and abstract was performed by two independent reviewers (M.A.M. and C.D.). Three categories were used to classify the studies; consisted of either relevant, irrelevant or possibly relevant studies. Studies were gathered in an Excel spreadsheet. Whenever a disagreement happened between the two reviewers, further review was conducted by both assessors to decide whether a study should be included or not, and a third reviewer (M.D.) was involved if the initial assessors could not agree. Full texts from the studies judged relevant and possibly relevant were screened by two authors (M.A.M., M.D.) to determine the final set of eligible studies for this scoping review according to the relevant population, comparisons and outcomes before the beginning of data extraction.
Charting the data
To extract relevant data and information from the eligible studies, a data extraction online supplementary table was created; it included the following information: author and year of publication, study objectives, study design, performance indicators (ball velocity, accuracy, game statistics or spin rate and axis), factors associated with performance, population, and results. The extraction of all information was conducted by one reviewer (M.AM) and double-checked by a second one (M.D.).
Supplemental material
Collating, summarising and reporting the results
The risk of bias assessment was conducted using the methodology recommended by Guyatt et al for observational studies13 by two authors (M.A.M. and M.T.). All the selected studies were screened for potential sources of bias. The following potential biases were analysed: selection bias (inappropriate sampling), performance bias (flawed measurement of exposure), detection bias (flawed measurement of outcomes), attrition bias (incomplete follow-up, high loss to follow-up), selective reporting bias (selective/incomplete outcome reporting), and “other” sources of bias. Concerning the attrition bias, because most of the studies selected were cross-sectional studies, the studies that did not mention the number of participants in the result section were considered having no attrition and were therefore rated as having a low risk of attrition bias. For our study, an item that was classified as low risk of bias received a score of 0, high risk of bias received a score of 2 and unclear risk of bias received a score of 1. Studies were subsequently categorised as low (score: between 0 and 3), moderate (score: between 4 and 7) and high (score: between 8 and 12) risk of bias.
Results
A total of 4817 articles were identified in the literature, and 34 fulfilled the selection criteria (figure 2). Other sources (field experts, articles bibliography, etc.) were searched to potentially include additional references to the scoping review, but none were found. All selected studies were cross-sectional conducted with various types of design and settings. No cohort or case-control studies were identified through our search process. The selected studies originated from the United States of America (USA), Australia, Japan, Netherlands, Canada and Taiwan. Among these studies, three were international collaborations between research institutions (Canada/Australia, USA/Australia and Japan/USA). The studied populations varied across studies as four studies concerned young baseball players, nineteen high school pitchers, fifteen college pitchers, eleven MLB pitchers and three were conducted in other groups of baseball players. Of the 34 studies, nine compared two groups of different ages and three compared three groups of different ages. The populations studied are shown in figure 3.

Systematic review flow diagram. The Preferred Reporting Items for Systematic Reviews and Meta-Analyses flow diagram for the systematic review detailing the database searches, the number of abstracts screened and the full texts retrieved.

Population’s distribution. MLB, Major League Baseball.
Performance indicators
Regarding performance indicators, 30 articles studied ball velocity and three articles studied throwing accuracy. Among all studies, two were interested in both ball velocity and throwing accuracy. Two articles reported FIP as the performance indicator, and one study investigated the ball spin axis direction. No study investigated the association between performance and the ball spin rate.
Risk of bias assessment
Twenty-seven articles were classified as having a moderate risk of bias, four articles were classified as having a low risk of bias and three others were classified as having a high risk of bias. The risk of selection bias was rated high for all studies since the authors either did not have clear inclusion criteria or did not use an appropriate sampling technique. Only one study presented an unclear risk of bias for the detection bias because the authors did not describe how ball velocity was measured. The complete risk of bias analysis is presented in table 1, and ratings of each item for all studies are shown in figure 4.
Risk of bias assessment

Risk of bias assessment of individual studies.
Individual factors associated with pitching performance
Kinematics
At foot contact
Eleven variables were studied during foot contact phase. Escamilla et al14 compared kinematics between American and Korean pitchers and found that American pitchers had a significantly higher ball velocity. In the throwing motion, American pitchers presented a significantly greater shoulder horizontal adduction (SHA) and shoulder abduction compared with Korean pitchers, which could explain the greater ball velocity observed in American pitchers. Regarding shoulder external rotation (SER), the authors found that American pitchers displayed less SER than the Korean pitcher. Stodden et al15 found a significant correlation between SHA and ball velocity but not with shoulder abduction, whereas Oyama et al16 investigated the differences in kinematics among pitchers with or without excessive contralateral trunk tilt and found that pitchers with excessive contralateral trunk tilt showed less upper torso flexion at foot contact and had higher ball velocity . Among five studies reporting on lower limb kinematics,14 15 17–19 Werner et al were the only one reporting an association between a greater knee flexion or elbow flexion and increased ball velocity. In all five studies that investigated stride length,14 17 18 20 21 Sgroi et al were the only one to find that stride length was associated with ball velocity. Solomito et al22 showed that a more tilted trunk in forward flexion at ball release is associated with greater ball velocity. Based on one low risk14 and three moderate risk15 16 22 of bias studies, increased SHA seems to be associated with increased ball velocity, as well as the upper torso forward flexion. We cannot conclude on any other parameter because of results heterogeneity across studies.
Arm-cocking phase
Five parameters were studied during the arm-cocking phase. Escamilla et al14 observed a greater SER and a greater maximum pelvis angular velocity in Americans during the arm-cocking phase compared with the Koreans. Chen et al,17 who compared high-velocity and low-velocity players, found a greater SER and a greater maximum upper torso angular velocity in players throwing faster. Based on one low14 and one moderate17 risk of bias studies, it seems that increased maximal SER is associated with increased ball velocity. We cannot conclude that other parameters are associated with ball velocity because of results heterogeneity presented in other individual studies.
Maximal SER
Nine variables were studied during maximal SER. Oyama et al16 investigated the effects of excessive contralateral trunk tilt on ball velocity. The authors found that upper torso rotation angle and upper torso lateral flexion angle were positively associated with ball velocity. Stodden et al23 also observed a positive association between upper torso rotation angle and ball velocity, as well as pelvis orientation and ball velocity. van Trigt et al18 observed that increased knee flexion of the lead leg at SER was negatively associated with ball velocity. Finally, Solomito et al24 found that higher contralateral trunk lean also caused greater ball velocity. Based on three moderate16 23 24 risk of bias studies, it seems that an increased upper torso rotation angle and upper torso lateral flexion are associated with increased ball velocity during SER. There is not enough available evidence to conclude on other parameters.
Acceleration phase
Eight parameters were investigated during the acceleration phase. Stodden et al15 observed that shoulder abduction decreased as ball velocity increased. On the other hand, Escamilla et al14 found no difference between American and Korean pitchers. Chen et al,17 who compared differences between pitchers throwing fast and pitchers throwing slower, found that higher maximal SHA was present in the high-velocity group. Based on one moderate15 and one low14 risk of bias studies, there is conflicting evidence regarding the association of shoulder abduction with ball velocity. With the limited available evidence, we cannot comment on the association of these variables. There is not enough evidence to conclude on other kinematics parameters.
Ball release
Ten parameters were observed at ball release. Escamilla et al14 found that the lead knee was more extended in American pitchers compared with Korean pitchers, and that Americans displayed a greater forward trunk tilt (FTT). Stodden et al15 found that FTT was positively correlated with ball velocity. Oyama et al16 found that pitchers with excessive contralateral trunk tilt had less upper torso rotation and greater upper torso contralateral flexion compared with the ones who do not have excessive contralateral trunk tilt. Werner et al19 found that a more extended knee and a greater FTT was positively correlated with ball velocity. Chen et al17 found that a wider SHA was existent in players throwing fast compared with players throwing slowly. Stodden et al23 also found an association between pelvis orientation and ball velocity during ball release. Matsuo et al25 investigated kinematic differences between high-velocity groups and low-velocity groups. They found that high-velocity groups displayed greater FTT compared with low-velocity groups. They also found less maximal lead knee flexion (LKF) and greater lead knee extension angular velocities in high-velocity groups. van Trigt et al18 also found that a more extended knee was positively correlated with ball velocity. Based on low,14 moderate15 16 20 23 25 and high18 risk of bias studies, a lower LKF and a greater FTT may be associated with greater ball velocity. Because of the conflicting and heterogenous nature of the results, we cannot conclude that other ball release parameters are associated with ball velocity.
Kinetics
Arm-cocking phase
Eight arm-cocking phase kinetic parameters were investigated. Escamilla et al14 studied maximal shoulder internal rotation (SIR) torque and maximal elbow varus torque and found that this value was higher in American pitchers compared with Korean pitchers. Stodden et al15 observed a positive correlation between ball velocity and elbow flexion torque, as well as shoulder proximal force and ball velocity. Oyama et al16 also found a positive correlation between shoulder proximal force and ball velocity. Based on moderate15 16 risk of bias studies, it seems that increased shoulder proximal force is associated with increased ball velocity.
Arm acceleration phase
Six parameters were studied during the arm acceleration phase. Escamilla et al14 studied maximal elbow flexion torque and found that this value was higher in American pitchers compared with Korean pitchers. Two other studies15 16 investigated peak elbow proximal force and found it to be correlated with ball velocity, while one study26 reported on shoulder distraction force and found a positive correlation with ball velocity. Based on moderate15 16 risk of bias studies, overall evidence suggest that increased peak elbow proximal force is positively associated with ball velocity.
Arm deceleration phase
Eight parameters were studied during the arm deceleration phase. Escamilla et al14 found that both maximal shoulder proximal force and maximal elbow proximal force were greater in American pitchers compared with Korean pitchers. Peak SIR moment was investigated by Oyama et al,16 who found it to be higher in pitchers with excessive contralateral trunk tilt. Preliminary evidence based on one low14 risk of bias study suggests that increased maximal shoulder proximal forces or maximal elbow proximal forces are associated with higher ball velocity.
Timing outcomes
Eighteen timing outcome variables were identified. Stodden et al15 found that as ball velocity increased, time to maximum SIR rotation velocity decreased and time to maximal horizontal adduction increased. Werner et al19 analysed time from stride foot contact (SFC) to maximal external rotation (SER) and found that a shorter interval between these phases was associated with increased ball velocity. They also found that an increased maximal elbow flexion angular velocity increased ball velocity, as well as maximal upper torso angular velocity. Matsuo et al25 found that SIR occurred earlier in the players throwing faster, and that maximum elbow extension angular velocity occurred earlier in those same players. Urbin et al27 found that an increase in time from SFC to maximal pelvis angular velocity was associated with a decreased ball velocity. Based on these moderate15 19 25 27 risk of bias studies, it seems that increased maximal SIR angular velocity is associated with increased ball velocity. There is not enough available evidence to conclude on other parameters.
Physical tests and individual characteristics
Three studies3 28 29 investigated the relation between some physical tests and ball velocity. Bullock et al28 used the Upper Quarter Y-Balance Test to make a correlation with ball velocity but found no association. On the other hand, Lehman et al3 used lower-body field tests. Of the 10 tests used, only 2 showed a significant positive correlation with ball velocity: lateral to medial jump and medicine ball scoop. Nakata et al29 used seven tests to investigate possible correlations with ball velocity: standing long jump, side steps, sit-ups, 10 m sprint, trunk flexion, back strength and grip strengths of both hands. Participants were divided in three groups (young, middle and old). Tests that were associated with ball velocity were standing long jump, 10 m sprint and grip strength. Based on low28 and moderate3 29 risk of bias studies, jump tests seem to be consistently associated with ball velocity. Seven studies3 14 19 21 29–31 investigated the association between individual characteristics and ball velocity. Four of these studies3 14 19 31 found body weight (BW) to be a factor associated with ball velocity. One study21 showed that height was a factor associated with ball velocity. In the same way, one study29 reported body mass index to be a factor associated with ball velocity. Finally, age was found to be a factor in two studies.21 29 Matsuo et al25 investigated individual characteristic differences between pitchers throwing fast and pitchers throwing slower. Body height, humerus and radius length were significantly different between groups. Based on those moderate3 19 21 25 29–31 and low14 risk of bias studies, it seems that BW and age are positively correlated with ball velocity.
Range of motion
All range of motion (ROM) studies investigated active or passive ROM in a controlled laboratory setting (not during the pitching motion). Three studies observed shoulder ROM21 30 32; one study investigated trunk ROM (trunk rotation)28; and one study hip ROM.33 One study30 failed to identify any association between shoulder ROM and ball velocity.21 Another study observed the relation between ball velocity and maximal external rotation (SER) of the shoulder.32 A greater shoulder SER at the beginning of the acceleration phase was associated with greater ball velocity. The study, however, was classified as having a high risk of bias. A study19 of moderate risk of bias also found that a greater SER was associated with ball velocity. However, no association was found between ball velocity and trunk rotation.28 The only study that investigated hip ROM found that the total arc of rotation of the leading hip was significantly correlated with ball velocity.33 Based on conflicting low28 and moderate21 30 33 risk of bias studies, there is not enough available evidence to make a conclusion about ROM.
Other individual parameters
One moderate risk of bias study examined the relation between accuracy and pitchers’ level of play6 and found that professional pitchers were more precise than high school pitchers. One moderate risk of bias study investigated shoulder joint movement (SJM) of the contralateral pitching arm34 and found a negative association between SJM and ball velocity. Another moderate risk of bias study examined the association between ball velocity and energy flow (EF) and found a significant positive association for each body segments from the pelvis to the hand.35
Two studies investigated the association between ground reaction forces (GRFs) and ball velocity.36 37 The first study found that lower GRFs were present in slower pitchers compared with faster pitchers during the transition from the arm-cocking phase to front foot landing, whereas the second study showed that ball velocity was significantly, but weakly correlated with peak resultant force and with vertical and resultant forces at the time of peak anterior force. Those results are based on one high36 and one moderate37 risk of bias studies. Moreover, Wang et al32 found that a shorter acceleration phase time was correlated with higher ball velocity. The study, however, was classified as having a high risk of bias.
Jinji et al, in a low risk of bias study,38 investigated which factors influence the direction of the spin axis of a fastball and showed that the spin axis directions are significantly correlated with the orientations of the hand just before ball release. Preliminary evidence based on one low38 risk of bias study shows that direction of the spin axis is correlated with ball velocity.
Finally, one moderate risk of bias study investigated the correlation between FIP and ball flight kinematics9 and showed that release location variability, pitch speed, variation in pitch speed and horizontal release were associated with FIP. A moderate risk of bias study39 investigated the effect of several variables, including ball release point distance, stride length, lateral pelvic tilt and ball velocity on peak elbow varus torque and ball velocity. Results showed a significant association between ball velocity and peak elbow varus torque during fastballs. Finally, among all the parameters studied by Sgroi et al21 (moderate risk of bias study), greater separation of hips and shoulders was positively correlated with ball velocity.
Table 2 presents a synthesis of the different pitching parameters that are significantly associated with pitching performance.
Factors significantly associated with pitching performance
Discussion
In this scoping review, individual performance factors associated with baseball pitching performance were identified and classified in order to identify the research methods and tools used by researchers to study factors associated with baseball pitching performance. The majority of studies focused on high school players (36%), while younger players (8%) were the least studied population. Out of the thirty-four articles, ball velocity was the most studied performance indicator (thirty studies). Most studies were classified as having a moderate risk of bias, with the selection item being rated high risk for all studies.
Kinematics
Kinematics was the most studied performance factor associated with pitching performance (10 studies). SHA, upper torso forward flexion, maximal SER, upper torso rotation angle, upper torso lateral flexion, LKF and FTT were the main kinematic features associated with higher ball velocity. Trunk rotation and SHA in the arm-cocking phase help to produce SER.40 41 In fact, a moderate19 and a high32 risk of bias studies found that greater SER is associated with increase of ball velocity. There may also be a relationship between LKF and FTT. At foot contact, reduced flexion at the knee allows the leg to extend to its maximal capacity while the trunk bends forward when the ball is released.14 Moreover, a greater torso lateral flexion angle could allow the pitcher to increase the extension of his pitching arm during the ball release phase. Feltner et al42 suggested that a more abducted shoulder and SER in the late arm-cocking phase with increased LTT would result in a greater acceleration of the pitcher’s throwing shoulder.
Kinetics
Only shoulder and elbow proximal forces were found to be positively associated with ball velocity. In an interventional study43 investigating the effect of a 6 week weighted baseball throwing programme, pitchers in the intervention group had an increase in passive SER, as well as an increase in ball velocity. The authors suggest that greater shoulder ROM may be responsible for the increase in ball velocity. In the intervention group, however, there was a 24% increase in injuries, which could be explained by higher forces sustained by articulations. These articulations are at risk of being overloaded and it could increase injury risk.14 Another study44 found that elbow valgus torque increased as SER increased. Therefore, it seems that kinetic parameters are useful factors associated with ball velocity, but parameters such as shoulder and elbow proximal forces have also been suggested as risk factors of overuse arm injuries.14
Physical tests and individual characteristics
Greater performance on five different tests was found to be associated with greater ball velocity: lateral to medial jump, medicine ball scoop, standing long jump, 10 m sprint and grip strength. 10 m sprint was an indicator in all age groups in Nakata et al study.29 Lehman et al3 found that explosive athletic tests are correlated with ball velocity, more specifically, lateral to medial jump. According to these authors, this test reproduces the stride action of the pitching motion and shows that power is an important factor when it comes to the act of pitching. As pitchers get older, the number of physical tests that correlate with ball velocity decreases. According to Malina et al,45 boys who are sexually and skeletally more mature regardless of their chronological age show better strength, power and speed compared with boys who are later in sexual and skeletal maturity, in the same chronological age group. When it comes to adulthood, technical ability becomes more important than physical abilities and is often the overriding factor of performance.46
Others
Among all the other variables investigated, GRF was one of the most relevant and useful parameters. Positioning of the foot on the mound could influence weight dispersion and summation of foot moments against the mound by the dominant leg during the stride push. The activation of the gluteus maximus could be optimised by a better understanding of the GRF. From pelvis to the hand, EF35 seems to be correlated with ball velocity. GRF from the foot to the hip could influence EF during the pitching motion by the initiation of the kinetic chain. Both variables could encourage and increase ball velocity. There is currently an increasing interest in spin axis related parameter in the baseball world. When looking at MLB statistics,7 we can observe that higher velocities are associated with high spin rate and on-field results, which tend to be in favour of the pitcher rather than the batter. An effective spin rate can change the perception of a pitch by the batter and can be more effective. The palm facing home plate during ball release has been shown to create the necessary lift force to increase fastball velocity. Finger position and pressure on the ball for different pitch types can also influence spin axis and eventually spin rate. Although both parameters are believed to influence pitchers (and sometimes batter’s) performance this hypothesis remains to be investigated more thoroughly.
This is the first scoping review to investigate the factors associated with pitching performance; therefore, comparisons with previous studies are limited. However, a study used a meta-analytic approach47 to compare kinematics in youth versus adult pitchers. Four elbow and shoulder kinematic parameters were found to be significantly different between groups in this study while no kinetics parameters were included. This meta-analysis concluded that at ball release and SER, there was a significant elbow angle increase in the youth group versus the adult group. Shoulder abduction angle was found to be significantly different between the two groups at foot contact where the adults were slightly adducted, and the youths were abducted. SER amplitude was different between the two groups and was significantly different at foot contact and SER. Shoulder horizontal abduction was also significantly different between the youths and the adults at foot contact and SER. According to Jensen,48 children sustain anatomical changes during growth period which redistribute mass segments and moments and could potentially affect performance. Further studies should investigate both parameters in order to tease out the contribution of both maturation and expertise in the evolution of pitching performance in younger athletes. Factors associated with pitching performance and potential predictors should also be investigated throughout growth and maturation.
Limitations
This scoping review is not without limitations. The first limitation that should be considered is that only studies published in the English and French (although no French publication was identified) were included in this review. Nonetheless, several data sources and the grey literature were searched to search articles and relevant information to be included in this study. Another limitation concerns original studies that have used heterogeneous measurements of pitching velocity to objectively measure pitch velocity, one of the main outcomes for pitching performance identified in this scoping review. Such heterogeneity weakens the overall quality of evidence and may limit the generalisability of the results.
Conclusion
This is the first scoping review investigating the factors related to pitching performance. Pitch velocity was the most studied performance indicator. Many studies observing kinematics and kinetics in players of various ages and levels were identified. Individual characteristics were also investigated. Based on studies presenting low and moderate risk of bias, we conclude that BW, age and kinematics parameters such as FTT, LKF, SHA and lateral trunk tilt are associated with pitching performance and more precisely, ball velocity.
Acknowledgments
We thank Alexandre Janelle-Gagnon for his input and his ideas during the early stage of the study.
References
Footnotes
Contributors MD and CD designed the search strategy, whereas the selection process was carried out by M-AM and MT. M-AM, MT and CD wrote the manuscript. MD directed the project and reviewed all stages of the study, including writing the manuscript.
Funding The authors have not declared a specific grant for this research from any funding agency in the public, commercial or not-for-profit sectors.
Competing interests None declared.
Patient consent for publication Not required.
Provenance and peer review Not commissioned; externally peer reviewed.
Data availability statement All data relevant to the study are included in the article.