Article Text

Abstract
Objective Available ECG criteria for detection of left ventricular (LV) hypertrophy have been reported to have limited diagnostic capability. Our goal was to describe how the distance between the chest wall and the left ventricle determined by echocardiography affected the relationship between ECG voltage and LV mass (LVM) in athletes.
Methods We retrospectively evaluated digitised ECG data from college athletes undergoing routine echocardiography as part of their preparticipation evaluation. Along with LV mass and volume, we determined the chest wall–LV distance in the parasternal short-axis and long-axis views from two-dimensional transthoracic echocardiographic images and explored the relation with ECG QRS voltages in all leads, as well as summed voltages as included in six major ECG-LVH criteria.
Results 239 athletes (43 women) were included (age 19±1 years). In men, greater LV–chest wall distance was associated with higher R-wave amplitudes in leads aVL and I (R=0.20 and R=0.25, both p<0.01), while in women greater distance was associated with higher R-amplitudes in V5 and V6 (R=0.42 and R=0.34, both p<0.01). In women, the chest wall–LV distance was the only variable independently (and positively) associated with R V5 voltage, while LVM, height and weight contributed to the relationship in men.
Conclusions The chest wall–LV distance was weakly associated with ECG voltage in athletes. Inconsistent associations in men and women imply different intrathoracic factors affecting impedance and conductance between sexes. This may help explain the poor relationship between QRS voltage and LVM in athletes.
- electrocardiography
- pre-participation evaluation
- athlete’s heart
- left ventricular hypertrophy
This is an open access article distributed in accordance with the Creative Commons Attribution Non Commercial (CC BY-NC 4.0) license, which permits others to distribute, remix, adapt, build upon this work non-commercially, and license their derivative works on different terms, provided the original work is properly cited, appropriate credit is given, any changes made indicated, and the use is non-commercial. See: http://creativecommons.org/licenses/by-nc/4.0/.
Statistics from Altmetric.com
What are the new findings?
In athletes, the distance between the chest wall and the left ventricle is weakly correlated to ECG voltage.
This relationship was opposite in women and men, implying different intrathoracic factors between sexes.
Overall, our findings may explain part of the poor relationship between ECG voltage and left ventricular mass in athletes.
Introduction
There are numerous electrocardiographic criteria for left ventricular hypertrophy (ECG-LVH)1; however, they are limited by poor diagnostic accuracy.2 3 This may be particularly true in athletes, as our group recently observed that none of the 37 ECG criteria were able to identify athletes with increased left ventricular mass (LVM).4 Several factors including sex, age, ethnicity and body habitus have been suggested to influence ECG voltage, and thus limiting the ability of common ECG-LVH criteria to correctly classify individuals having abnormally high LVM.1
One factor that theoretically should affect the relationship of left ventricular (LV) voltage with LVM is the distance from the heart to the chest surface. A few studies have previously found an improved correlation between LVM and ECG voltage when considering the chest wall–LV (CWLV) distance measured by M-mode echocardiography in children.5–7 The feasibility of this measure by two-dimensional echocardiography and its impact on the LVM–ECG voltage relationship has not been explored in athletes.
We aimed to evaluate if the CWLV distance could be measured reliably on echocardiographic images obtained during routine preparticipation in athletes, and to explore the association between CWLV distance and ECG-QRS voltage in this group where physiological increases in LVM are prevalent.
Methods
Subjects
We included college athletes with a digitised resting ECG undergoing routine echocardiographic examination as part of their preparticipation cardiovascular screening at Stanford University between 2010 and 2016. We excluded subjects with abnormal ECG findings as per current athletic ECG guidelines,8 possible electrode misplacement on retrospective ECG evaluation or poor echocardiographic image quality.
Electrocardiography
Standard 12-lead ECGs were acquired by experienced medical personnel within the Stanford Sports Cardiology programme and were read by an experienced sports cardiologist (VF). The ECG tracings were recorded at 25 mm/s and obtained with the athlete in supine position during quiet respiration after a short period of rest. Digitised ECG data were collected and saved to a database using the Cardea 20/20 Resting ECG Analysis System (Cardiac Insight, Bellevue, Washington, USA), including time intervals with a precision of 1 ms, P-QRS-T amplitudes with a precision of 1 μV (1/1000 mV), and time-voltage area of the P-wave, QRS complex and ST-T complex. In each of leads aVR, aVL and V1-V2 we used the numericallylargest of any negative (S, s’ or Q) or positive (R or r’) deflection to definethe greatest absolute voltage. In all other leads, only positivedeflections were used in the definition.
We calculated the following voltage sums, according to six established ECG criteria (with their respective threshold for suspected LVH in parentheses): S V1 + R V5/V6 (>35 mm),8 maximum of R + S voltage in any precordial lead (>35 mm),9 R aVL + S V3 (>28 mm/>20 mm; men/women),10 maximum of S voltage in any lead + S V4 (≥28 mm/≥23 mm; men/women),11 sum of either Q, R or S wave (whichever is the largest) in all leads (≥179 mm),2 12 and the product of QRS duration and the sum of either Q, R or S wave (whichever is the largest) in all leads (≥17 472 mm × ms).2 13
Echocardiography
All subjects underwent routine echocardiographic examination within 30 days of the ECG recording (78% was performed the same day). Echocardiography was performed with subjects in lateral decubitus position using a commercially available system (iE33; Philips Medical Imaging, Andover, Massachusetts, USA) with images analysed on Xcelera workstations. No additional views or images were recorded for the purpose of determining the CWLV distance, and all measurements were done offline on standard projections. The echocardiographic protocol included two-dimeensional (2D) and colour Doppler in parasternal and apical views. LV mass and volume were calculated using the area-length method in end-diastole from short-axis images, and LV length was measured in the apical four-chamber view. LVM was indexed by body surface area (BSA; LVM (BSA)), calculated by the Du Bois formula.14
The CWLV distance was measured by two investigators at end-diastole from 2D images in the parasternal long-axis (CWLVPLAX) and short-axis (CWLVPSAX) views, as detailed in figure 1. For analysis, the mean value of CWLVPLAX and CWLVPSAX from both investigators was calculated as CWLVMEAN.

Methods used to determine the chest wall–left ventricular distance. In the parasternal long-axis view (A), the distance to the mid-left ventricle (LV, yellow) was measured to the midpoint of a line (blue) drawn perpendicular to the LV longitudinal long axis at the tip of the mitral leaflets in end-diastole. In the parasternal short-axis view (B), first the distance to the mid of the LV inferior, far wall (blue), was measured on a line drawn through the mid-LV followed by measurement of the distance to the mid of the septal wall (red) aligned with the first line. By finally adding the distance to the septum (red) to half the LV diameter (blue line minus red line), the distance to the mid-LV (yellow) was calculated.
Statistical analyses
SPSS V.25.0 software was used for database management and statistical analysis. R Studio V.1.1.456 (R Studio, Vienna, Austria) was used to calculate the numeric sums of each combined criterion and to determine which criteria each athlete fulfilled. Continuous data were expressed as mean±SD, and categorical data as number of observations and frequency. We evaluated differences between groups with Student’s t-test for continuous variables and χ² test for categorical variables. Two-sided p values <0.05 were considered statistically significant. The physiological association between voltage, anthropometrics, and LVM and LV volume was explored using bivariate correlation analysis, where negative deflections (Q and S waves) were transferred to their absolute (positive) values. Inter-rater agreement between the two independent observers was calculated as two-way mixed model intraclass correlation coefficients (ICC, average measure, absolute agreement type).
Patient and public involvement
Patients and/or the public were not involved in the design, or conduct, or reporting, or dissemination plans of this research. Athletes were not invited to comment on the study design, interpret the results, or contribute to the writing or editing of this document.
Results
Subjects
The characteristics of the 239 athletes included are outlined in table 1. The cohort included 147 (62%) male American-style football players, 43 (18%) volleyball players (15 female), 40 (17%) basketball players (24 female), 3 (1%) cross-country runners (1 female), and 1 from each of rowing (male), golf (male), swimming (female), water polo (female), tennis (male) and baseball (female). Eleven (6%) male athletes and no female athlete presented with echocardiographic LVH (LVM/BSA >102 g/m² in men; >88 g/m² in women).
Subject characteristics
Reproducibility and feasibility
Both CWLVPLAX and CWLVPSAX were possible to measure in all subjects. There was a very high level of agreement between the two independent observers (CWLVPLAX: R²=0.95, p<0.001, ICC=0.98, 95% CI 0.97 to 0.98; CWLVPSAX: R²=0.97, p<0.001, ICC=0.99, 95% CI 0.99 to 1.00).
Determinants of CWLV
CWLVMEAN was 1.2 cm greater in men than in women (8.9±1.0 vs 7.7±0.7 cm, p<0.001). In bivariate analysis, weight was the anthropometric variable most strongly associated with CWLVMEAN (r=0.81, p<0.001), while the association to height was moderate (r=0.35, p<0.001). The linear models are presented in online supplementary figure 1. In a stepwise multivariable linear model, sex was not significantly associated with CWLVMEAN after accounting for body weight (p=0.07). In contrast, after accounting for weight, Afro-American ethnicity was negatively associated with CWLVMEAN (beta=−0.11, p=0.005).
Supplemental material
Associations between ECG voltage and CWLV
The correlations between single-lead ECG voltage and CWLVMEAN are presented in table 2, where a negative correlation implies a decrease in the respective lead voltage with increasing distance between the heart and chest wall. In men, CWLVMEAN was related to ECG voltage in all leads except aVR, V4, V5 and V6. Interestingly, the strongest correlations overall were seen in women, in leads V5–V6. These were the only statistically significant correlations in women, although the sample size was a quarter of that in men. The bivariate correlations with voltage sums used in common ECG criteria are presented in online supplementary table 2.
Bivariate correlation between absolute maximal voltage of either the Q, R or S wave in each lead and the chest wall–left ventricular distance
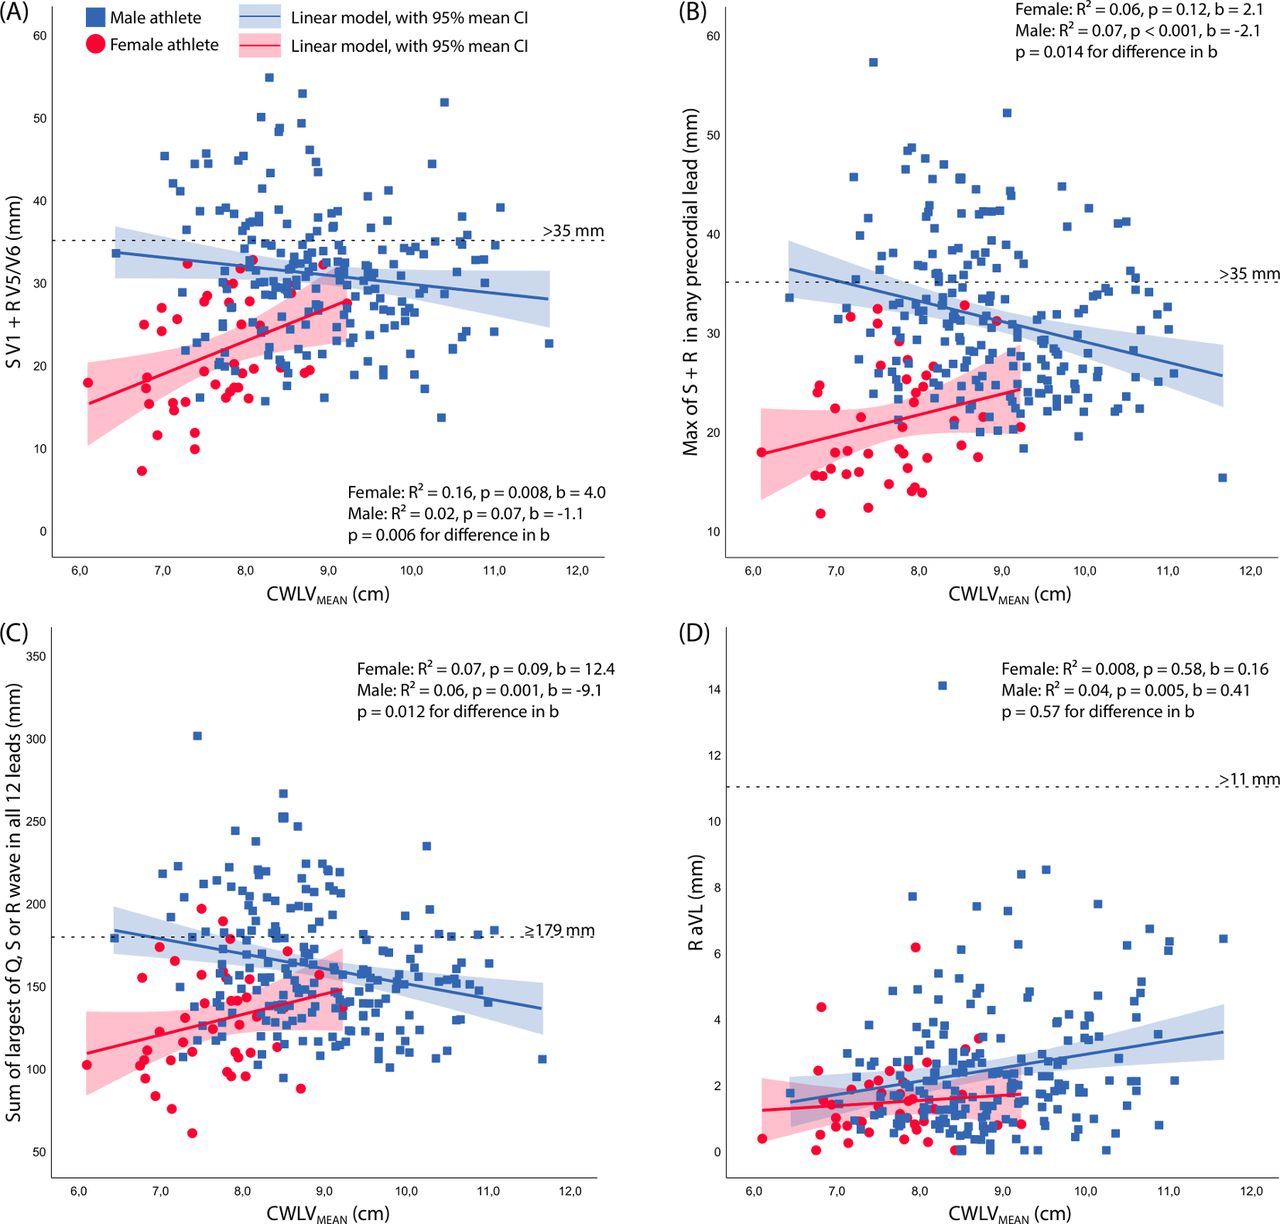
The unadjusted relationship between ECG voltage and CWLV distance was opposite in female and male athletes, as ECG voltage increased with greater CWLV distance in women (figure 2).
Relation between chest wall–left ventricular (CWLV) distance and ECG voltage summed as per three different ECG criteria and in aVL. There was a trend to higher ECG voltage with increasing distance to the mid-LV in women, while the trend was opposite in men. (A) Voltage sums as in current ECG criterion for ECG interpretation in athletes.8 (B) Voltage sums as in Grant.9 (C) Voltage sums as in Molloy et al13/Ha et al.2 (D) R-wave voltage in aVL as part of the Sokolow-Lyon criteria. Except for (D), the slopes of the linear curve were different in men and women (p<0.05).
However, in multivariable regression analysis including anthropometric variables as well as LV mass and volume, there was a positive association between CWLVMEAN and R-wave voltage in V5 in both men and women (table 3), with CWLVMEAN being the only independent predictor of R voltage in women. Including body mass index (BMI) in the equation instead of height and weight had little impact on the standardised coefficients and level of significance.
Multivariable determinants of ECG voltage in left-sided leads
Discussion
Many athletes undergo ECG examination during their career, as this is part of the recommendations on preparticipation evaluation put forth by most of the major sports organisations. We, and others, have shown a poor correlation between LVM and surface ECG voltage. This has been explained in part by interindividual factors such as sex, thorax size, how deep in the chest the heart is located and amount of epicardial fat. The current study confirmed the poor correlation between LVM and ECG voltage, and we have shown that the CWLV distance overall was a poor determinant of ECG voltage.
Previous studies
A handful of studies, in non-athletic populations, have explored the relation between surface ECG voltage and the impact of the CWLV distance.5–7 15 In an early study by Horton et al,5 100 subjects (54% male) aged 3–79 years were included, of whom only 25 were free from cardiovascular disease. The authors found a strong positive correlation (r=0.81) between LVM and the product of CWLVPLAX measured by M-mode echocardiography and precordial lead voltage (sum of SV1+RV5 or V6). In the following years, a Japanese paediatric centre published two studies in subjects <18 years of age, where they found the square of CWLVPLAX multiplied by the sum of SV1+RV5 or V6 to be positively associated with LVM in boys (r=0.712) and in girls (r=0.469).6 7 More recently, Machado et al15 examined 220 adults (43% male) aged 20–85 years of whom 175 were free from cardiovascular disease. They found that CWLVPLAX was an independent predictor of LVM in a model including ECG voltage and anthropometric variables, although most of the variability could be explained by BMI. In addition, Feldman and colleagues,16 explored the impact of LV size and intrathoracic heart position on R-wave amplitude in limb and precordial leads by changing body position as well as applying the Valsalva manoeuvre.16 Their results imply a direct and relatively large effect of both acute increases in LV dimensions and LV position on ECG amplitudes.
The current results add to these previous studies by showing a weak but statistically significant association between CWLV distance and ECG voltage in an athletic cohort. Overall, CWLVMEAN was an independent predictor of R-wave amplitude in several leads, although the overall R² values were low and the clinical significance is probably limited. The weaker correlations seen in the current study as compared with the earliest studies may be explained by either differences in the echocardiographic methodology (two-dimensional vs M-mode echocardiography), subjects included with regard to age and prevalence of cardiovascular disease, or both.
Effect of gender
Collectively in non-athletic cohorts, ECG voltage in specific leads has been reported lower in women.17 This sex-related difference has been reported from puberty,6 suggesting a sex steroid effect on LVM and/or chest wall size and conductance properties. In our study, the relation between LVM and ECG voltage was generally weaker in women than in men, while the CWLV distance was a stronger determinant of ECG voltage in women than in men. Interestingly, the unadjusted relation between CWLV distance and ECG voltage was directed in the opposite direction as to men (ie, a larger distance was associated to greater ECG voltage in left-sided leads). This could be related to (1) the intrathoracic or extrathoracic electrophysiological characteristics (eg, due to differences in muscle and fat composition), or (2) the methodology of ECG lead placement, if also associated with a systematic difference in where echocardiographic images were acquired, so that the measured distance to the chest wall would be greater in women. Within men or women, differences in tissue layer patterns (muscle, bone, fat, cartilage, glandular tissue and water) could explain the scatter of QRS voltage relative to heart distance or LVM. Probable differences in tissue strata conductance, so exaggerated when comparing men and women in our sample, provide a possible explanation for the weak intersex correlation between surface QRS voltage, heart distance and LVM.
Aiming to explore the effect of breast tissue on ECG voltage, LaMonte and Freiman18 examined presurgical and postsurgical ECGs in 39 subjects who underwent left (n=20) or right (n=19) radical mastectomy. They found that after left-sided mastectomy, not only did the lead voltage increase significantly in precordial leads directly under the removed breast, but also in the most lateral leads (V5–V6). In addition, precordial lead voltage also increased after right-sided mastectomy, implying an important role of the breast tissue per se on the conducting properties of the chest wall as a whole. Later, Rautaharju et al19 examined the effect of thoracic size and breast tissue protuberance on ECG voltage in a large non-athletic cohort of women. They found a decrease in R-wave amplitudes as well as in the summed voltages of the Sokolow-Lyon criteria with increasing breast protuberance, although the magnitude of this effect was small (15 μV or less for each 1 cm increment in breast protuberance). Altogether, these studies imply that breast tissue exerts a diminishing effect on ECG voltage both by altering electrophysiological properties as well as a direct distance effect. It is thus possible that, in our study, in women with larger breast protuberance, probe placement was such that the measured distance to the chest wall was smaller while the ECG voltages were lower. Further studies applying probe-independent measurements of CWLV distance, such as cardiac MRI, are needed to fully elucidate the distance–voltage relationship.
Limitations
First, although we show very high reliability in the CWLV–distance measures, the echocardiographic examination was not a priori designed to explore the CWLV–distance; therefore, we were unable to standardise echocardiographic views. Second, we lack measures of body composition (dual energy X-ray absorptiometry or skin callipers) and thorax circumference. Third, other diagnostic modalities such as cardiac MRI or CT (preferably using breath-hold techniques) would provide more precise measurements, independent of probe placement. Finally, our population sample included only 18% women and only 11 athletes presented with echocardiographic LVH.
Conclusion
Our results emphasise the poor relation between ECG voltage and LVM. The CWLV distance was an independent, but weak, predictor of ECG voltage and could contribute to some extent to the poor diagnostic capabilities of available ECG criteria for LVH in athletes. Future studies incorporating measures of body composition and thoracic circumference could further elucidate the predictors of surface ECG voltage, as could studies on subjects with pathological hypertrophy.
References
Footnotes
Twitter @KristoferHedman
Contributors KH, FH and VF contributed to the conception or design of the study. VF, DHa and FH acquired the data and managed the database. KJM and FH acquired the echocardiographic images and measures. All authors contributed to the interpretation of data for the work. KH drafted the manuscript. All authors critically revised the manuscript and gave final approval and agree to be accountable for all aspects of work ensuring integrity and accuracy.
Funding KH received funding through postdoctoral grants from the Fulbright Commission, the Swedish Heart Foundation, the Swedish Society of Medicine and the County Council of Östergötland, Sweden. In addition, general funding from the Stanford Cardiovascular Institute was used to complete this study.
Competing interests VF and DHa are developers and part-owners of the ECG system used to acquire the digitised ECG data (Cardea 20/20 ECG System, Cardic Insight, Bellevue, Washington, USA).
Patient consent for publication Not required.
Ethics approval The study was approved by the institutional review board at Stanford University (approval numbers 12245 and 25673), and all subjects gave their written informed consent.
Provenance and peer review Not commissioned; externally peer reviewed.
Data availability statement Deidentified data for this study are available upon reasonable request.