Article Text

Abstract
Objectives Our aim of this study was to quantify the physical demands of elite rugby union players by each position as a step towards designing position-specific training programme using a Global Positioning System/accelerometer system.
Methods This study was performed as a retrospective observational study. Data were obtained from 45 official matches. The sample size used for the analysis was 298. The per-match total distances, accelerations and impacts were calculated and statistically compared for the forwards and backs and for individual positions.
Results Total distances for the forwards and backs were 5731.1±507.8 and 6392.1±646.8 m, respectively. The high-velocity running distances (>18.0 km/hour) covered by the forwards and backs were 317.4±136.9 and 715.0±242.9 m, respectively. The number of accelerations (>1.5 m/s2) for the forwards and backs were 76.3±18.9 and 100.8±19.6 times, respectively, and the number of high impacts (>10 g) were 48.0±46.9 and 35.6±28.3 times for the forwards and backs, respectively. All characteristics were significantly different between the forwards and backs (p<0.05). The per-position characteristics were also calculated. Within the backs, scrum half (SH) and wingers (WTBs) covered high-velocity running significantly higher distance than fly-half (SH d=2.571, WTBs d=1.556) and centres (SH d=1.299, WTBs d=0.685) (p<0.05).
Conclusion By clarifying the physical demands according to the positions, it will be possible to create optimised position-specific training programmes.
- load monitoring
- performance
- game analysis
- position characteristics
- training programme
This is an open access article distributed in accordance with the Creative Commons Attribution Non Commercial (CC BY-NC 4.0) license, which permits others to distribute, remix, adapt, build upon this work non-commercially, and license their derivative works on different terms, provided the original work is properly cited, appropriate credit is given, any changes made indicated, and the use is non-commercial. See: http://creativecommons.org/licenses/by-nc/4.0/.
Statistics from Altmetric.com
What are the new findings?
The physical demands of elite rugby union players in a match in Japan were revealed.
This finding allows comparison with overseas teams.
Not only tha data of classification of forwards and backs, but also the distance traveled, acceleration, and impact of each position became clear.
The idea of developing strength and conditioning programme based on the results was presented.
Introduction
Player movements during a rugby union match consist of intermittent bouts of intense motion, requiring explosive force exertion for high-velocity activities, such as sprinting, tackling and scrummaging, with breaks comprising low-intensity activity, such as walking and jogging.1–3 Previously, research on the physical demands on players during a rugby union match was often analysed using video-based time-motion analysis. Austin et al reported on the distance and speed of travel during a match, while Eaton and George reported on tackling and scrum management.2 4–7 However, methods using video-based time-motion analysis in rugby union can be unreliable because they are vulnerable to the subjectivity of the evaluator/analyst.8 9 Also, video-based time-motion analysis cannot evaluate contacts such as impacts.
To improve the objectivity, Global Positioning Systems (GPS) and accelerometers have been used to analyse in-match physical demands.10–12 Currently, there are reports on the reliability and validity of GPS units.11–14 GPS units with built-in accelerometers can obtain data reliably and in real-time, unlike video-time analyses, and have thus been commonly used for analysing physical demands in team sports such as soccer,15 16 field hockey,17 18 rugby league19 20 and Australian Football League.21 22 On the other hand, there are few studies using GPS to analyse physical demands of contemporary rugby union play compared with other sports (soccer, rugby league and Australian football league).8 23–26 In addition, even in the reported research, there are issues such as the lack of statistical analysis due to the small sample size, and not being analysed by individual positions in the classification of forwards and backs. Such analyses are insufficient as a study of physical demands.
Notably, there are few reports detailing the physical demands during elite rugby union matches in Japan.27 Therefore, this study was designed to analyse the physical demands of elite rugby union players in Japan during a match using a GPS/accelerometer system. We analysed the raw data from players who played full matches and calculated the physical demands in terms of distance travelled, accelerations and impacts. We also statistically analysed these calculations for the forward and back groups and for each individual position. We believe that these data will enable sports scientists and strength and conditioning coaches to develop improved training programme that can improve player performance and reduce the risk of injuries related to non-optimal training.
Previous studies have shown physical demands in the forwards and backs classifications, but each position is assumed to have unique characteristics beyond the forwards and backs classifications. Thus, our aim of this study was to quantify the movement (or physical) demands of elite union players by forwards and backs as well as each position using a GPS/accelerometer system. Then, by understanding of the movement (or physical) demands, it may provide valuable insight into an effective strength and conditioning training programme for each position based on game-based training approaches. We hypothesised that backs would move in faster speed zones and their mileage would be relatively longer than forwards. On the other hand, forwards would have heavier body loads because of spending more time in slower and high-intensity activities such as scrums compared with backs.
Methods
Design
Data were collected using GPS units with built-in accelerometers during official matches from one team belonging to the Japan Rugby top league. The team played 14 matches in 2013 (4 wins–10 losses record), 16 matches in 2014 (6 wins–10 losses) and 15 matches in 2015 (4 wins–10 losses–one draw), that is, a total of 45 matches (14 wins–30 losses–one draw) over three seasons. As the Japan Rugby top league is the pre-eminent rugby competition in Japan, the data collected for this study can be said to be that of elite rugby union. We analysed the raw data from players who played full matches over three seasons and calculated the physical demands in terms of distance travelled, accelerations and impacts. We then statistically analysed these calculations for the forward and back groups and for each individual position.
Participants
Data were obtained from one team belonging to the Japan Rugby top league. The participants were 15 starting members in each match (n=675). However, we excluded those players who did not play the full 80 min duration (ie, those who underwent substitution for any reason). A total of 298 subjects (forwards: age 27.9±3.0 years, height 183.1±6.3 cm and body mass 100.3±7.2 kg, backs: age 27.7±2.7 years, height 173.9±7.8 cm and body mass 84.2±11.8 kg) were used in the sample analysis.
GPS unit data from the matches were collected from dedicated teams. The objectives and possible limitations of the study were explained to potential subjects. Written consent was obtained from all subjects prior to enrolment. This research was done without patient involvement.
GPS analysis
We used GPS units (SPI Pro X; GPSports Systems, Canberra, Australia) with built-in accelerometers with sampling frequencies of 5 and 100 Hz. The GPS unit was placed on the upper middle back between the scapulae of the subject using special protective vests recommended by the manufacturer. Previous studies have shown that GPS units have acceptable reliability and validity to measure movement.11–14 Previous studies have shown the reliability of GPS units using intraclass correlation coefficient, and the results show high reliability from 0.98 to 0.99.28
The GPS system and accompanying software (Team AMS; GPSports Systems) can measure the total distance, distance travelled within velocity ranges (‘zones’), acceleration/deceleration, impact (using the accelerometer) and heart rate when synchronised with a heart rate monitor.29 Distance (total distance and distance travelled within velocity zones), acceleration and impact were used for analysing physical demands during a match.
Distance travelled
The total distance travelled between ‘kickoff’ and ‘fulltime’ was measured as the total distance, including both when the ball was in and out of play. The out-of-play distance was included because rugby uses a running clock, and positioning for the next play (quickly) is as important as that when the ball is in play.29 30
Total distance was subdivided into total distance/velocity by binning velocity into three zones (ranges): speed zone SZ-1 (0–12.0 km/hour, SZ-2 (12.1–18.0 km/hour) and SZ-3 (>18.0 km/hour). Both the absolute value of the distance travelled in each zone and percentage of the total distance were calculated. The threshold of the speed zone was set based on the previous research of rugby union.8
Mean velocity was calculated by dividing the total distance by 80 min.
Accelerations
Accelerations were calculated from the GPS data as velocity per unit time (m/s/s, ie, m/s2) and binned into three zones as follows: acceleration zone (AZ)-1, 1.5–2.0 m/s2; AZ-2, 2.0–2.5 m/s2; AZ-3, >2.5 m/s2. The threshold of the AZ was set based on the previous research of rugby union.8
Impacts
Impacts were calculated from the accelerometer data. The three-dimensional (triaxial) linear accelerometric values were collected and transformed into gravity (g) by dividing the raw value by 9.81 m/s2. Impacts were binned into two impact zones (IZ): IZ-1 (8.1–10 g) and IZ-2 (>10 g).
Classification of positions
Rugby union consists of 10 positions: five forwards positions (props (PRs), hooker (HO), locks (LOs), flankers (FLs), eight-man/number eight (No. 8)) and five backs positions (scrum-half (SH), fly-half (FH), centres (CTBs), wings (WTBs) and full back (FB)). Analyses were performed on the combined data of the forwards or backs positions as well as on each individual position.
Statistical analysis
Data were delineated as mean±SE. The coefficient of variation (CV) was also calculated to compare the variability of the data for each parameter.
First, the homogeneity of variance was tested using Bartlett’s test. As most did not satisfy these conditions, non-parametric Kruskal-Wallis hypothesis test was used to compare variables between forwards and backs as well as among individual positions. When differences were significant, multiple comparisons were made using Steel-Dwass test. Epsilon partial squared (εp 2) and Cohen’s d were calculated as effect size. Statistical significance was set at p<0.05. ‘R’ was used for statistical analysis.
Samples measured in this study were similar to those in previous researches, and players participated in multiple matches. The methodology used was adopted from previous research.23
Results
Distance travelled
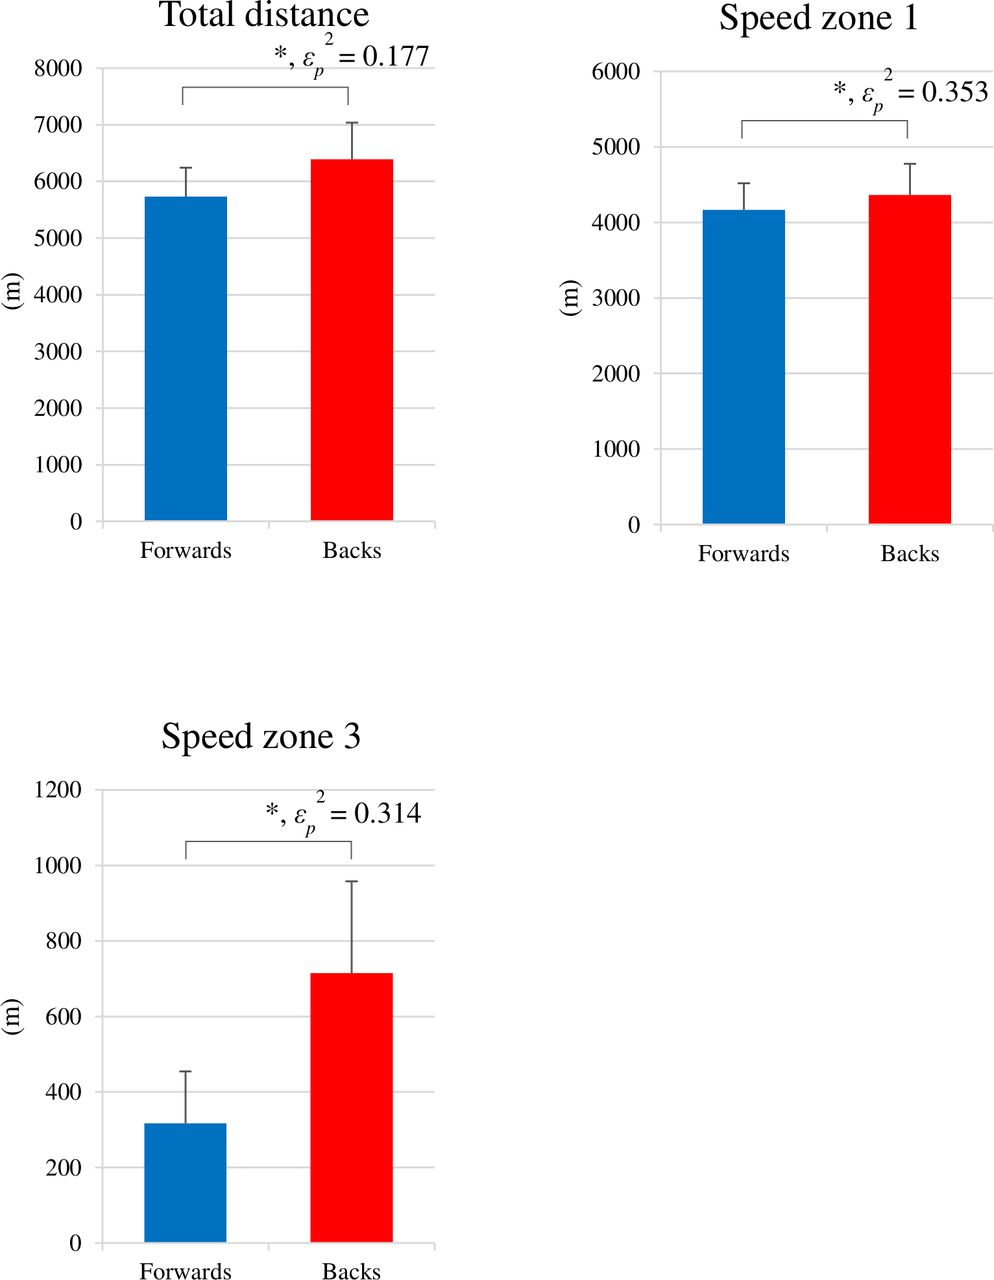
The total distance covered per match by the forwards and backs was significantly different (p<0.05, εp 2=0.177) (table 1 and figure 1). Of the forwards, LOs (d=1.484) and FLs (d=1.559) covered significantly longer distances than No. 8 (p<0.05, respectively). Of the backs, SH covered significantly longer distances than WTBs (d=1.633) and CTBs (d=1.915) (p<0.05). In addition, the distance covered by FB was significantly longer than that by FH (d=1.395), WTBs (d=1.680) and CTBs (d=1.945) (p<0.05) (table 1).

Match data per position (forwards and backs). *Significantly different (p<0.05).
Match data for each position
The distances covered in SZ-3 by the forwards and backs were also significantly different (p<0.05, εp 2=0.314) (table 1 and figure 1). Of the forwards, LOs (PRs d=1.101, No. 8 d=1.507) and FLs (PRs d=1.551, No. 8 d=2.023) covered significantly longer distances than PRs and No. 8 (p<0.05). Of the backs, significant differences were found between SH and WTBs compared with FH (SH d=2.571, WTBs d=1.556) and CTBs (SH d=1.299, WTBs d=0.685), and between CTBs and FB compared with FH (p<0.05), with the former being greater than the latter in both the cases (table 1).
The backs covered significantly longer distances in SZ-1 than the forwards (p<0.05, εp 2=0.353) (table 1 and figure 1). The forwards’ results did not differ significantly according to position, but FH and FB covered significantly longer distances than SH (FH d=1.580, FB d=2.980), WTBs (FH d=0.422, FB d=2.133) and CTBs (FH d=0.887, FB d=2.169) (p<0.05) (table 1).
The CV of the total distance showed a small value; moreover, it indicated a large value as the moving speed increased (table 1).
Acceleration
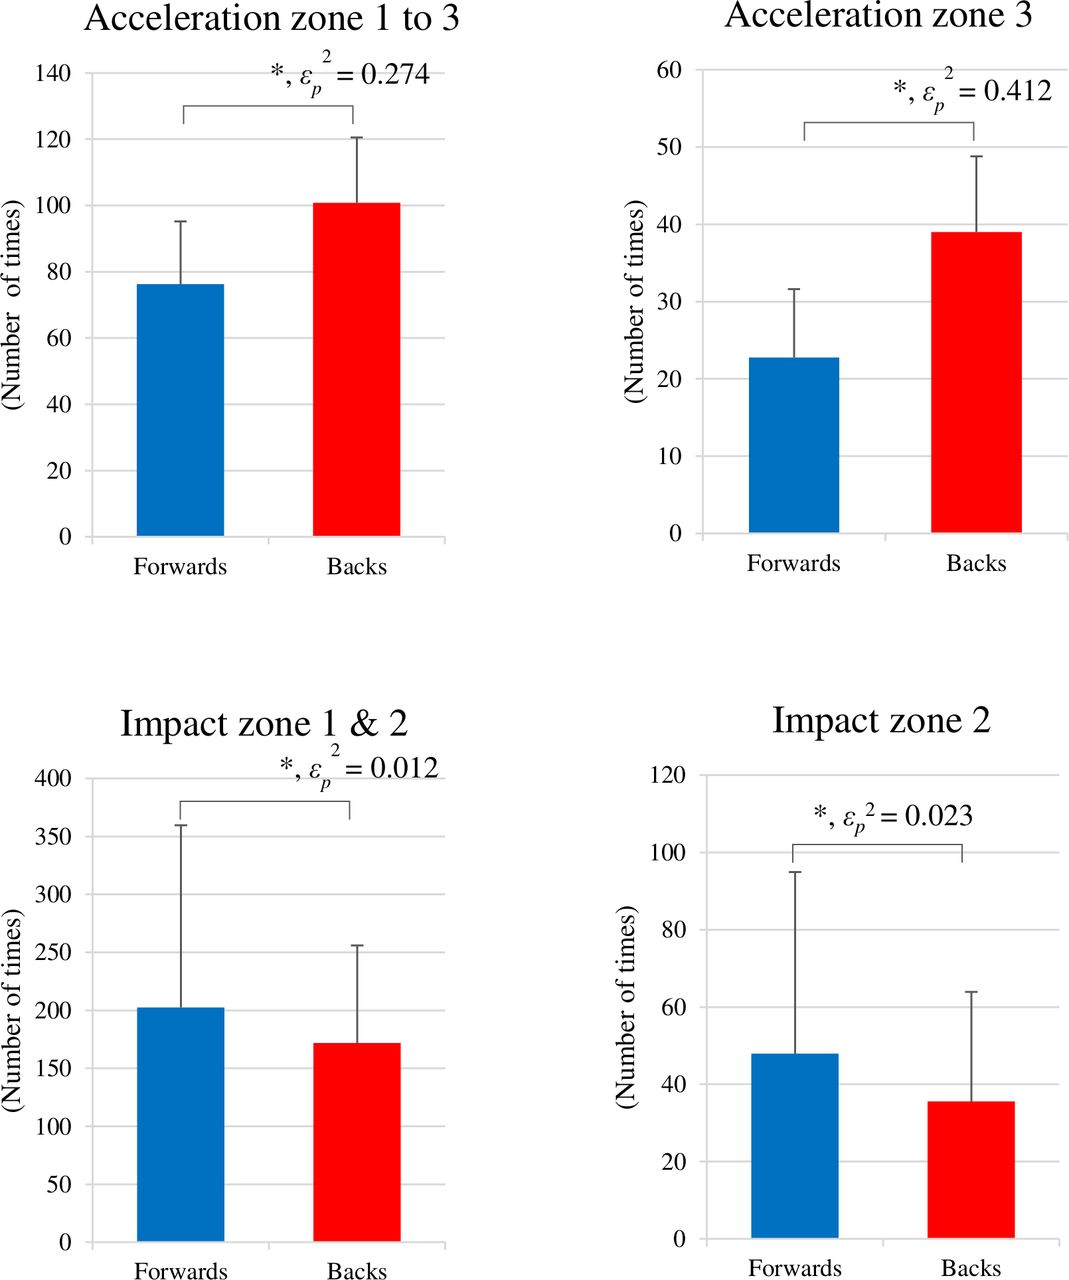
The number of accelerations for the forwards and backs was significantly different (p<0.05, εp 2=0.274) (table 2 and figure 2). Of the forwards, LOs (PRs d=1.315, No. 8 d=1.731) and FLs (PRs d=1.505, No. 8 d=1.868) were required to accelerate many more times than that by PRs and No. 8; SH (FH d=1.591, CTBs d=1.806, WTBs d=1.196, FB d=1.568) had to accelerate many times than that by other backs (p<0.05) (table 2).
Match data per position (forwards and backs). *Significantly different (p<0.05).
Match data per position for acceleration and impact
The number of accelerations in AZ-3 was significantly higher for the backs than for the forwards (p<0.05, εp 2=0.412) (table 2). Of the forwards, LOs (PRs d=1.834, No. 8 d=1.428) and FLs (PRs d=2.158, No. 8 d=1.787) had significantly higher number of accelerations than PRs and No. 8 (p<0.05); of the backs, FB had significantly lower accelerations than WTBs (FB d=0.867) (p<0.05) (table 2).
Impacts
The number of impacts was significantly higher for the forwards than for the backs (p<0.05, εp 2=0.012) (table 2 and figure 2). There were no significant differences among the forwards, whereas CTBs had a significantly higher number of impacts than SH (CTBs d=0.830), FH (CTBs d=0.973) and WTBs (CTBs d=0.926) (p<0.05) (table 2).
For the high-force (IZ-2) zone, there was a significant difference between the forwards and backs (p<0.05, εp 2=0.023) (table 2 and figure 2) but none between any individual positions (table 2).
Discussion
This study analysed the physical demands of elite rugby union players in Japan based on data from a team belonging to Japan Rugby top league. Knowledge of the physical demands during a match can help sports scientists and strength and conditioning coaches create optimised training programme aimed at improving competitiveness and possibly avoiding injury.
We only analysed the players who played for the complete duration of the match (80 min) without being substituted. In previous research, data for substituted players were included by extrapolating full match data from the partial-match ones.7 However, because this technique cannot account for fatigue or performance degradation during an actual match, they are not likely to be an accurate evaluation of the physical demands of a full match. In addition, previous research has stated that the appropriateness of extrapolating data to provide full match data information is questionable.23
As hypothesised, in terms of the total distance travelled and speed (mean velocity over the 80 min match), the forwards showed significantly lower values than the backs (5731 and 6392 m, 71.6 and 79.9 m/min, respectively). The differences averaged to 660 m and 8 m/min per match. In terms of SZ-3, backs covered 715 m and forwards covered 317 m; the per cent SZ-3 for the backs was 11.2% and for the forwards was 5.5%. The total distance is a measure of the overall amount of exercise, whereas SZ-3 indicates exercise intensity. Therefore, our data suggested that the backs had higher load and intensity during a match. Notably, in SZ-1, the significant difference in the distance travelled was not present when the percentage of the total distance was considered. Thus, the difference in endurance-related and activity-related physical demands between forwards and backs during a match is related to the amount of SZ-3. However, SZ-3 was uniformly defined for all positions, although forwards are likely to have a lower maximum speed and require a greater effort to reach SZ-3. Adjusting the speed zones for position and taking maximum speed into account would enable a more detailed analysis of exercise intensity.
When comparing the results of previous studies of European professional teams with those of this study, the total distance is effectively equivalent.23 25 Despite Japan’s national team holding a lower rank than other national teams competing in the rugby World Cup, the total work levels are very similar. This seems to indicate that it is impossible to sufficiently evaluate team ability by work alone. Thus, accelerations and impacts were also analysed.
Backs recorded significantly higher total and AZ-3-specfic accelerations than the forwards. In particular, AZ-3, which mainly represents sprints, was considerably different (0.29 and 0.49 bouts/min for forwards and backs, respectively). Thus, the backs are required to perform intense accelerations more often during a match. It should be noted that the maximal acceleration possible for the forwards is likely to be lower than that for the backs, which could have resulted in a bias in the results.8
Impacts, in contrast to accelerations, resulted in a significantly higher result for the forwards than for the backs which is consistent with our hypothesis. Impacts occur when a tackle is made and when any physical shock is applied to the body. For instance, situations related to competition for the ball, such as breakdowns and contact with the ground, also register as impacts. As expected, the forwards are required to absorb a high number of impact loads. Thus, it is necessary for forwards to increase their fitness so that players can repeat contacts. In addition, it is necessary to increase muscle hypertrophy for players to prevent injury from high-impact collision.
Within the forwards, distance of SZ-3 and the number of times of AZ-3 for LOs and FLs were significantly higher than those for the other positions. Our data indicate that LOs and FLs are required to increase their maximum speed and repeat-sprint ability compared with the other forwards.
Notably, the data for No. 8 was different than those from previous study.23 In the previous study, No. 8 was similar to LOs in terms of total distance; however, in the present study, No. 8 had lower total distance than LOs. The No. 8 data for this study were obtained from players with relatively heavy weight (over 120 kg). Therefore, the No. 8 data in this study may have been greatly influenced by the characteristics of that specific player. In order to measure the physical demands of No. 8, additional research is needed with a larger player population to better clarify the results.
In addition, LOs had higher impact values than those of the other forward positions for IZ-2 (57 times). Thus, LOs should be considered to be in a position that requires above-average physical strength (relative to other forwards as well as backs) to repeatedly engage in contact while maintaining the sprinting ability mentioned earlier.
Within the backs, the total distance by SH and FB was ≥7000 m, which is approximately 600–900 m higher than that for other backs. The CV of the total distance by SH and FB was approximately 5%, which was lower than that of other positions and indicated that SH and FB move constantly for over 7000 m per match. SH also performed significantly more SZ-3 (873 m; 12.4%) and significantly greater acceleration (122 times). SH must always move quickly to the rack during an attack and pass the ball. It is considered that the total distance and the number of accelerations showed a high value due to this characteristic. FB is the most rearward position and must cover a large space during attacks and defenses. It is considered that the total distance has increased due to this characteristic. Also, since these characteristics of SH and FB are not greatly affected by wins and losses and match result, CV also showed a small value.
Regarding the backs, WTBs recorded over 800 m of SZ-3 and had the highest AZ-3 scores. Thus, WTBs need to be able to sprint repeatedly and require training for improving their maximum speed. On the other hand, CTBs deal with higher impact loads than other backs. When creating a training programme for CTBs, it is necessary to incorporate more contact fitness with repeated tackles and down-up operations.
This study objectively visualised the physical demands of rugby union matches and supported the empirical observations coaches had identified through their experiences. Overall, the interpretation of data obtained from the GPS unit is yet to be undertaken, and the new possibilities for analysis with the use of GPS units that this invites are unlimited. Additional research is required to qualitatively analyse the data obtained from the GPS units.
Conclusion
Differences in the type of physical demands on the forwards and backs were demonstrated, indicating the necessity for specialised training according to the role of the players as well as their specific positions. SH and FB should be provided training programme with high load, but SH additionally should be given more high-intensity exercise (eg, repeated sprint). Guidelines can be developed according to these results to optimise training programme for each position. Finally, other ideas on how to implement this in actual sports are shown in tables 3 and 4.
Application to training for each forwards position
Application to training for each backs position
Acknowledgments
The authors would like to thank Dr. Takemura for his expert statistical help and Enago (www.enago.com) for the English language review.
References
Footnotes
Contributors All authors were involved in the conceptualisation, design and conduction of the study. All authors were involved in the drafting and revision of the manuscript for intellectual content, and all approved the final version of the article. HY and TH planned the study. HY conducted a survey. MT conducted statistical analysis. JI and JT helped with the writing of the paper. MT proofreads English.
Funding The authors have not declared a specific grant for this research from any funding agency in the public, commercial or not-for-profit sectors.
Competing interests None declared.
Patient and public involvement statement No patients were involved in this study. Participants who took part in this study received feedback on the results.
Patient consent for publication Not required.
Ethics approval This study was approved by the Ethics Committee of Doshisha University (approval number 17084).
Provenance and peer review Not commissioned; externally peer reviewed.
Data availability statement Data are available on reasonable request.