Article Text

Abstract
Objectives The purpose of this study was to quantify the impact of morphological characteristics on freestyle swimming performance by event and gender.
Design Height, mass, body mass index (BMI) and speed data were collected for the top 100 international male and female swimmers from 50 to 1500 m freestyle events for the 2000–2014 seasons.
Methods Several Bayesian hierarchical regressions were performed on race speed with height, mass and BMI as predictors. Posterior probability distributions were computed using Markov chain Monte Carlo algorithms.
Results Regression results exhibited relationships between morphology and performance for both genders and all race distances. Height was always positively correlated with speed with a 95% probability. Conversely, mass plays a different role according to the context. Heavier profiles seem favourable on sprint distances, whereas mass becomes a handicap as distance increases. Male and female swimmers present several differences on the influence of morphology on speed, particularly about the mass. Best morphological profiles are associated with a gain of speed of 0.7%–3.0% for men and 1%–6% for women, depending on race distance. BMI has been investigated as a predictor of race speed but appears as weakly informative in this context.
Conclusion Morphological indicators such as height and mass strongly contribute to swimming performance from sprint to distance events, and this contribution is quantified for each race distance. These profiles may help swimming federations to detect athletes and drive them to compete in specific distances according to their morphology.
- morphology
- swimming
- performance
- Bayesian regression
- talent identification
This is an open access article distributed in accordance with the Creative Commons Attribution Non Commercial (CC BY-NC 4.0) license, which permits others to distribute, remix, adapt, build upon this work non-commercially, and license their derivative works on different terms, provided the original work is properly cited, appropriate credit is given, any changes made indicated, and the use is non-commercial. See: http://creativecommons.org/licenses/by-nc/4.0/.
Statistics from Altmetric.com
What are the new findings?
Taller swimmers have a higher probability to swim faster, and the complete probability distributions are computed for all distances and genders (only freestyle technique was investigated).
For sprinters, a larger mass is an advantage, whereas distance swimmers need to be lighter.
Optimal morphological profiles, depending on distance, gives a 0.7%–3.0% (male) and 1%–6% (female) increase in speed.
Body mass index offers a poor predictor of performance and appears as a low-informative morphological feature in swimming.
How might it impact on clinical practice in the future?
This study provides reference values of morphological characteristics as height and body mass for freestyle swimming. These insights should help coaches and swimming federations to detect talents and drive them to compete in specific distances, depending on their morphological profiles.
Introduction
In swimming, a major challenge of the athlete lies in transformation of metabolic power into mechanical power with a given energetic efficiency,1 where aquatic conditions increase the energy needed to overcome water resistance. Therefore, most of the studies about elite swimmers are focused on physiological and biomechanical aspects.2 3 In those works, morphological data are reported for information. However, some authors have shown strong relationships between energy cost and morphology in swimming.4 5 The impact of body size on drag coefficient,6 underwater current,7 8 passive drag,9 buoyancy, energy cost and swimming efficiency10 11 has been studied and quantified. Morphology has gained a greater interest with the development of technology and the occurrence of new swimsuits,12 but only a few studies describe height, mass or body mass index (BMI) as performance predictors for elite swimmers. Pyne et al13 observed lean mass variations of elite swimmers within and between seasons, and Dufour et al14 demonstrated that the performance differences between men and women could be explained by body composition differences. Moreover, Lätt et al15 examined the effects of physiological, biomechanical and anthropometrical parameters on sprint performance. For adolescent swimmers, morphological parameters were related to 100 m front crawl swimming time as well as physiological features. Unfortunately, no comparison was made between events and genders in this study. In athletics, Bejan et al16 showed that, in sprint events, world records were related to body size and highlighted the morphological effects on performance. These optimal physiques were presented in some sports such as track and field events,17 18 triathlon,19 rowing,20 canoeing and kayaking.21 In swimming, other authors argued that anthropometrical parameters have effects on swimming performance.22 23 Khosla24 highlighted the fact that finalist swimmers at the 1976 Montreal Olympic Games were taller and heavier than non-finalists. Recently, Shaw and Mujika23 confirmed morphological influence in elite open-water swimmers, where lower body mass and lean mass index were correlated with better world championship finishing positions.
Until now, no study has quantified relationships between each morphological characteristic and performance for elite swimmers with a Bayesian approach. Such a methodology offers straightforward interpretations of the results in terms of probability. Moreover, a Bayesian model also gives more nuances to the computed parameters by estimating a complete distribution instead of a unique value. The present paper aimed to quantify the impact of morphological characteristics on freestyle swimming performance by event and gender.
Methods
The results of the top 100 world-ranking swimmers were collected each year from 2000 to 2014 for both genders for all freestyle events. Name, height, mass, BMI, event, date and best time performance (converted into speed, in m/s) was recorded for each swimmer. All data were collected from the website of the international swimming federation (FINA). The database is composed of 8484 observations for male swimmers and 8606 observations for female swimmers.
Several athletes appear multiple times in the database because of their different race results in the time period, and this could lead to biases if not addressed. This particularity was taken into account in the definition of the model. In order to study relationships between morphology and performance, a hierarchical Bayesian regression model was built. The hierarchical approach settles the problem of multiple appearances of athletes in the database. Each swimmer was considered as a random effect in the model, allowing considering their own variability of performance, as well as the variability between different swimmers.
Since the scatterplot of performance according to mass or height shows a linear trend, the model assumes linear relations. However, because of its definition, the BMI was not considered as a predictor variable in the same model. Indeed, BMI does not bring any additional information into a regression model with height and mass covariates. Thus, BMI has been studied within an alternative model as a unique predictor variable. Formally, the first hierarchical Bayesian regression model is defined as

where
·  represents the speed of the individual i.
· H is the height.
· M is the mass.
·  is the random effect of the individual i.
· ϵ is an error term, a centred Gaussian variable of SD σ.
· a, b and c are real valued coefficients.
In a Bayesian framework, all parameters of the model are assumed to be random variables, and the resulting estimations are made on their probability distributions. The hypothesis on the likelihood and the prior distributions of the models are as follows:
· .
.
· .
.
·
·
· .
.
·
The model was fitted and estimated using a Markov chain Monte Carlo (MCMC) algorithm from the package of the software. The resulting distributions are sampled from a stable MCMC and stored as a vector of size 50 000. Prior distributions are chosen vague, with high variances. Considering the number of observations, one can consider the influence of the prior on the results as extremely weak.
A similar framework was used to define the regression of speed by BMI through the following model:

where B represents the BMI and other components are the same as previously mentioned. Thanks to the MCMC simulations, a posterior distribution has been estimated for  and
and  , for all swimmers i. Then, using the regression model, the posterior distribution of speed S was computed for each possible couple of (mass, height). The intervals of mass considered were (59 to 87) kg for men and (46 to 81) kg for women, and those for height were (1.68 to 2.04) m for men and (1.52 to 1.91) m for women. The same procedure was used for the BMI regression model. In total, 12 models were estimated to study relationships between height, mass and speed, one for each race distances (50, 100, 200, 400, 800 and 1500 m) and for both genders. In the case of BMI, 12 models were defined as well.
Several statistics and information were extracted from resulting parameter distributions of these models, such as mean and credible intervals. One should be aware that those numbers are always less informative than an entire probability distribution that a Bayesian analysis provides. However, in this study, the necessity to compare multiple variables and race distances forced us to use such measures to present results in a meaningful way.
The research protocol qualified as non-interventional, in which ‘…all acts are performed in a normal manner, without any supplemental or unusual procedure of diagnosis or monitoring’ (Article L1121–1 of the French Public Health Code). According to the law, its approval therefore did not fall under the responsibility of a committee for the protection of persons, therefore not requiring informed consent from individual athletes.
Results
Description of the data set
During the studied period (2000–2014 across all freestyle events), a world top 100 male swimmer was, on average, 1.87 m tall and weighted 80 kg, and thus had a BMI of 22.9 kg/m². Furthermore, a world top 100 female swimmer was, on average, 1.74 m tall and weighed 63.5 kg, leading to a BMI of 21 kg/m².
Coefficients of the regression models
A summary of the results of the height–mass regression is provided in table 1. The interpretation differs with respect to the considered coefficient. Note that only means and 95% CI are presented for obvious reasons of synthesis, although the entire posterior distributions were simulated. However, since all distributions are approximately Gaussian, these two statistics are adequate to communicate the major information.
Summary of posterior probabilities for regression coefficients
First, the coefficient σ is a SD term. It informs us about the uncertainty and the dispersion of the observations around the linear plan defined by the regression model. Posterior distributions of σ appeared rather comparable between different race distances and gender, which seems consistent, knowing that all models are fitted using an equivalent number of observations. Nevertheless, one can note that 200 and 400 m for both genders seem less scattered. This could indicate that results are tighter on those races, possibly as a consequence of more contest on such intermediate distances.
Second, the coefficient a is known as the intercept in a regression model. It represents here the speed if both height and mass are 0. The posterior distributions of a mostly inform on hierarchy of speed achieved during a race. Thus, it seems logical to observe a decrease in a as distance increases, and between male and female swimmers. Finally, both b and c have analogous roles. They represent the influence of, respectively, height and mass on the speed. A positive coefficient indicates an advantage in being taller or heavier, as on the contrary, a negative coefficient expresses a drawback. One can see on table 1 that for male 50 m and female 100 m, with a probability of 95%, both height and mass have a positive correlation with speed. More generally, height is always positively correlated with speed with a high confidence, since none of the 95% credible intervals crosses 0. This influence seems particularly important on long distance (800 and 1500 m) for both genders and for 200 m male and 400 m female swimmers. Conversely, except for the two distances indicated earlier, mass seems most of the time negatively correlated with performance. Unclear credible intervals, crossing 0, indicate uncertainty and weak influence for male 100 m, and female 50 and 200 m. In every other case, mass appears as disadvantageous, and this effect increases with distance.
Effect of height–mass couples on speed
Figure 1 provides an example of posterior probability distributions resulting from the model. It represents two distributions of the speed S, for two different height–mass couples. For these illustrative morphologies, one can see the slight advantage to be taller and lighter for male 100 m. More importantly, figure 1 exhibits the uncertainty that remains about this benefit. If the blue speed distribution (2 m–90 kg) is shifted, the range of credible values crosses largely the red speed distribution (1.70 m–80.0 kg). Such a result points out that, although influential, morphology is not the only factor that leads to performance. Whereas such a graphical representation is highly informative, the necessity to compare multiple profiles and race distances forced to extract only partial information from these distributions. As presented in figure 1, all posterior speed distributions show a comparable shape and dispersion. Differences mostly appear through a position parameter, such as the mean, that we used. Hence, results in figure 2A,B are displayed in terms of mean, and one should keep in mind the uncertainty around these values, though the mean differences remain meaningful.
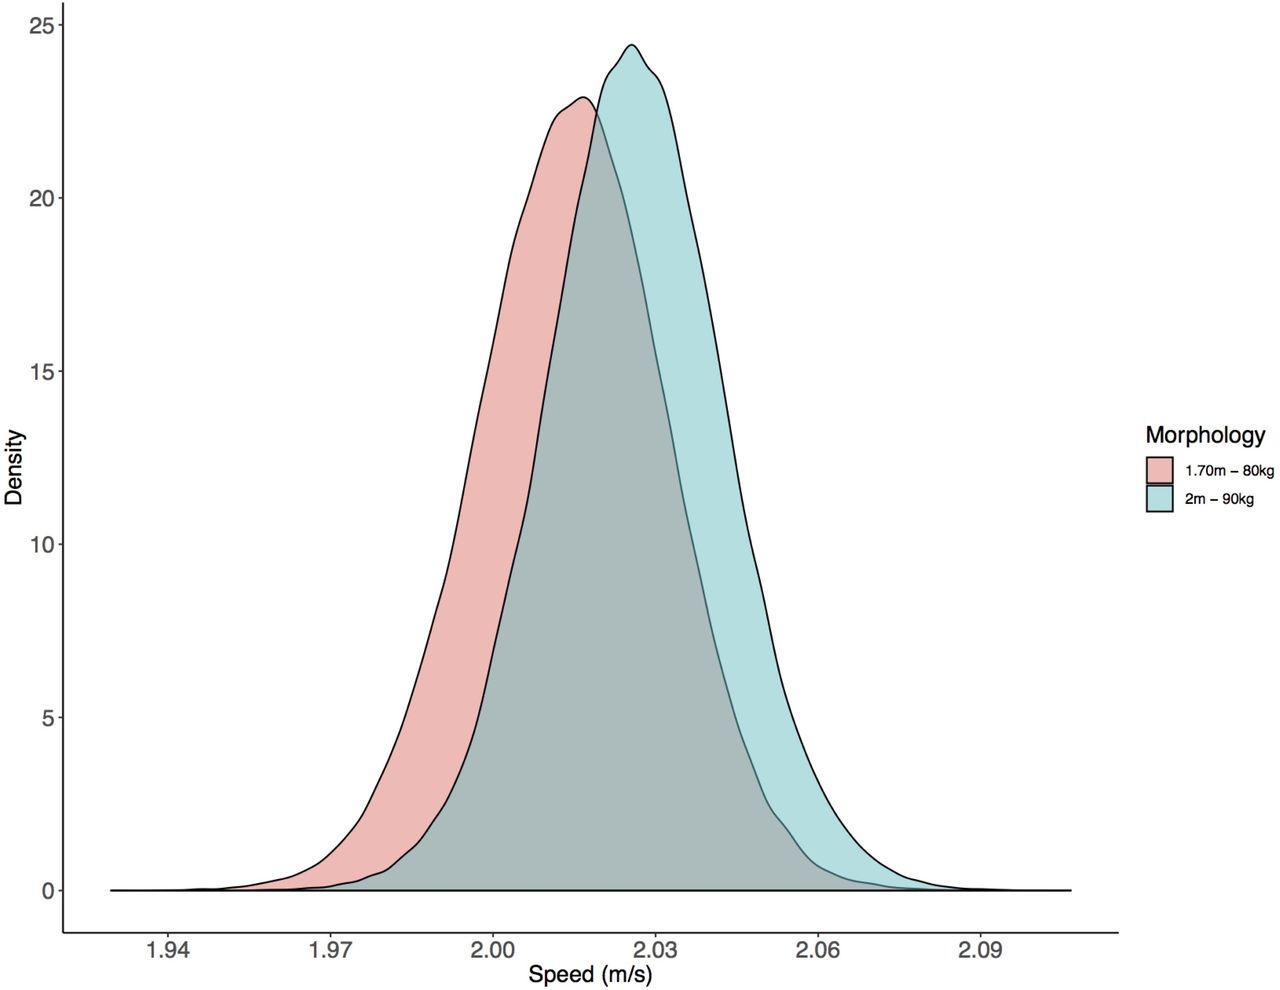
Posterior probability distributions of race speed according to the height–mass Bayesian hierarchical regression model for two different morphological profiles. Distributions are sampled from a Markov chain of length 50 000.
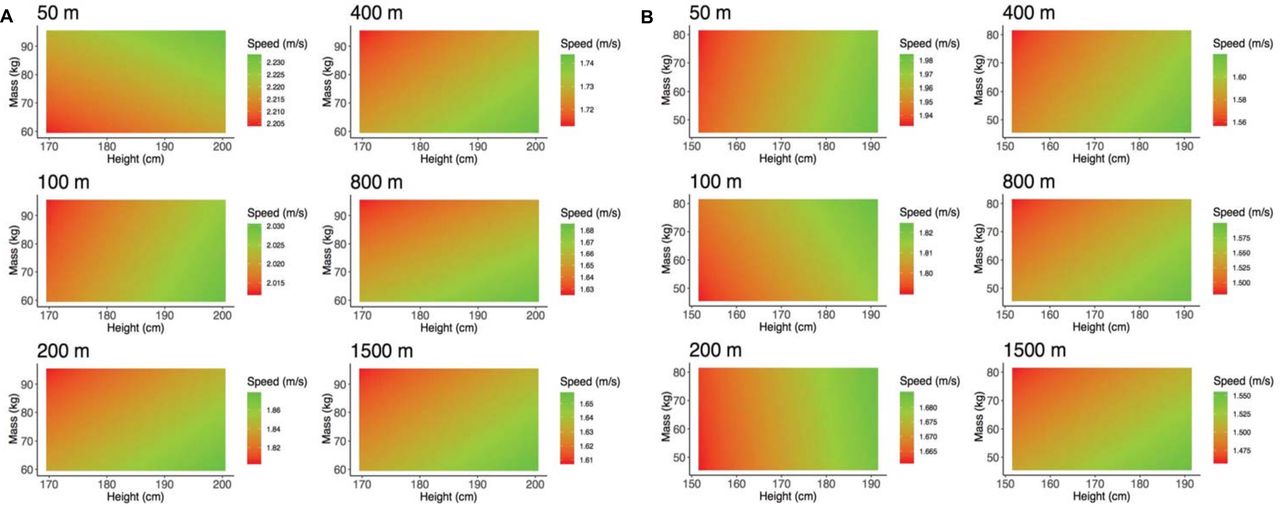
(A) Heat map of mean speed probabilities for multiple possible height–mass profiles for male swimming events from 50 to 1500 m. At each point of coordinates (height and mass), the corresponding probability distribution of speed from the regression model is summarised by its mean and displayed as a colour gradient on the graph. (B) Heat map of mean speed probabilities for multiple possible height–mass profiles for male swimming events from 50 to 1500m. At each point of coordinates (height and mass), the corresponding probability distribution of speed from the regression model is summarised by its mean and displayed as a colour gradient on the graph.
As mentioned earlier, figure 2A,B represents, respectively, for men and women, a heat map of mean speed for all race distances and all the height–mass couples. For each height on the x-axis and mass on the y-axis, the mean of the speed distribution is plotted according to a colour gradient. The green part of each graph indicates morphologies that are associated with a higher speed, while red portions express a lower speed. Note that speed is expressed in m/s, and even if the differences seem slight, the 0.04 m/s gap of speed between red and green on male 1500 m leads to a distance of 36 m at the end of a race that lasts about 15 min. In other words, the best suited morphology increases speed of 2.5% compared with the worst suited morphology, for male 1500 m. More generally, the approximate gain of speed due to morphology lies between 0.7% and 3.0% for men and between 1% and 6% for women, depending on the race distance. One can see on figure 2A for male swimmers that the profile tall and heavy seem associated with a higher speed for sprint distances and gradually switch as distance increases. If height remains favourable, one can see that an excessive mass is associated with a lower speed from 100 m and even more so when the distance increases. For female swimmers, trends slightly differ. From 50 to 200 m races, no matter the mass, a high height is associated with a higher speed. Moreover, the same switching pattern appears from 400 to 1500 m, with a beneficial profile that one could call tall and light.
Effect of BMI on speed
Throughout the analysis, BMI was considered separately as a unique predictor of another Bayesian regression model. Contrary to previous results, the posterior distribution of coefficients and speed exhibit moderate trends and are much more complicated to analyse. Every 95% credible intervals for the slope b crosses 0, and posterior probability distributions for different height–mass couples almost superimpose each other.
Discussion
This study shows that elite swimmers have morphological parameters structurally organised, depending on event and gender. Moreover, this is the first study to estimate the probability to swim faster in relation to morphological characteristics for all distances and gender. Results of this study emphasise the relevancy of height and mass as a key determinant (from 0.7% to 6% speed differences) of swimming performance, in relation to physiological and biomechanical factors. The main findings of this study are as follows: (1) taller freestyle swimmers have a higher probability to swim faster, for all distances and genders; (2) for sprinters, a larger mass is an advantage, whereas (3) distance swimmers need to be lighter.
Effect of height
It has been shown that speed increases with height. A taller swimmer will have a better probability to win than a shorter swimmer. Although such a relation was already known,22 24 the present paper gives a quantification of this probability and the strength of the effect for each distance and gender (figures 1, 2A and B). The length of the lower and upper limbs leads to a reduction of the drag coefficient9 and implies a larger arm span.10 In swimming, taller athletes take advantage of turns and underwater phases.8 25
Effect of mass
On short distances, mass is a beneficial feature because of the substantial contribution of anaerobic power, which is enhanced by a significant muscular mass.26 During long-distance events, swimmers seem lighter as shown by Khosla.24 The matter of reducing passive drag to improve swimming efficiency increases with the distance. It is also known that leg work is less important for these events,27 and one can assume that lower limbs are lighter for distance swimmers. Those benefits, in terms of energy cost, were already described for distance events in athletics.28
Effect of BMI
BMI was identified as a relevant performance indicator in athletics,17 but poor results were observed in our study. Various hypotheses could be at the origin of the differences of BMI importance in reaching a speed among tracks and swimming. First, it is possible that BMI was not useful in our study because of the absence of phenotypical gradients as a function of measured distance, unlike what has been shown in athletics.17 BMI remained more associated with distance running performance than with swimming performance. One other explanation could reside in a hierarchical impact of BMI among the range of sport subject from gravity to Archimedean buoyant force. Indeed in all track and field events, BMI appears as a relevant indicator, and a consistent trend of increasing BMI with speed was observed.17 In rowing, the relationship between speed and BMI is less clear and obvious. In swimming, Archimedean buoyant force associated with drag coefficient, underwater currents, passive drag, energy cost and swimming efficiency complicates the understanding of relationships.
Effect of gender
Results of the study reveal similar trends for men and women. However, although mass was found to be a major determinant for male sprinters, its influence seems less clear for female sprinters. First, male swimmers have generally more muscle mass than female swimmers on short distances, whereas maximisation of anaerobic metabolism, mainly involved in the total energy requirements in sprint, increases with muscle mass.26 Then, because of professional swimsuits, women have a better buoyancy than men since the swimsuit covers a larger part of their body. The advantage of wearing a swimsuit29 might allow women with more muscle mass to sustain the effort on middle distance, while it would be more complicated for men.
Morphological profiles
Depending on the race distance, beneficial morphological profiles were highlighted. Through several analyses of biometric parameters such as body mass and height, some authors offered a new understanding on an elite athlete’s body composition to realise optimal performance.17 18 Results observed in athletics and swimming appear to be different. In swimming, the optimal body mass is determined by other parameters, such as underwater phases, turns and passive drag.9 Kinematics on stroke length and stroke rate greatly differ between swimming and track and field events.26 Aquatic conditions seem to imply other trends on biomechanics. Investigating body size reveals that height is the most influential performance indicator across the full continuum of event. Moreover, other physical factors such as length of the upper extremities and body posture30 may enable a more efficient gliding on the water.25Consequently, this would impact the drag coefficient,6 underwater currents,7 8 energy cost, and swimming efficiency10 or technique.30
Alternative models in related contexts
There exist some other models in the literature to study relationships between morphology and performance. For example, the multiplicative allometric model used in several papers31–33 aims at predicting the personal best speed of a swimmer from a various set of variables (such as age, morphology and limb lengths). Such an approach allows introduction of non-linearity into the model, which is useful for studying complex and multifactorial phenomena like performance. However, in our study, the statistical model was chosen to describe and quantify the influence of morphotypes of elite swimmers on performance, without prediction aim. For descriptive purposes on a short interval of height and mass values, a linear model remains the best trade-off between goodness of fit and interpretability while avoiding the pitfall of overfitting.
Limits
To our knowledge, since no previous Bayesian analysis studying this problem exists, the prior distributions chosen were less informative. A major advantage of the Bayesian framework is its ability to take into account prior knowledge or experts' beliefs, which was not the case here. However, this work can now serve as a starting point for further analysis. Using present posterior probability results as prior distributions to study new data in this context would act as an update and would combine naturally findings of the present study with future outcomes. Future studies including other strokes and age-group swimmers should be investigated in association with other factors contributing to swimming performance. It may provide new insights about relationships between morphology and physiology or biomechanics, for example. Furthermore, it would be interesting to see if the morphological profiles have changed over the past 20 years, while world records were regularly broken and swimsuits rules have changed during our study period.
Conclusion
This study describes impact of morphology on elite swimmers' performances. Indicators such as height and mass can provide physique profiles, influential on speed in swimming events. These results highlight that height is positively associated with speed. For male sprinters, higher mass is also correlated with higher speed. However, an excessive mass is associated with a lower speed from 100 m and more and more as the distance increases. This morphological organisation has to be linked with other factors contributing to performance, such as physiological, technical and psychological determinants. With these insights into the optimal morphological profiles of elite swimmers, coaches can better assess swimmers' physical capacities and offer training programmes tailored to their potential. Sprinters will need more muscular power to improve their start while long-distance swimmers will need to reduce their water resistance to save energy.
Acknowledgments
This research was aided by the French Ministry of Sport and did not receive any material support.
References
Footnotes
Twitter @RobiinRoad
Contributors AL, AS and J-FT conceived the idea. AL developed the theory and performed the computations. FK, MB and RM helped with the data collection and the statistical analysis. AS encouraged RP to investigate the findings of this work. RP took the lead in the manuscript and was helped by PH to supervise in the Introduction and Discussion sections. AL wrote the Methods and Results sections. J-FT and AS supervised the project. RP and AL discussed the research direction. All authors discussed the results and commented on the manuscript.
Funding The authors have not declared a specific grant for this research from any funding agency in the public, commercial or not-for-profit sectors.
Competing interests None declared.
Patient consent for publication Not required.
Provenance and peer review Not commissioned; externally peer reviewed.
Data availability statement Data are available upon reasonable request.