Article Text

Abstract
Objectives To explore associations betweenexercise dependence, eating disorder (ED) symptoms and biomarkers of Relative Energy Deficiency in Sports (RED-S) among male endurance athletes.
Methods Fifty-three healthy well-trained male cyclists, triathletes and long-distance runners recruited from regional competitive sports clubs were included in this cross-sectional study. The protocol comprised the Exercise Dependence Scale (EXDS), the ED Examination Questionnaire (EDE-Q), measurements of body composition, resting metabolic rate, energy intake and expenditure and blood analysis of hormones and glucose.
Results Participants with higher EXDS score displayed a more negative energy balance compared with subjects with lower EXDS score (p<0.01). EXDS total score was positively correlated with EDE-Q global score (r=0.41, p<0.05) and the subscale score for restraint eating (r=0.34, p<0.05) and weight concern (r=0.35, p<0.05). EXDS total score and the subscales lack of control and tolerance were positively correlated with cortisol (r=0.38, p<0.01, r=0.39, p<0.01 and r=0.29, p<0.05, respectively). The EXDS subscales withdrawal and tolerance were negatively correlated with fasting blood glucose (r=−0.31 and r=−0.32, p<0.05, respectively), while intention effect was negatively correlated with testosterone:cortisol ratio (r=−0.29, p<0.05) and positively correlated with cortisol:insulin ratio (r=0.33, p<0.05).
Conclusion In this sample of healthy male athletes, we found associations between higher EXDS scores, ED symptoms and biomarkers of RED-S, such as a more pronounced negative energy balance and higher cortisol levels.
- relative energy deficiency
- compulsive exercise
- exercise addiction
- disordered eating
- low energy availability
This is an open access article distributed in accordance with the Creative Commons Attribution Non Commercial (CC BY-NC 4.0) license, which permits others to distribute, remix, adapt, build upon this work non-commercially, and license their derivative works on different terms, provided the original work is properly cited, appropriate credit is given, any changes made indicated, and the use is non-commercial. See: http://creativecommons.org/licenses/by-nc/4.0/.
Statistics from Altmetric.com
- relative energy deficiency
- compulsive exercise
- exercise addiction
- disordered eating
- low energy availability
What are the new findings?
Exercise dependence was positively associated with eating disorder (ED) symptoms in this understudied group of male athletes.
In this first study to investigate associations between exercise dependence and biomarkers of Relative Energy Deficiency in Sports (RED-S) in male endurance athletes, higher total scores for exercise dependence were associated with a more pronounced energy deficiency and higher cortisol levels which in the long term may have both health and performance implications.
Higher subscale scores for exercise dependence were associated with lower blood glucose, lower testosterone:cortisol ratio and higher cortisol:insulin ratio, indicating a more catabolic profile.
How might it impact on clinical practice in the near future?
Health personnel, coaches and athletes should be aware that exercise dependence, with or without disordered eating behaviour, might contribute to the development of RED-S and significant health and performance complications.
When working with athletes at risk for RED-S, one should screen for the potential underlying causes, including psychological factors such as exercise dependence, to perform the optimal preventive, evaluation and treatment strategies.
Based on this first study to investigate associations between exercise dependence, ED symptoms and biomarkers of RED-S, we recommend more studies in this area, preferably including both gender representing different performance level and including injured athletes.
Background
Exercise dependence (EXD; also called exercise addiction and compulsive exercise) is characterised by a craving for physical training, uncontrollable excessive exercise behaviour with inability to reduce exercise amounts and potential harmful consequences, such as injuries, impaired social relations and depression.1 2 The condition is often associated with eating disorder (ED) pathology and perfectionism among women.3–5 Whether an association between EXD and ED symptoms among healthy male endurance athletes exists is less known.
Athletes in weight sensitive or leanness demanding sports have an increased risk for developing Relative Energy Deficiency in Sport (RED-S), a syndrome of negative health and performance aspects related to low energy availability (LEA) with or without disordered eating (DE) behaviour or ED.6 Most research investigating RED-S have been conducted in female athletes.7 8 In male athletes, reduced testosterone levels have been reported after 5 days of severe energy deficit,9 as well as after 6 months of endurance running.10 After 54 hours with extreme exercise energy expenditure (EEE) testosterone, insulin-like growth factor 1 (IGF-1) and leptin have been reported to be significantly suppressed in male ultraendurance cyclists with changes in IGF-1 being positively correlated with energy balance.11 Besides suppressed IGF-1 and testosterone, lowered tri-iodothyronine (T3) and insulin and increased cortisol and cholesterol levels have been reported among exercising men experimentally exposed to LEA,9 12 13 and LEA has been associated with lower testosterone levels in elite male endurance athletes.14 In addition to the likely performance degradation, it is well recognised that the suppression of these metabolic hormones secondary to prolonged LEA is associated also with unfavourable health outcomes.6 7 15 16
It has been stated that psychological stress and/or depression can result in or be the underlying cause of LEA,6 and researchers have recently encouraged to investigate the relationship between EXD and RED-S, since athletes with a propensity to EXD may be at greater risk of RED-S.17 However, studies investigating links between EXD and objective markers of LEA, such as increased cortisol and suppressed resting metabolic rate (RMR) and testosterone, are lacking. Furthermore, it is important to investigate whether there is a relationship between EXD and ED symptoms in male endurance athletes, as this may have implications for how to screen for and manage psychological risk factors for RED-S. Therefore, the main aims of this study were to investigate possible associations between (1) EXD and ED symptoms and (2) EXD and biomarkers of RED-S among well-trained healthy male endurance athletes. We hypothesised that male athletes reporting higher levels of EXD would show a higher prevalence of ED symptoms and biomarkers of RED-S compared with male athletes reporting lower levels of EXD.
Methods
Study design and participants
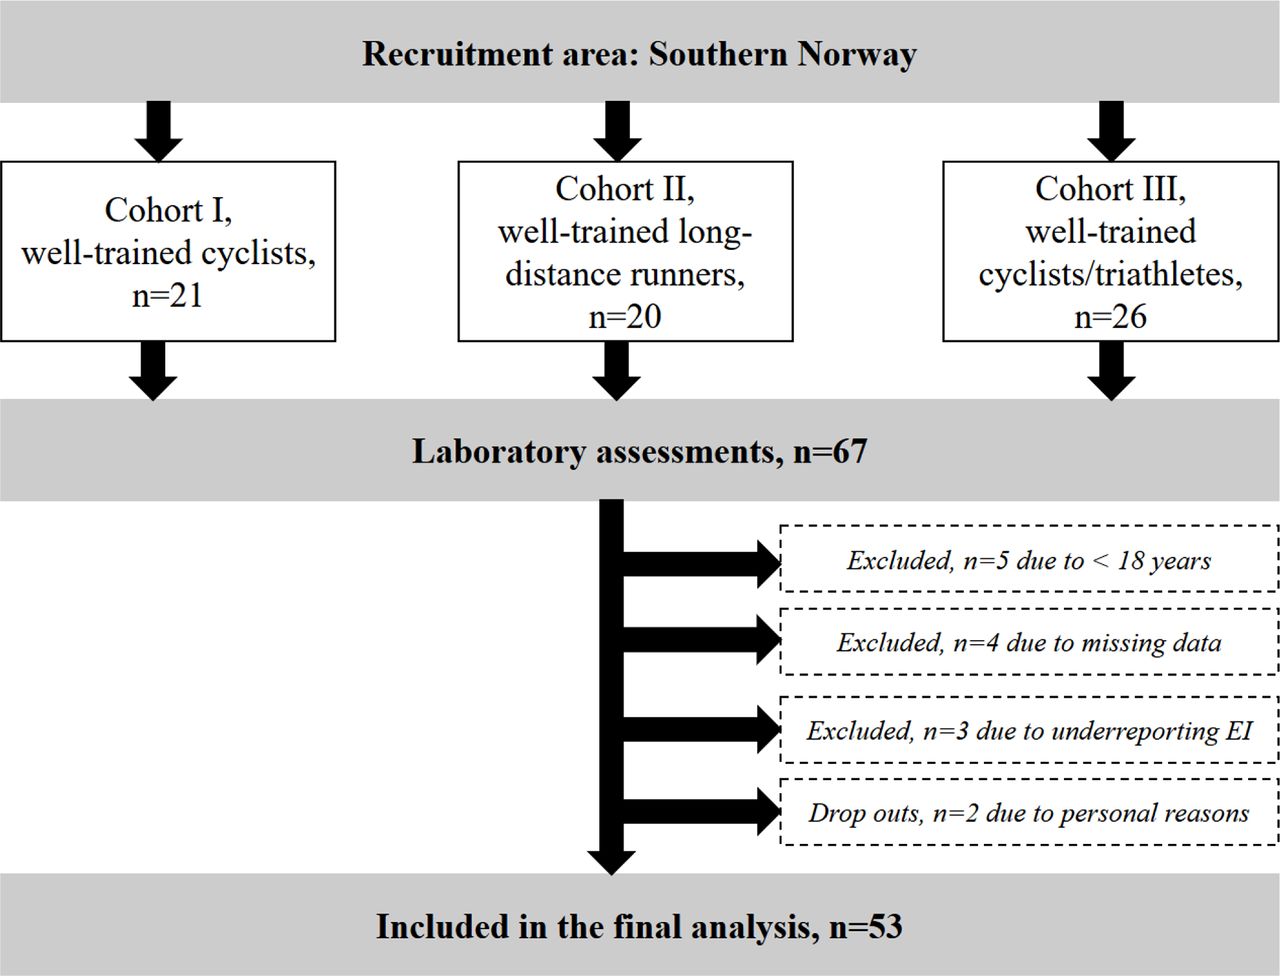
The participants and methods used in this cross-sectional study have earlier been described in detail,18 but briefly 67 male cyclists, triathletes and long-distance runners were recruited to the study through local sport clubs and social media in three phases (figure 1). The reason for dividing the athletes into three different cohorts were mainly due to limited access to the laboratory and test personnel. In addition, we aimed for including the athletes in their postcompetition period that differed between the cyclists and the long-distance runners. Inclusion criteria were male, 18–50 years old, competing in a demanding endurance sport, maximal oxygen uptake (VO2max) >55 mL/kg/min, training frequency ≥four sessions/week the previous year and competing at a regional or national level. Since these athletes were part of an intervention study, they also had to be disease and injury free. Thirteen participants were excluded leaving a total of 53 subjects (16 runners, 32 cyclists and 5 triathletes) in the final data analysis (figure 1). All subjects were categorised as well trained19 or at performance level four.20
Flow chart showing the recruitment process and exclusion of participants. EI, energy intake.
All subjects gave their verbal and written informed consent before study participation.
Measures
The data collection was performed during four non-consecutive days, followed by three or four consecutive days of food and exercise registration. The participants were told to arrive in a fasted state on days 2–4, refrain from using products containing tobacco and caffeine, not to engage in more than 1 hour of low intensity exercise the day before testing and strength training was prohibited.
On day 1, body height (Seca Optima, Seca, UK) and body weight (InBody 720, Biospace, Seoul, Korea) were measured, and the participants performed an incremental test to exhaustion to determine VO2max. On day 2, RMR was measured, and the participants received instructions on how to record their energy intake and expenditure and they completed questionnaires. On day 3 and 4, blood samples were drawn, and body composition was assessed using Dual-energy X-ray absorptiometry (GE- Lunar Prodigy, Madison, Wisconsin, USA).
Exercise and eating behaviour
The Exercise Dependence Scale (EXDS) was used to assess symptoms of EXD.21 This 21-item scale operationalises EXD based on the Diagnostic and Statistical Manual of Mental Disorder IV22 criteria for substance dependence and consists of the subscales tolerance, withdrawal, intention effect, lack of control, time, reduction in other activities and continuance. Each question is ranged on a 6-point Likert scale from ‘newer’ to ‘always’. Since this was a group of healthy athletes with absence of disease and injuries, and with fewer participants compared with previous studies using EXDS,21 23 we did not expect to find a sufficient number of ‘at risk’ subjects to be able to group them based on the cut-off suggested by Hausenblas and Downs.21 Therefore, the subjects were divided into ‘lower EXDS score’ or ‘higher EXDS score’ based on the mean EXDS total score for the group.
ED symptoms were assessed using the Eating Disorder Examination Questionnaire (EDE-Q),24 a 28-item measure of ED psychopathology ranged on a 6-point Likert scale. The EDE-Q assesses the frequency or severity of core ED symptoms and related behaviours and beliefs over the past 28 days. The instrument comprises four subscales: restraint, eating concern, shape concern and weight concern. In the present study, a mean total EDE-Q score of 2.3 or more indicated ED pathology, as recommended by Müller et al.5 The EDE-Q was only distributed to the athletes included in cohorts II and III, where 34 athletes answered the EDE-Q satisfactorily.
Resting metabolic rate
RMR was measured by ventilated hood (Oxycon Pro, Eric Jeager, Germany) according to standardised laboratory proceedings18 and assessed using the Weir equation25: (3.94 (VO2)+1.1 (VCO2))×1.44. To calculate the ratio between measured RMR and predicted RMR, the Cunningham equation26 was used. Subjects with an RMRratio<0.90 were categorised as having low RMR.27
Energy availability (EA), energy intake and energy expenditure
Participants registered their energy intake using a digital kitchen scale during a period of 3 or 4 days in their home environment mirroring their typical food patterns and training regime and logged their food records using software from Dietist Net (Dietist Net, Kost och Näringsdata, Bromma, Sweden). For measurements of EEE, the subjects recorded all training sessions with their heart rate monitor (Polar M400/V800) during the same period as energy intake was registered. The records were obtained as epochs of 5 s during every training session. EEE was calculated from such recordings, using the validated equations described by Crouter et al 28: EEE (kcal/kg/min)=((5.95*HRaS) + (0.23*age) + (84*1)–134)/4186.8 where HRaS=Heart rate (HR) above sleeping HR (beats/min) and age in years. Sleeping HR was estimated from a resting supine measurement of HR during the RMR measurement, as previously reported28 and defined as: sleep HR=0.83 * supine HR.
EA was calculated by subtracting EEE from the daily energy intake, calculated relative to fat free mass (FFM).29 In order not to underestimate EA, EEE only represented the energy attributable to training. RMR was therefore subtracted from EEE before being used in the equation for EA. LEA was defined as EA <30 kcal/kg FFM/day, since this cut-off has previously been used for male athletes.14
Blood sampling
Fasting blood samples were taken according to standardised laboratorial procedures drawn by a qualified biotechnician. Blood samples from cohort I were analysed at Hormonlabor C831, Bern, Switzerland, and blood samples from cohorts II and III were analysed at Sørlandets Hospital in Kristiansand and Aker Hormonlab in Oslo, Norway. Reference values were defined based on the Norwegian laboratories standards: cortisol (138–690 mmol/L); testosterone (18–40 years: 7.2–24 nmol/L; >41 years: 4.6–24 nmol/L); T3 (1.2–2.7 nmol/L); IGF-1 (19–30 years: 17–63 nmol/L; 31–54 years: 11–40 nmol/L); insulin (<160 pmol/L); and glucose (4–6 mmol/L).
Statistical analysis
Statistical calculations were performed using STATA V.14.2 with a two-tailed significance level of <0.05. All data sets were tested for normality and homogeneity of variance before statistical hypothesis tests were performed. Normally distributed data were summarised as mean±SD, and non-normally distributed data as median and IQR (IQ 25 and IQ 75 percentiles). An independent t-test was used to compare groups on normal distributed variables, while a Mann-Whitney U test was used to compare groups on non-normal distributed variables. Correlations between variables were calculated using Pearson’s r for normal distributed data and Spearman’s rho for non-normal distributed data.
Results
Characteristics of participants with lower and higher EXDS score
Subjects with a higher EXDS score exercised more hours per week compared with those with lower EXDS score (=0.006). There were no differences between the groups in other physiological measures (table 1).
Physiological characteristics and mean scores on the Exercise Dependence Scale (EXDS) for subjects with lower and higher exercise dependence
There were no differences in number of acute injuries (0.22±0.42 vs 0.24±0.58, p=0.868), overload injuries (0.25±0.55 vs 0.57±0.75, p=0.126) or number of days in absence from training due to illness (0.87±1.79 days vs 1.86±2.84 days, p=0.150) during the last 6 months between subjects with higher vs lower EXDS score, respectively.
The EXDS subscale withdrawal was positively correlated with body weight (r=0.32, p<0.01) and FFM (r=0.32, p<0.01). Lack of control was positively correlated with age (r=0.35, p<0.01), active years in sport (r=0.38, p<0.01) and cortisol levels (r=0.39, p<0.01). Continuance was positively correlated with overload injuries (r=0.47, p<0.01) and age (r=0.32, p<0.05). Tolerance was positively correlated with exercise hours per week (r=0.37, p<0.01) and total energy expenditure (r=−0.31, p<0.05). Time was positively correlated with number of acute injuries (r=0.33, p<0.05), exercise hours per week (r=0.55, p<0.01) and VO2peak (r=0.30, <0.05).
ED symptoms
One subject in the group with higher EXDS score had an EDE-Q global score of ≥2.3, and there was a tendency towards higher EDE-Q global score as well as shape and weight concern among subjects with higher EXDS score compared with subjects with lower EXDS score (table 2).
Eating Disorder Examination Questionnaire (EDE-Q) scores for subjects with lower and higher exercise dependence
EXDS total score was positively correlated with EDE-Q global score (r=0.41, p<0.05) and the subscale score for restraint (r=0.34, p<0.05) and weight concern (r=0.35, p<0.05). Reduction in other activities was positively correlated with EDE-Q global score (r=0.40, p<0.05). Intention effects was positively associated with EDE-Q global score (r=0.49, p<0.01) and the subscale scores for restraint (r=0.58, p<0.01), eating concern (r=0.46, p<0.01), shape concern (r=0.38, P<0.05) and weight concern (r=0.40, p<0.05).
Dietary characteristics and energy expenditure
Subjects with higher EXDS score had higher EEE, lower energy balance and a trend towards lower EA, compared with subjects with lower EXDS score (table 3). Otherwise no differences in energy or macronutrient intake between the groups were observed.
Dietary characteristics and energy expenditure for subjects with lower and higher exercise dependence
The EXDS subscales withdrawal and intention effect were negatively correlated with energy balance (r=−0.34, p<0.05 and r=−0.27, p<0.01, respectively).
Biomarkers of RED-S
Low RMRratio was found in 72% of the participants with no difference between the groups (table 4). Three of the subjects with higher EXDS total score had elevated cortisol levels, and 50% of those with higher EXDS score had cortisol levels above the highest quartile of reference range (table 4). All subjects had testosterone values above the lowest quartile of reference range, and T3, blood glucose and IGF-1 levels within the normal range. Beside higher cortisol levels in the group with higher EXDS score, no differences in any other blood biomarkers were found between groups (table 4).
Markers of energy deficiency for subjects with lower and higher exercise dependence.
EXDS total score and the subscales lack of control and tolerance were positively correlated with cortisol (r=0.38, p<0.01; r=0.39, p<0.01 and r=0.29, p<0.05, respectively). The EXDS subscales withdrawal and tolerance were negatively correlated with fasting blood glucose (r=−0.31 and r=−0.32, p<0.05, respectively), while intention effect was negatively correlated with testosterone:cortisol ratio (r=−0.29, p<0.05) and positively correlated with cortisol:insulin ratio (r=0.33, P<0.05). Time was positively correlated with RMR (kcal/kg FFM) (r=0.29, p<0.05).
Discussion
Characteristics of subjects with higher EXDS score
The mean total EXDS score of 54.7 found in this group of healthy male endurance athletes was quite similar to the score of 55.8 reported in female inpatients with ED.3 Our male athletes, however, scored higher than female ED inpatients on the subscales tolerance and time indicating a need for increased exercise dose to obtain effect and a life organised around exercise. Not surprisingly, our study showed that subjects with higher EXDS score trained more (10.6 hours/week), resulting in a higher EEE compared with subjects with lower EXDS score (8.1 hours/week). However, the group with higher EXDS score did not adjust their energy intake to match the increased energy needs, thus resulting in a more negative energy balance with an increased risk of lower blood glucose and higher cortisol levels.
Low RMRratio has been suggested as a marker for LEA, at least in females,27 30 31 but the male athletes in our study with higher EXDS score did not have lower RMRratio despite a more negative energy balance. One possible explanation is indicated in the positive correlation between the subscale time and RMR as an elevated RMR has been reported in endurance athletes in at least 39 hours after the last exercise bout.32
Theories of EXD suggest that continuance is a core symptom that drives athletes to continue exercise despite illness or injuries,1 and therefore we might have found participants with EXD by including injured athletes in the study. Nevertheless, in this apparently healthy athletic group, we found associations between symptoms of EXD and LEA, cortisol and glucose levels and ED symptoms. These findings indicate that possible negative health and performance consequences of EXD may occur without the subjects being classified as ‘at-risk of EXD’ as defined by the EXDS.21 We recommend future studies to further elaborate on this possible association and also examine whether EXD may cause RED-S.
In addition, of note, when assessing markers of RED-S, such as low RMR, standardised procedure that include no training the day before the measurement is necessary. It is therefore important to be aware of the risk of non-compliance if exercise-dependent athletes are included in the sample, since absence from training can result in anxiety, concerns and distress.1 21
EXD and ED symptoms
Among the 34 subjects who completed the EDE-Q, only one person was identified with ED pathology. One possible reason for this low prevalence may be that the results are based on self-report and not clinical interview, which is seen on as the gold standard method for verifying ED among athletes.33 Our results should be interpreted with caution also due to the small number of subjects in the analysis including the EDE-Q. Nevertheless, we found that EXDS total score was positively associated with EDE global score as well as the subscales restraint and weight concern indicating that EXD may be associated with DE behaviour or ED symptoms, as also reported among women3–5 and male and female fitness instructors.34 Lichtenstein et al 1 pinpoint however that compulsive exercise and ED can exist independently from one another and that compulsive exercise can be both primary and secondary to an ED. In a study on male distance runners, compulsive exercise was associated with a high athletic identity, but not with ED psychopathology,17 emphasising that uncontrollable exercise behaviour can be motivated by other factors than a drive for a particular body weight or shape.
EXD and biomarkers of RED-S
Lower leptin, fat-adjusted leptin and free testosterone have been reported in amateur male exercisers with EXD compared with the non-EXD group.35 Although testosterone levels were within the normal range in the present study, athletes with higher EXDS score had a more pronounced negative energy balance and higher cortisol levels that may reflect an increased need to catabolise alternate body energy sources, which in the long term may have both health and performance implications.6 Furthermore, the subscales withdrawal and tolerance were negatively correlated with fasting blood glucose, while intention effect was negatively correlated with testosterone:cortisol ratio and positively correlated with cortisol:insulin ratio, which may have implications for performance due to an enhanced proteolysis.36
Strengths and limitations of this study
This is the first study to simultaneously investigate associations between EXD, ED symptoms and biomarkers of RED-S in male endurance athletes. Other strengths are inclusion of expanded assessment measures compared with previous research, the use of valid outcome measures and that all tests followed best practice measurements protocols. Taken into consideration the several physiological laboratory measurements of biomarkers of RED-S, the number of participants was relatively high.
Limitations of this study include the cross-sectional study design limiting assertions of causality, the possibility that some subjects may have under-reported their exercise and eating behaviours and that the several EXDS subscales lead to a high number of correlation analysis, which may increase the risk of type 1 error. In addition, retrospective recall of injury and time loss from training can result in recall bias, only 64% of the athletes answered the EDE-Q and the blood analysis were performed at two different laboratories, which also are limitations to this study. The physiological relevant threshold of LEA in men requires further investigation,7 and therefore the applied cut-off used in this study is hypothetical.
Conclusions
This study found that in a group of healthy male endurance athletes, higher EXD scores were positively associated with ED symptoms, a more pronounced negative energy balance and higher cortisol levels. Additionally, higher subscale scores for EXD were associated with lower blood glucose, lower testosterone:cortisol ratio and higher cortisol:insulin ratio, indicative of a more catabolic state with potential negative effects on body composition and athletic performance.36 The recommended treatment of LEA involves an increase in energy intake, reduction in energy exercise expenditure or a combination of both.7 Therefore, more studies are needed to elucidate the relationship between EXD, ED symptoms and RED-S as all potential causes for the syndrome needs to be identified to ensure prevention, early identification of athletes at risk and to provide differentiated and targeted treatment strategies.
Acknowledgments
We would like to thank Øystein Sylta for his contribution related to recruitment of athletes and for assisting in parts of the data collection. We would also like to thank the athletes for their cooperation and for participating in this study.
References
Footnotes
Contributors MKT, AKM and TBS planned and initiated the main study. AKM, MBL and ILF performed the statistical analyses, and TBS was responsible for the methodological part. MKT and ILF drafted the manuscript. All authors critically revised the manuscript.
Funding The costs were covered by the University of Agder.
Competing interests None declared.
Patient consent for publication Not required.
Ethics approval Permission to undertake the study was granted by the University Faculty Ethics Committee and the Norwegian Data Protection Official for Research.
Provenance and peer review Not commissioned; externally peer reviewed.