Article Text

Abstract
Aim Using M-Rex, a rugby scrum simulator, we developed tools to describe scrummaging forces and to prevent accident.
Methods We tested three groups of frontliners at national level. The simulator was passive or responded to the player(s) to simulate the reaction of opposite players. Sensors in the beam measured the force exerted by each of the players. Their movements were recorded with a Codamotion system.
Results The force signals exhibited two phases: a transient phase, similar to a damped sinusoid with a dominant frequency around 5 Hz when the players scrummaged alone and with a wider range when playing together; then, a sustained phase could be decomposed in two components: a DC component remained stable whether frontliners played alone or together. In contrast, its variability decreased when the frontliners played together compared with when they played alone. As for the oscillations, the frontliners exhibited a large variability in their ability to synchronise their efforts during the sustained phase. The synchronisation between the hooker and the props was quite efficient, while it was always missing between two props. Finally, we were able to study postural readjustments and their synchronisation among players during the sustained phase.
Conclusion This study shows that by using adequate methods, it is possible to assess the frontline collective intelligence. These findings may pave the way for innovative methods of training to improve players’ collective behaviour.
- rugby
- innovative methods
- training
- collaborative intelligence
This is an open access article distributed in accordance with the Creative Commons Attribution Non Commercial (CC BY-NC 4.0) license, which permits others to distribute, remix, adapt, build upon this work non-commercially, and license their derivative works on different terms, provided the original work is properly cited, appropriate credit is given, any changes made indicated, and the use is non-commercial. See: http://creativecommons.org/licenses/by-nc/4.0/
Statistics from Altmetric.com
What are the new findings?
In this study, we investigated kinematics activities of high-level frontline players during their initial engagement and during the ensuing sustained push, when scrummaging with M-Rex, a scrum simulator we designed. Our results confirm that the force signals exerted by the players exhibited two phases, a transient and a sustained phase.
The transient phase, just after the impact, was composed of two or three peaks similar to a damped sinusoid with a dominant frequency concentrated between 4 and 5 Hz when the players played alone and in a wider range when they played together.
The sustained phase could be decomposed in a DC component and an oscillatory component. The DC component was stable whether players played alone or together. When a player engaged with other players, the variability of the compression forces decreased compared with when he was playing alone. As for the oscillations, the frontliners exhibited a large variability in their ability to synchronise their efforts during the sustained phase. The synchronisation between the hooker and the props was quite efficient, while it was always missing between two props.
Finally, we were able to study postural readjustments and their synchronisation among players during the sustained phase.
How might it impact on clinical practice in the near future?
This study shows that by using adequate methods and mathematical tools, it is possible to assess the frontline collective intelligence.
These findings may pave the way for innovative methods of training to improve rugby players collective behaviour during the scrum.
Introduction
The scrum is a full contact, collective and complex event that occurs during a relatively small period of game time in the Rugby union. Its intensity makes it a major cause of injury in rugby unions. Preventing accidents while increasing collective performance of a pack requires a deeper understanding of the mechanisms involved in scrummaging, which was first studied by Milburn.1 They studied how anthropometric characteristics and physical performance attributes allow players to best meet the demand according to their positions in the pack.2–4 Preatoni 5 investigated machine scrummaging at different playing levels in rugby union and analysed kinetic factors that might influence performance and injury risk. Preatoni and Cazzola6–9 have shown that, irrespective of the playing level, reducing the dynamics of the initial engagement through a fold-in procedure decreased the peak compression force, the peak downward force and the engagement speed in excess of 30%. This reduces the mechanical stresses acting on forward players and the hazard factors inducing chronic degeneration of the spine. However, Cazzola 8 showed that the ability to generate a sustained force after the initial engagement is not decreased using the new ‘PreBind’ technique of engagement.
The collective performance during scrums was studied by Quarrie and Wilson,4 who investigated the relationship between the sum of individual scrummaging forces and the team scrummaging force, for various packs. They found no significant relationship, which emphasises the importance of technique and coordination among the members of the scrum pack to efficiently combine their forces.
Altogether then, the scrum is a remarkable model for the study of collective intelligence during sensorimotor tasks. In that context, we have designed with Thales and the Fédération Française de Rugby (FFR) a new kind of rugby scrum simulator, the M-Rex. Initially developed to analyse the risk of scrum accidents and to improve players safety, it turned out to be a valuable tool for training/coaching the packs of the national teams and to study collective sensorimotor intelligence. In a first study,10 we have shown that anticipatory postural adjustments (APAs) should be tested in highlevel rugby players and probably also in any high-level sport men at risk of neck and back injuries. Being the fact that recent studies had shown that APAs can be efficiently trained, our study also paved the way to design individual position-specific injury prevention programme taking into account the player’s APAs characteristics and his/her previous injuries. In the present study, we studied the kinematics activities of high-level frontline players during their initial engagement and during the ensuing sustained push, when scrummaging with M-Rex.
Methods
Participants and the M-Rex simulator
All data collections were recorded at the FFR’s Centre national du rugby at Linas-Marcoussis (Essonne) during the regular training programme of the French national team. Nine frontline players from the ‘Pôles Espoirs Masculin’ (mean s: height=1.75±0.05 m, mass=85.6±10 kg, age=20±3 years) participated in the data record. All participants provided written informed consent and all procedures were approved by the FFR, which abides with the declaration of Helsinki. We tested three groups of three players, who used to play together as frontliners at the national level.
The M-Rex scrum simulator is a robot equipped with force sensors that reproduces the interplay of a scrum situation. See http://onboard.thalesgroup.com/2015/09/23/rugby-world-cup-new-kind-coach.
Experimental protocol
The simulator was passive and then it responded to the player(s) push by an opposite and continuous force in order to simulate the reaction of the scrum’s opposite players. A perturbation was applied randomly at 0.5 s, 1.5 s and 2.5 s after the engagement. It displayed a rectangular profile of 2 KN for 10 s and was randomly oriented, either frontward or upward or sideways. The force sensors integrated in the beam simultaneously measured the force exerted by each of the three players. These signals were sampled at 200 Hz. The simulator triggered the Codamotion to start recordings.
The Codamotion system (Coda CX1 Units) is an active 3D motion tracking system (Charnwood Dynamics Ltd. Rothley, Leicester). Fifteen markers placed on each player’s body were detected by three Coda CX1 units placed on tripods in the training facility to cover the scrumming range. The system’s ‘x axis’ was defined as the direction of the players engagement and the axis origin (zero point) corresponded to the initial position of the hooker player (middle position). Each recording lasted 20 s at 100 Hz. The signals were processed with Matlab routines.
Data processing
Smooth/oscillatory decomposition
We decomposed the force signal into two components, namely, a smooth component and an oscillatory component. The former was obtained through a median filtering, whose principle is to replace each sample by the median value of the 2M+1 samples around it, where M=500. The oscillatory part is given by the difference between the signal and its smooth part.
Correlation
Given two discrete stationary signals x and y, the intercorrelation coefficient between x and y is given by:
 (1)
(1)
where E denotes the mean value (mathematical expectation) and V the SD. The intercorrelation coefficient Vxy(k) indicates how similar are x and y delayed of k.
Period and dominant frequency estimation
The autocorrelation exhibits a maximum at zero and local maxima at times multiple of the period. The second local maximum after Vx(0) then corresponds to the period. Hence, denoting by Fs the sampling frequency, the estimated period is given by:
 (2)
(2)
The dominant frequency is defined as the inverse of the estimated period.
Inter-correlogram
For non-stationary signals, however, the intercorrelation coefficient is bivariate:
 (3)
(3)
It measures how similar x at time nx and y at time ny.
We define the inter-correlogram of two signals x and y as a matrix indexed by discrete times nx and ny, containing the values of intercorrelation Vxy(nx, ny), where the mathematical expectations in Equation (2) are replaced by their estimates on short segments around nx and ny.
Desynchronisation indices
We propose to measure the synchronisation indicated by the inter-correlogram through the distance between the diagonal of the intercorrelation matrix and the closer local maximum in each column of the matrix. Denoting by Vxy(t) this local delay between two signals x and y, we propose as global desynchronisation measures the mean and SD of |Vxy(t)| within a duration T, respectively:

 (4)
(4)
where NT denotes the number of columns of the inter-correlogram for the duration T.
Probability of co-occurrence of foot and force events
During each experiment, players move their feet, while their forces vary. We define a foot event as a peak of the marker position which indicates that the player raised his heel. We define a force event as follows: let t1 a time when the decreasing force signal crosses the smooth component of the force; let t2 the next time when the increasing force signal crosses back the smooth component of the force; let tmin the time of the minimum force between t1 and t2; if the difference between the smooth component of the force and the force itself at time tmin is greater than a given threshold, then t1 is defined as a force event. We set the threshold at 100 n.
We computed the empirical probability density function (PDF) of occurrence of a foot event at time t+ when a force event occured at time t, denoted by P(
 ), for
  in ±220 ms. We call it force-foot co-occurrence PDF. A uniform PDF indicates no correlation between force and foot events.
Results
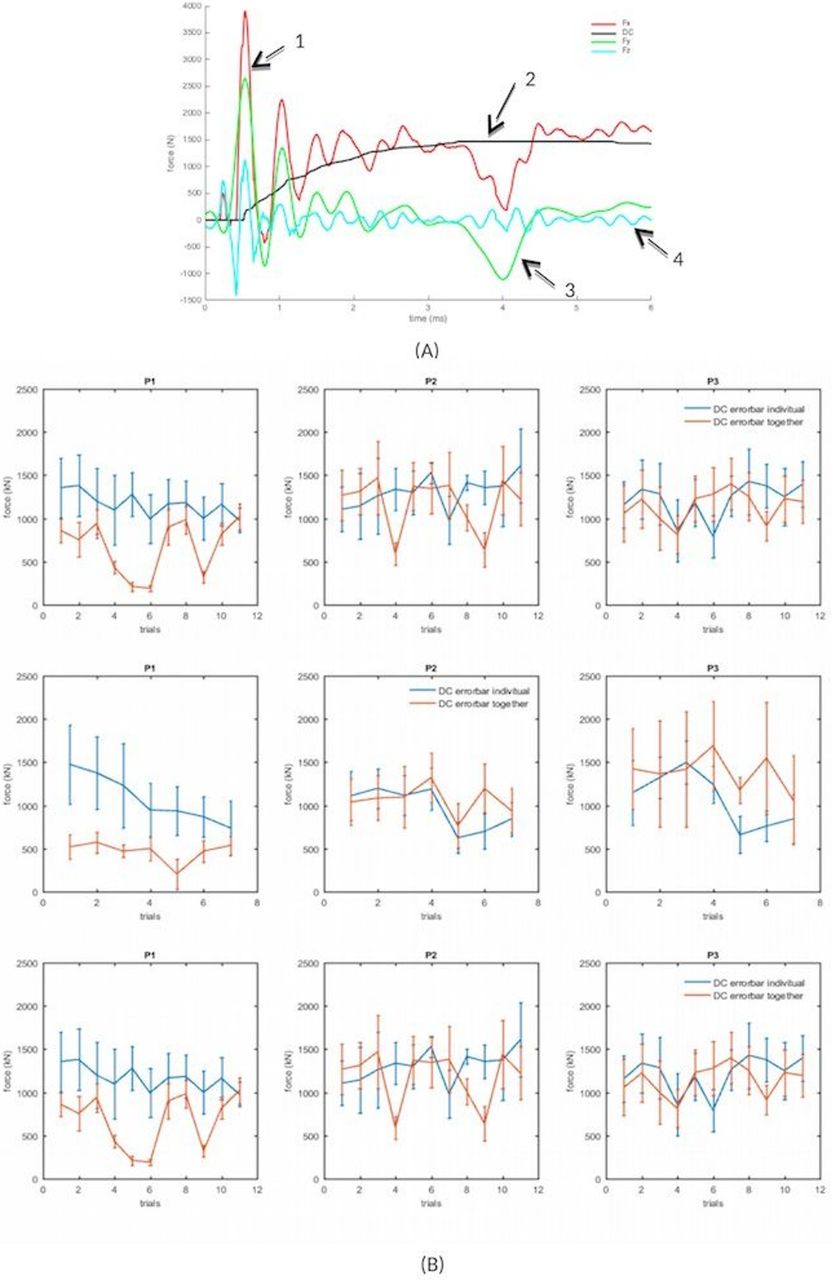
Figure 1 illustrates the force exerted during a single trial by a player of Group 1. Positive values correspond to forward, upward and rightward forces, respectively. The force signals always exhibited two phases (arrow 1 in figure 1). First, we observed a transient phase just after the impact, composed of two or three peaks, similar to a damped sinusoid. Then, the transient phase is followed by a sustained phase, with reduced oscillations. While the lateral forces (Fy, arrow 3 in figure 1) and vertical forces (Fz arrow 4 in figure 1) were centred signal (mean value zero), the force exerted in a plane parallel to the plane of sustentation (Fx arrow 1 in figure 1) displayed a DC component in addition to an oscillatory component. Thus, Fx was decomposed into a DC (arrow 2 in figure 1) and an oscillatory components. The results of this paper are based on 16 engagements for each of the three frontliners we tested. Due to the numerous technical problems encountered in the course of the recordings, however, the effective numbers of trials that we could exploit varied from block to block and for each variable we tried to quantify.

(A) Decomposition of a representative force signal into a continuous and oscillatory components. (B) Mean and SD of the DC component of the compression force during the sustained phase, for the three players left pillar, hooker, right pillar of Group 1, across successive experiments. The dotted lines represent the means and SD. The stars and squares were recorded when the players were playing alone and together, respectively.
The transient phase
The top four rows in table 1 summarise the durations and amplitudes of the transient phase of Group 1 when the three players played alone and together. When the force signal did not exhibit a peak greater than 1000 n, the transient phase was not considered as representative of an engagement and the trial was discarded. Our results show the duration was longer and the mean force smaller when the players were tested together.
First peak of the force and the intercorrelation between two players during the transient phase in Group 1 and vertical foot displacements of all groups
For each possible pair of players (hooker-right prop, hooker-left prop, left prop- right prop), we computed also the maximal intercorrelation coefficient of the transient phases over a window of 600 ms, which encompassed all peaks. It was calculated both when the pair under scrutiny played alone or together. The results are summarised in the fifth and sixth rows of table 1 (grey zone). It shows that the intercorrelation values between each payer did not vary whether playing alone or together.
Figure 2 represents the histograms of the dominant frequencies during the transient phase (left) and during the sustained phase (right), for the players of the three groups when they played alone and together. The dominant frequency is the reverse of the time-shift maximising the autocorrelation. Since this maximum is not always sharp, the dominant frequency estimation may be unreliable in some cases. Hence, only the global shape of the histograms should be considered. During the transient phase, the dominant frequency is concentrated between 4 and 5 Hz when the players played alone, while the values are in a wider range when they played together.
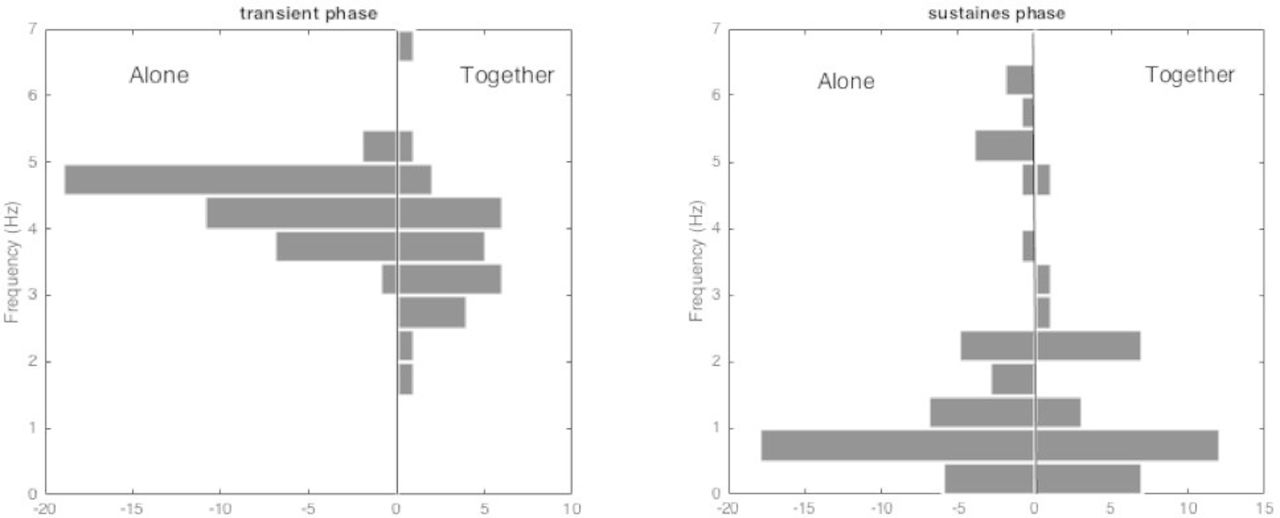
The histograms of the dominant frequency during the transient phase (left) and during the sustained phase (right), in the two cases, players alone or together.
The sustained phase
The smooth (DC) component
The first issue we wanted to address is the amount and stability of the compression force during the sustained phase. Figure 1 shows the mean and SD of the DC component for each trial of each player of each group. The force developed during each trial could be more or less stable along the trials and for the different blocks of trials
For all players and experiments of the three groups, we studied the correlation between the mean and the SD of the DC component of the compression force during the sustained phase in alone and together case. Whereas the means and SD of the forces were uncorrelated when the players played alone (correlation coefficient lower than 0.1), Fx exhibited a fair correlation (correlation coefficient 0.77) when they played together. For Fy and Fz, the correlation coefficient was low (0.03 and 0.3, respectively) even when they played together.
The oscillatory component
During the sustained phase, no difference appears between individual and collective play: the dominant frequency is mostly lower than 1 Hz, which is different from the machine’s eigen frequencies (5.4 and 9.7 Hz). It is also much lower that the oscillations observed during the transient phase.
Intercorrelation of the oscillatory components of the forces exerted by the players
To investigate further the synchronisation between players, we studied the inter-correlogram of the oscillatory components of the compressive forces they exerted when they played together. The inter-correlograms were computed before and after the mechanical disturbances imposed by the machine at random times during the sustained phase.
For one trial in Group 1, figure 3 represents the inter-correlograms of Fx calculated for the three pairs of players before (upper row) and after (lower row) the mechanical disturbance was imposed by the robot. One can observe in figure 3 that:

It represents, for one trial, the inter-correlograms of Fx calculated for the three pairs of players before (upper row) and after (lower row) the mechanical disturbance imposed by the robot. The first block diagram illustrates the inter-correlogram for the left pillar and hooker, the second block diagram illustrates the inter-correlogram for the second hooker and right pillar and the third block diagram illustrates the inter-correlogram for left and right pillar. For each block diagram, the abscissa and ordinate display the time in seconds. The darker the pixel at a given time, the more correlated the forces between the two players.
The hooker was well synchronised (though with a variable delay) with the left and right prop before the disturbance (see upper row).
The left prop and right prop were synchronised, although to a lesser extent, before the disturbance (see upper row).
These synchronisations vanished after the disturbance (see lower row and below in the text).
We computed the inter-correlogram for all possible trials of Groups 1, 2, 3 and derived from these measurements the local delays and the global desynchronisation indices. The global desynchronisation indices, illustrated in figure 4 for the three groups, are higher after than before the disturbance in most cases. They show the desynchronising influence of the postural perturbations imposed by the robot.

Global desynchronisation indices before and after disturbance, for nine front-row scrumming players separated into three groups. Each bar and error bar represent the mean and the SD of the absolute value of the local delay between two players, respectively.
Postural adjustments during the sustained phase
During each trial, we always observed foot displacements and sudden drops of the compression force exerted by the players in the sustained phase (table 1). They were not significantly different whether the players were scrummaging alone or together.
When the nine players were scrummaging alone (figure 5), the distribution had a mode between 0 and 100 ms, which indicates that the peaks of foot displacement occurred 0–100 ms after a significant decrease of force. Since the duration of foot displacement is 330 ms on average (see low four lines in table 1), we assume that the force exerted by the player started to decrease on average 65–165 ms after that the player started to raise his foot.

Force-foot co-occurrence probability density function for each group, for each player and each condition (alone/together).
When the nine players were scrummaging together, this succession of events disappeared in some cases (hooker and right prop in Group 1, left prop and right prop in Group 2), leading to an almost uniform distribution. It indicates no defined temporal relationship between foot displacements and force events.
Discussion
The sustained phase of the scrum
We confirmed the results of the study of Preatoni et al 5: the first peak lasted a very brief time but could reach very high level (see table one), in the range of values that studies on cadaveric specimens have indicated as potentially hazardous for (chronic) spine injuries. We also detected a downward oriented peak, occurring after the first peak of force, which could facilitate the collapse of the scrum, a major sources of neck injuries. In addition, we showed that the peaks of force of the transient phase were remarkably synchronised when the players played together. In contrast, their synchronisation, duration and amplitude decreased when the players engaged together. It could be related to the fact that the synchronisation of the players was difficult over a very short and high impact. Finally, in a previous study (Wang et al 2018),10 we showed that the anticipatory postural adjustments during the transient phase were highly variable, which was an additional source of potential injuries.
Altogether, these results showed that the transient phase put players at risk with the rules governing the engagement before 2013. The subsequent studies of Preatoni et al6 7, Cazzola et al8 9 demonstrated that, indeed, the rules change efficiently reduced the dynamics of the engagement and the mechanical stresses acting on forward players.
The DC component
Cazzola8 have shown that while the prebind technique, unlike previous engagement techniques, reduced biomechanical loading, there existed no significant differences between techniques in terms of body kinematics and average force exerted during the sustained push phase. In other words, the result we present here on the sustained phase are still valid, although we tested players who used 2012/2013 engagement processes (referee calls crouch-touch-set) for such was the rule at the onset of this study.
As shown in figure 1, the DC component of the force developed during each trial was very stable along the trials and remained the same whether players were on their own or played together with two other frontliners. In that regard, it contrasts with the engagement. This result tends to support the notion that the decrease observed during the engagement (when players were on their own vs when they played together) has no biomechanical origin but may be due to a double task problem. When playing together, combining a high degree of temporal coordination with an explosive force in a brief lapse of time would be more difficult for players to master than exerting together a sustained effort. In addition, the relationship between the mean and the SD of the DC component for the compression force during the sustained phase was uncorrelated when players played alone, while it exhibited a fair correlation when they played together. Two characteristics of the compression force are thus revealed. First, a player alone displayed large SD for every range of force he exerted. Second, when the same player engaged with other players, the variability of the compression forces he exerted decreased for a given level of force. Moreover, such variability increased with the level of exerted forces in an orderly fashion. From the perspective of a collective motor intelligence, these two characteristics ought to augment the overall pressure exerted on the adverse team during the scrum and facilitate the players coordination during the scrum, rendering the SD of the force they exert somewhat predictable.
Intercorrelation between the oscillatory components
We propose here a new paradigm to assess the degree of cooperation of the player during the scrum and to quantify the effect of mechanical disturbances during the sustained phase. We have shown that the frontliners exhibited a large variability in their ability to synchronise their efforts during the sustained phase. This was true for a given triplet of players and for the same triplet on a trial-to-trial basis. When players succeeded in synchronising their effort, the synchronisation between the hooker and the props was quite efficient, while it was always missing between two props.
The left /right prop pair’s poorer overall synchronisation may be explained by the relative positions of the players. However, at times, the left prop/hooker or hooker/ right prop synchronisation could be as bad as the left prop/right prop synchronisation; this may be related to the difficulty for the hooker to synchronise simultaneously with two other players. It is important to note that our synchronisation measurement tool does not define the best success factors for a pack. Indeed, while a strong synchronisation could increase the collective power in order to destabilise the opposite pack, the desynchronisation could provide interleaved rest-times for players, which could prove beneficial for a long-term effort. This second hypothesis may explain why the mean of the Fx compression force was correlated to its SD when the players play together, whereas no correlation appeared when playing alone (see figure 3): when playing together, each player may have relied on the other player to sporadically reduce their effort, which increased the SD of the force they exerted but also augmented the level of force they could exert during a long stretch of time.
The inter-correlograms were also computed before and after the mechanical disturbances imposed by the machine at random times during the sustained phase. A visual examination of the recordings showed that under such circumstances, the disturbance had some detrimental effect on frontline synchronisation. However, this was obtained only for trials where the disturbance occurred late enough, so that the signal before disturbance was long enough for us to compute relevant values of intercorrelation.
The postural readjustments during the sustained phase of the scrum
During the sustained phase of the scrum, many feet displacement occurred. When the player was alone, feet displacements induced a marked decrease of the compression force he exerted and it is not surprising that these brief episodes of unipodal stances decreased the efficacy of the player.
Feet movements always preceded the loss of force. Obviously, these feet displacement could have indicated that the player was programming a step to progress forward in his contest with the robot. It was not the case since he was instructed to maintain a maximal stable force during the sustained phase. This left us with two hypothesis. Either the player was predicting a loss of efficacy in his effort and, consequently, was optimising his posture pre-emptively or he was interrupting the isotonic muscular contractions underlying the sustained phase, which may have reached their time limits.
When players played together, the timing of feet displacements and the episodes of force decrement were uncorrelated in 45% of the trials. In other words, one of the feet could rise without provoking a subsequent loss of force exerted by the player. This observation may be seen as an outcome of collective intelligence: supporting the body on the neighbouring players compensated the detrimental effect of the transient unipodal posture. In support of that hypothesis, coincident feet displacements in adjacent players were never observed. Consequently, one could speculate that in the remaining 55% of the cases, when foot displacement did induce a force decrement, this was due to an inadequate strategy of the player. In that context, we hypothesised that the hooker could benefit from the support of both the left prop and right prop when he raised his feet. This was only the case in one of the three hooker we tested, which may be due to an inadequate training of the two other players to use two supports moving independently at the same time.
Scrum, a model to study collective intelligence
A recent paper by Sedeaud et al 11has shown that the XV de France’s collective effectiveness relies on a balance between stability and workforce renewal, which allows the building of specific position interactions and builds on skilled forwards packs. It strengthened the notion that selections and shared selections are serious collective performance parameters associated with performance.
In that context, our results demonstrated that collective intelligence exerted its effects at different phases of the scrum. The initial peaks of forces during the engagement could be synchronised when frontliners played together. Two adjacent players were also capable to synchronise their effort during the sustained phase. Finally, supporting the body on the adjacent player could compensate the detrimental effect of transient unipodal postures. But it was also clear that this collective intelligence had its drawbacks and its limits. For instance, the initial peak of force was diminished when the frontliners played together.
Conclusion
We objectivised that the transient phase put players at serious risks. The modification of the engagement rules contributed to injury prevention. Our study showed also that by using adequate methods and mathematical tools, it was possible to assess the frontline collective intelligence. It further indicates that during the different phases of the scrum, collective intelligence could be more or less pervasive depending on the frontliners tested and on trial to trials for a given triplet. These findings pave the way for innovative methods of training to improve players collective behaviour.
References
Footnotes
DW and GëlM are joint first authors.
DW and GëlM contributed equally.
Contributors DW, Research Engineer Recordings at the FFR, part of the signal processing and writer of the results section. GM, Associate Professor, supervised signal processing and processed part of the signals. JF is the Master Student, helped to process the signals by writing software. JP, head of the scientific department of the FFR, coordinator of the recording sessions at the FFR center, operator of the robot and participated in the interpretation of the data. SC, Engineer as the maker of the robot and technical supervisor to the recordings session. DR, Technical Director of the FFR in charge of the scientific programme at the FFR. SL, Professor, contributed to the data interpretation. P-PV, Research Director Head of the group, writer of the introduction and discussion section.
Competing interests None declared.
Patient consent for publication Not required.
Ethics approval CERCES.
Provenance and peer review Not commissioned; externally peer reviewed.