Article Text

Abstract
Objectives Orthopaedic surgery of the knee joint results in functional deterioration of the quadriceps femoris muscle. However, little is known about quadriceps femoris muscle dysfunction in the early postsurgical period. Therefore, we examined the stiffness of the quadriceps femoris muscle in the early postsurgical period.
Methods Seven patients and seven healthy controls performed quadriceps contraction exercises. In resting and contraction conditions, the shear modulus, muscle thickness and pennation angle were measured for the vastus medialis (VM), vastus lateralis (VL) and the rectus femoris (RF) using ultrasound elastography.
Results The shear moduli of the VM, VL and RF in the control group did not significantly interact, while the shear moduli in the patient group did show a significant interaction. In the resting condition, there was no difference between the unaffected and affected sides in the patient group, but the shear moduli of the VM and VL in the contraction condition was significantly lower on the affected side than the unaffected side.
The contraction ratios between muscles by limbs did not significantly interact. However, there were main effects due to muscle and limb factors. The VM and VL had a significantly higher contraction ratio than the RF, and the control and unaffected limbs had a higher contraction ratio than the affected limb.
Conclusion The results demonstrated a decrease in muscle stiffness during contraction in patients with quadriceps femoris dysfunction. Measurement of the shear modulus has potential as a new evaluation index and with high sensitivity to decreases in muscle contraction.
- quadriceps
- ultrasound
- knee surgery
This is an open access article distributed in accordance with the Creative Commons Attribution Non Commercial (CC BY-NC 4.0) license, which permits others to distribute, remix, adapt, build upon this work non-commercially, and license their derivative works on different terms, provided the original work is properly cited, appropriate credit is given, any changes made indicated, and the use is non-commercial. See: http://creativecommons.org/licenses/by-nc/4.0/
Statistics from Altmetric.com
Key messages
In the patients with quadriceps femoris dysfunction, the muscle stiffness was significantly lower on the affected side than the unaffected side in the contraction condition.
On the other hand, there was no difference in the muscle thickness and pennation angle between the unaffected and affected sides.
Additionally, the contraction ratio of the vastus medialis, vastus lateralis and the rectus femoris in the control, unaffected side and affected side had no significant muscle-by-limb interactions.
Measurement of the shear modulus has the potential as a new evaluation index and with high sensitivity to decreases in individual muscle contraction intensity. It can be expected to determine the characteristics of the quadriceps muscle dysfunction in response to various disease states.
Introduction
Orthopaedic surgery of the knee joint causes functional deterioration of the quadriceps femoris muscle in many patients.1–3 The quadriceps femoris muscle plays a role in knee joint stability during gait, and functional deterioration increases the stress on the affected knee. This can lead to deterioration in quality of life in patients. Therefore, it is important to focus on the function of the quadriceps femoris muscle and to address functional deterioration from an early phase.
It was reported that the neuromuscular activation and torque of the knee joint extension deteriorate after knee joint surgery.1–3 However, the measurement of these indexes is difficult in the early postsurgical period because of the limited range of motion and activity limitations. For example, patients are often instructed to restrict knee joint movement in order to avoid excessive extension stress on the repair tissue after ligament reconstruction or repair surgery. It is difficult to exert maximum muscle strength when inflammation and postoperative pain persist. In addition, the neuromuscular activation and joint torque cannot capture the contraction intensity in each head of the quadriceps femoris muscle. During rehabilitation in the early postsurgical phase, we evaluated the contraction intensity of each muscle by palpation and estimated the degree of contribution each muscle makes to the quadriceps femoris muscle. However, this is a subjective method of assessing the volume and hardness of the muscle and the differences in the constrictive timing of each head of the quadriceps femoris muscle. Quantitative contraction intensity evaluation methods are yet to be established.
Ultrasonic imaging has been used to quantitatively evaluate the hardness of soft tissue and elasticity modulus in skeletal muscle. This new technique assesses tissue stiffness by calculating the shear modulus from propagation velocity of an induced shear wave within soft tissues in vivo and can be performed using ultrasound shear-wave elastography.4 It is thought that this technique is useful for evaluation and treatment as it reflects the function of muscle contraction. Changes in stiffness are viewed in real time. Morgan et al reported a relationship between stiffness and contraction intensity of muscle and suggested that an increase in cross-bridge formation with muscle contraction is related to stiffness increase.5 In a study using ultrasound shear-wave elastography, the shear modulus had a strong linear relationship with muscle force in the pennate muscle.6–8 Therefore, ultrasound shear-wave elastography is an evaluation tool that can estimate the index of active muscle force, even in patients with limited range of motion in the early phase postsurgery. This method is simple and puts less stress on the repair tissue. In addition, this method can evaluate the shear modulus of the individual muscle heads in the quadriceps muscle that cannot be measured by joint torque measurement. However, there are no studies that measured the stiffness of postoperative muscles using ultrasound shear-wave elastography. The purpose of the present study was to estimate the muscle force of the quadriceps femoris muscle in patients after knee joint surgery with muscle dysfunction using ultrasound shear-wave elastography and to examine the clinical usefulness of this technique.
Materials and methods
Subjects
Seven healthy controls (control group) and seven patients who had undergone arthroscopic surgery of the knee (patient group) participated in this study. The controls were five males and two females with a mean age of 24.0±2.7 years, height of 170.7±7.4 cm and weight of 61.6±7.5 kg. Controls had no history of surgery or past or current neurological disease in the lower limbs. Furthermore, controls who experienced knee and thigh orthopaedic disease within 3 months of this study were excluded. Patients were two males and five females with a mean age of 22.4±6.7 years, height of 164.4±9.3 cm and weight of 58.3±9.4 kg. Surgeries included two anterior cruciate ligament reconstructions (ACLRs) using a semitendinosus tendon graft and five ACLRs using a bone–patellar tendon–bone graft with two lateral meniscal repairs and one medial patellofemoral ligament reconstructions. The mean postoperative duration was 19.6±5.9 (11–27) days. The procedure, purposes and risks associated with this study were explained to the controls and patients, and written informed consent was obtained.
Experimental design
The subjects performed isometric knee extension tasks at maximal effort with knee joint angles at 0° (contraction condition). In resting and contraction conditions, the shear modulus, muscle thickness and pennation angle were measured in the muscle belly of the vastus medialis (VM), vastus lateralis (VL) and rectus femoris (RF) using ultrasound elastography.
Quadriceps contraction task
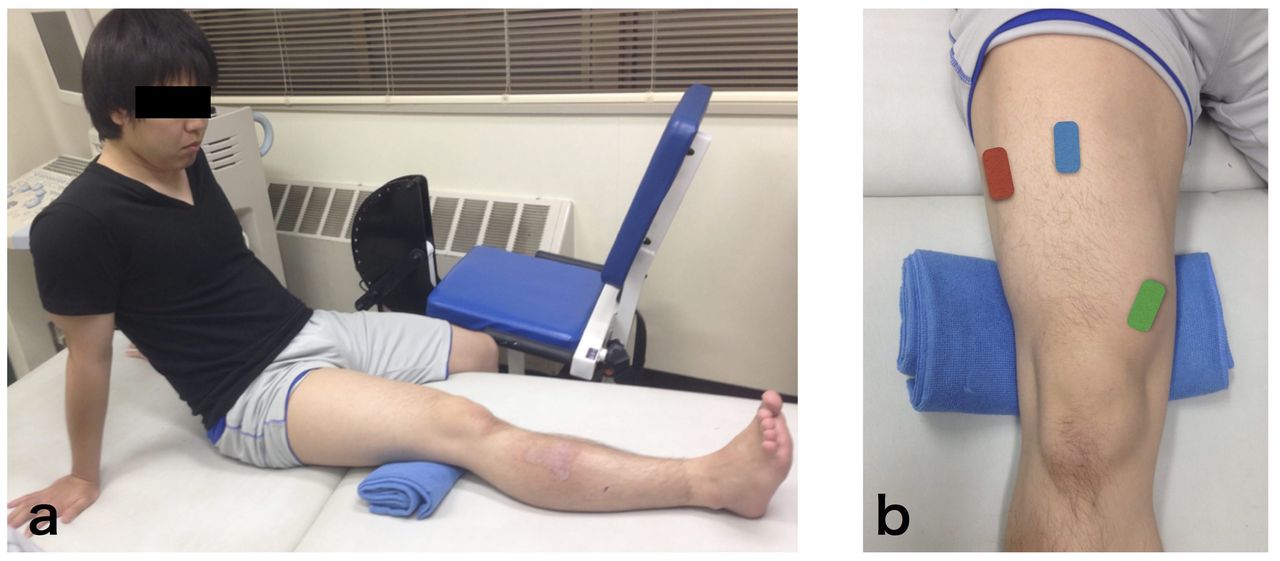
Subjects were placed on a bed in a seated position with hip joint angles at approximately 60° and knee joint angles at 0° (figure 1A). Subjects placed a towel of 1 cm‒2 cm thickness on the posterior part of the knee and then performed the isometric contraction of the quadriceps femoris muscle by pressing the back of the knee down into bed. This ensured that the buttock and heel did not rise during contraction. Knee joint angle during contraction was defined by the examiner to observe. They performed repetitions of quadriceps contraction with submaximal effort to warm up, then two trials with maximal effort for 5 s each.

(A) Representative quadriceps contraction condition and (B) placement of probe at vastus medialis, vastus lateralis and rectus femoris. Subjects sit on the bed with hip joint angle approximately 60° and knee joint angles at almost full extension. The probe for vastus medialis (green square) is placed slightly proximal and medial to the patella. For vastus lateralis (red square), the probe is placed at the mid-point between the head of the great trochanter and inferior edge of the patella. For rectus femoris (blue square), the probe is placed at the midpoint of the line joining the anterior superior iliac spine and the superior patellar pole. The probe is placed parallel to the estimated fibre direction.
Muscle shear modulus
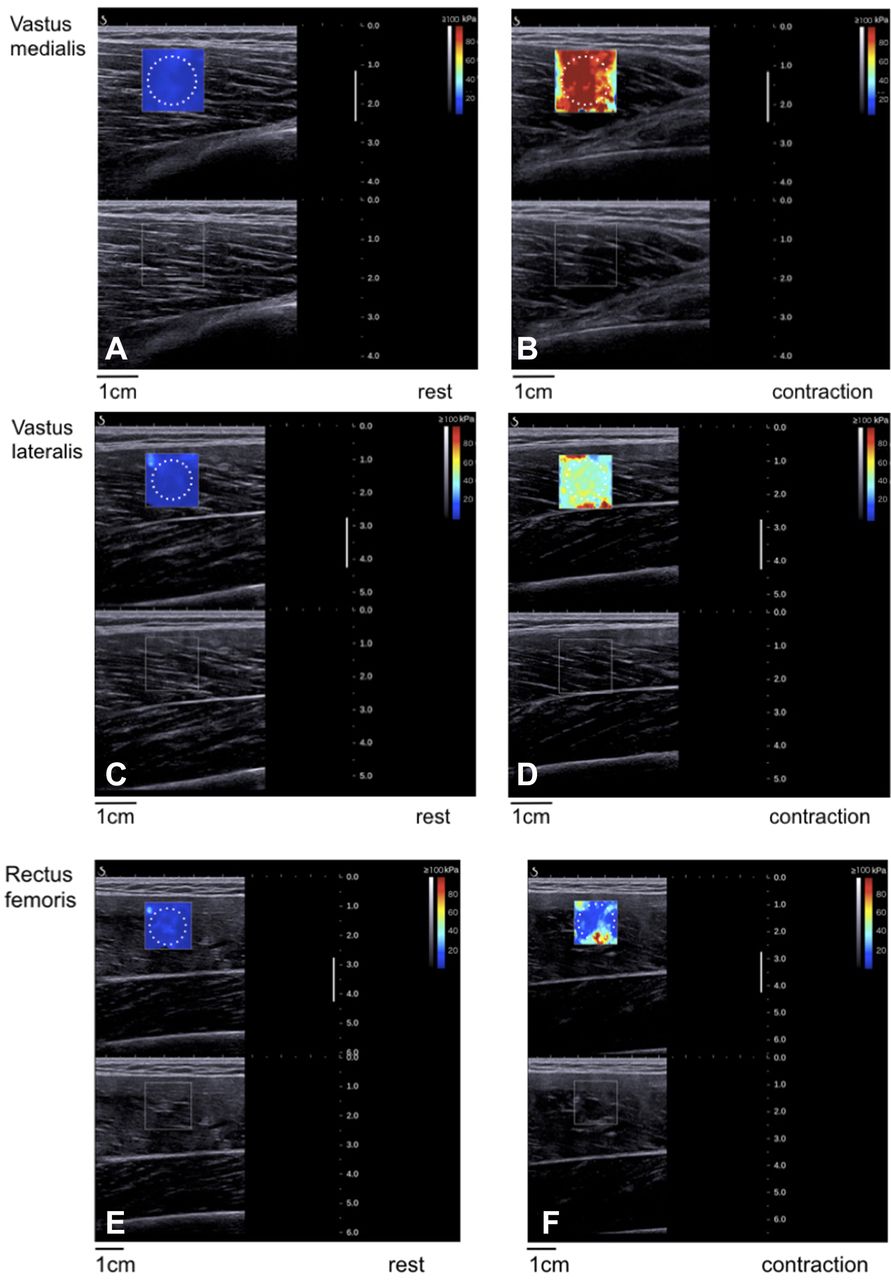
Stiffness of VM, VL and RF muscle belly in the longitudinal direction was inferred from the shear modulus in resting and contraction conditions. The shear modulus was measured with ultrasound shear-wave elastography (AixPlorer Ver. 6. MSK mode, SuperSonic Imagine, Aix-en-Provence, France) with a linear array probe (50 mm, 4–15 MHz, SL15-4, SuperSonic Imagine, Aix-en-Provence, France). The probe for VL was placed at the midpoint between the head of the great trochanter and inferior edge of the patella (figure 1B). For RF and VM, the probe was placed at the midpoint of the line joining the anteriorsuperior iliac spine and the superior patellar pole and slightly proximal and medial to the patella, respectively. The ultrasound shear-wave elastography generated a shear wave within the soft tissues. Based on shear-wave propagation velocity, c, the Young’s modulus was then quantified in kPa. The Young’s modulus was mapped by colour in the region of interest (ROI) of 15×15 mm2 in each muscle fascicular area (figure 2). For each pixel of the ROI, Young’s modulus, E, was deduced from E=3ρc 2 where ρ is the muscle mass density (1000 kg/m3). Circular areas of 10 mm diameter were set within the ROI, and the mean Young’s modulus was measured. The device calculated the Young’s modulus on the supposition that biotissue was isotropic material, but skeletal muscle was not.9 Therefore, we analysed the shear modulus by dividing the Young’s modulus by 3. In the three muscles, ultrasound imaging was performed twice, and the mean value of two measurements was used for analysis.

Representative ultrasound shear-wave elastography images of shear modulus measurement. In the (A, C and E) resting and (B, D and F) quadriceps contraction) conditions at vastus medialis (upper panel), vastus lateralis (middle panel) and rectus femoris (lower panel) in the control group. The figure includes ultrasound B-mode images in the sagittal plane and colour-coded shear modulus distribution within a 15×15 mm2 region of interest overlaying the B-mode image. The scale for the colour code is provided to the right as estimated shear modulus. The spatial average of shear modulus in the circular area is calculated.
Muscle architecture
The obtained B-mode images were analysed using public domain image processing software (ImageJ, V.1.46; National Institutes of Health, Bethesda, Maryland, USA). Muscle thicknesses of the VM, VL and RF were defined as the distance between the superior border of the subcutaneous fascia and the deep aponeurosis10 (figure 3). The pennation angle was measured as the angle between the deep aponeurosis and the fascicle.11

Sagittal plane ultrasound scan of vastus lateralis and vastus medialis. Muscle thickness is calculated as the distance between the superior border of the subcutaneous fascia (B) and the deep aponeurosis (C) of the vastus medialis and vastus lateralis. Yellow lines indicate aponeurosis and the fascicle. Angles aMed and aLat are defined as fibre pennation angles of the vastus medialis and vastus lateralis, respectively.
Statistical analysis
All data are presented as mean and SD of the mean, except for shear modulus in the figure, which is presented as mean and SE. Intraclass correlation coefficients (ICC (1, 2)) were used to assess the reproducibility of two times of records on the same condition. A two-way analysis of variance (ANOVA) with repeated measures was used to compare shear modulus, muscle thickness and pennation angle of the VM, VL and RF in different conditions and for the two measurement sides. Furthermore, the ratio of shear modulus between the contraction condition and the resting condition was accepted as the contraction ratio of each muscle. A two-way ANOVA with repeated measures was used to compare the contraction ratio between the muscles and test limbs. In the case of a two-factor interaction or main effects, a Bonferroni post hoc test was used to identify significant differences. The Mauchly sphericity test was applied and, if violated, the Greenhouse-Geisser correction factor was used to control for type I errors. The level of significance was set at p<0.05. Statistical analyses were performed using IBM SPSS statistics software (V.19; IBM, Tokyo, Japan).
Results
High reproducibility was found for the shear moduli of the VM, VL and RF in the resting and contraction conditions (control group: ICC (1,2)=0.88–0.99; patient group: ICC (1,2)=0.90–0.99). Muscle thickness (control group: ICC (1,2)=0.82–0.99; patient group: ICC (1,2)=0.92–0.99) and pennation angle (control group: ICC (1,2)=0.78–0.99; patient group: ICC (1,2)=0.89–0.99) also showed high reproducibility.
The representative shear moduli of the VM, VL and RF in each group are shown in figure 4. There was no significant condition-by-measurement side interaction in the control group (VM, p=0.48; VL, p=0.28; RF, p=0.06), while the shear moduli of the VM and VL did show a significant interaction in the patient group (VM, p<0.05; VL, p<0.01; RF, p=0.05). In the VM and VL of the patient group, there were no significant differences between the measurement sides in the resting condition (unaffected side vs affected side (VM, 4.0 vs 3.7 kPa; VL, 6.2 vs 5.2 kPa (all p>0.05))); however, the shear moduli in the contraction condition were significantly lower on the affected side than the unaffected side (unaffected side vs affected side (VM, 68.3 vs 20.8 kPa; VL, 63.3 vs 33.1 kPa (all p<0.05))). On the other hand, there was a main effect of the conditions in the RF (F=19.0, p=0.005); the shear modulus of rest condition was 22.4% in the contraction condition (rest condition vs contraction condition when collapsed across measurement side (5.3 vs 22.4 kPa)).
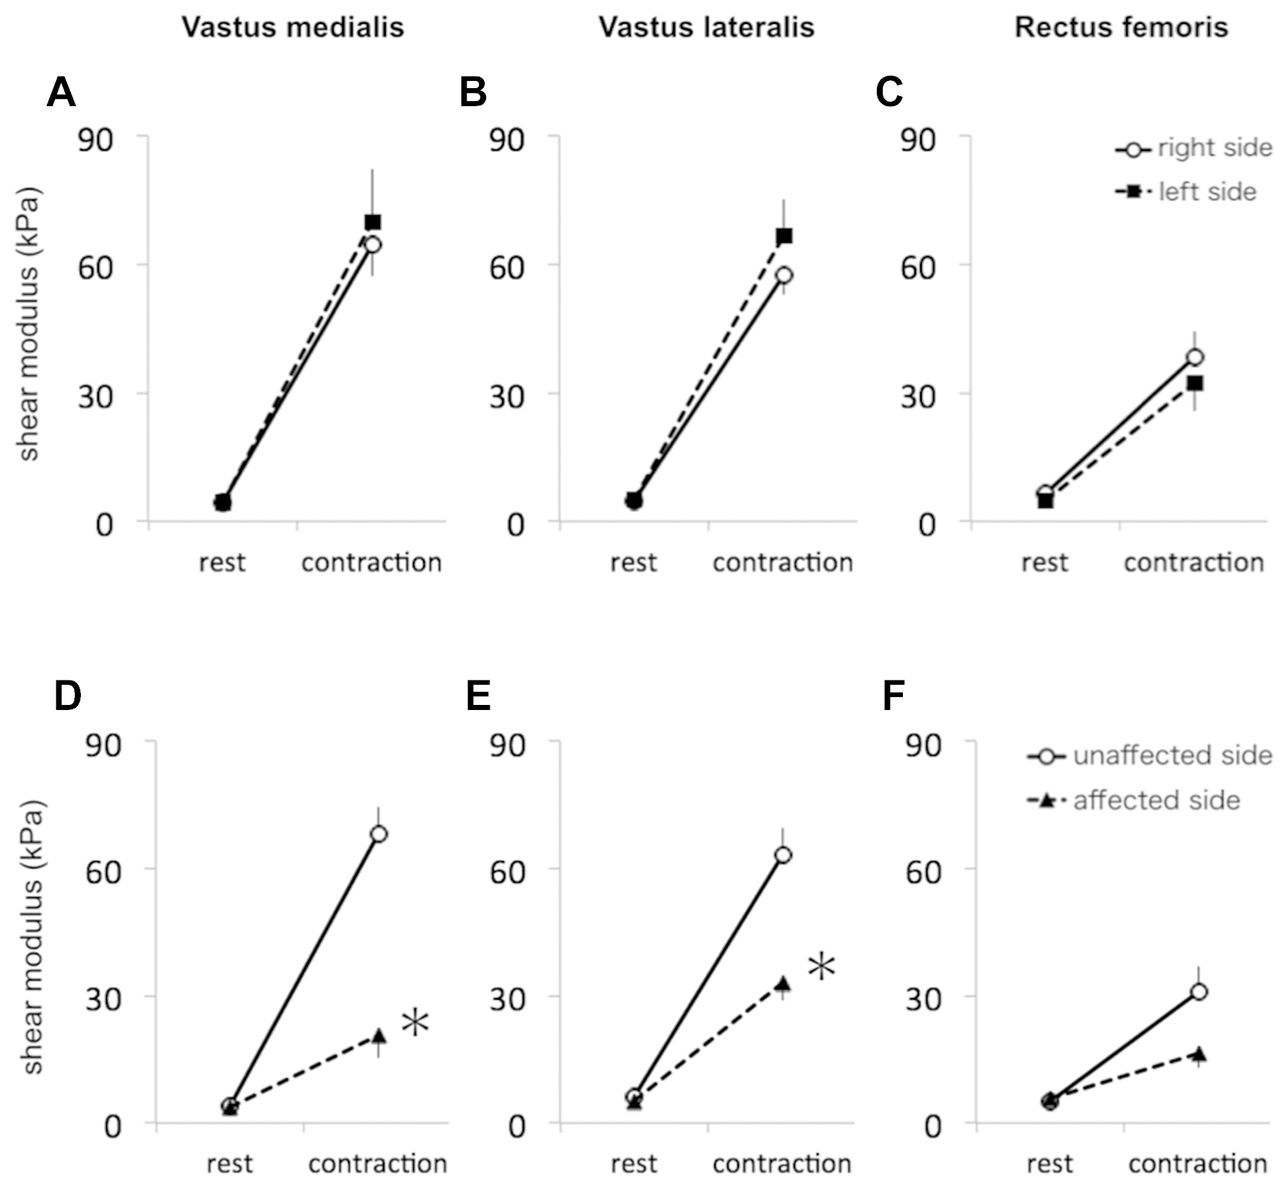
Shear moduli of the vastus medialis, vastus lateralis and rectus femoris in control group and patient group. (A and D) Vastus medialis, (B and E) vastus lateralis and (C and F) rectus femoris at control group (upper) and patient group (lower). *P<0.05 versus unaffected side.
Tables 1 and 2 show the muscle thickness and pennation angle for each group, respectively. In both groups, there were no significant condition-by-measurement side interactions (p>0.05).
Muscle thickness (mm) of the vastus medialis (VM), vastus lateralis (VL) and rectus femoris (RF) in the control group and patient group
Pennation angle (°) of the vastus medialis (VM), vastus lateralis (VL) and rectus femoris (RF) in the control group and patient group
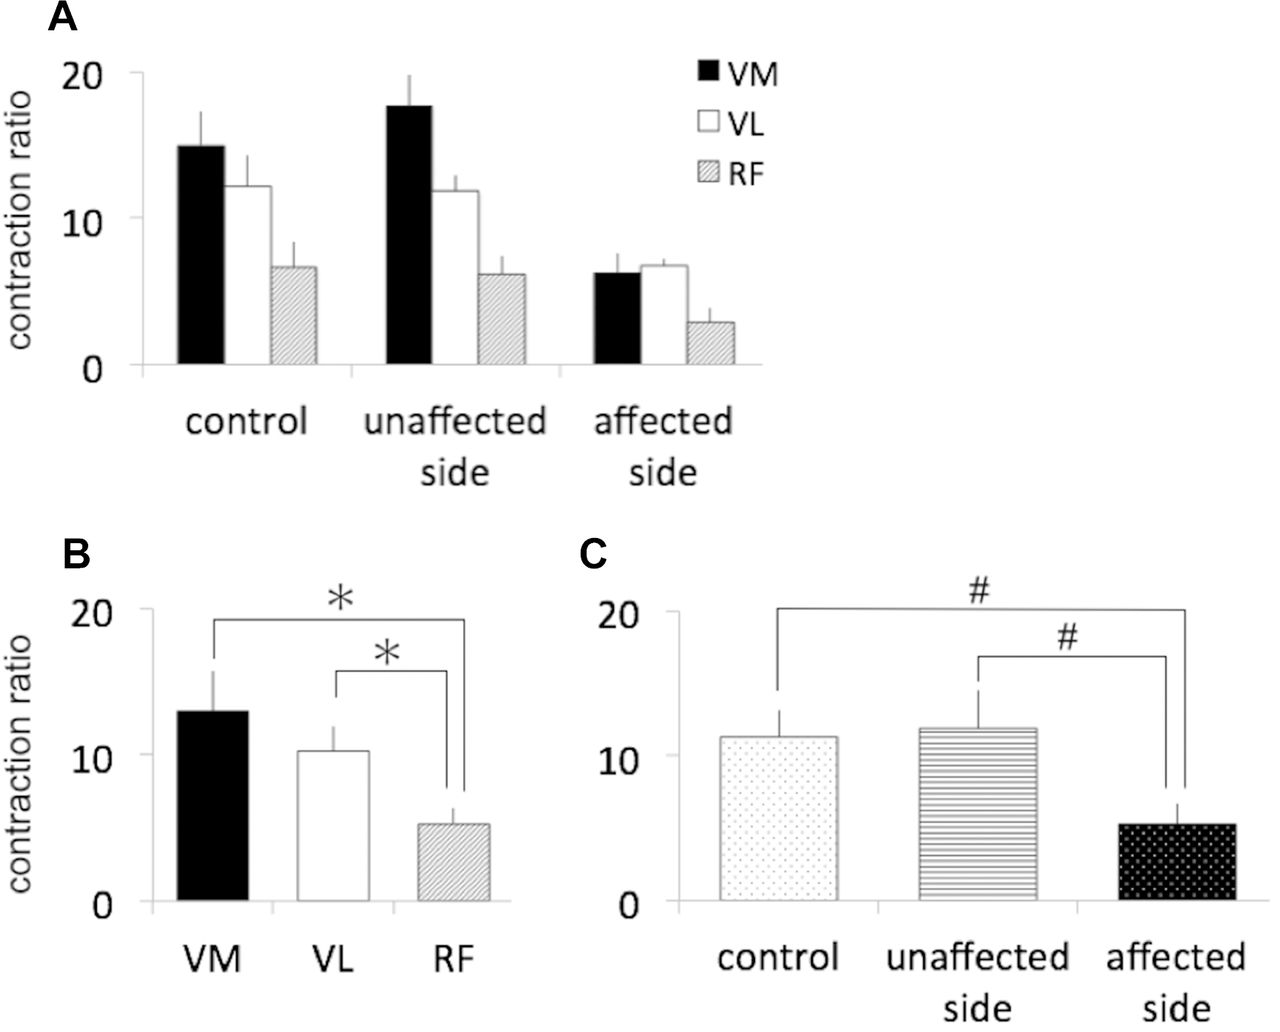
The representative contraction ratio of the VM, VL and RF in the controls (right lower limb in control group), unaffected side and affected side are shown in figure 5. There was no significant muscle-by-limb interaction. However, there were main effects of muscle (F=17.7, p=0.005) and limb factors (F=19.2, p=0.004). The contraction ratio of the VM and VL was significantly higher than that of the RF (VM and VL vs RF when collapsed across limb; 13.0 and 10.3 vs 5.3 (all p<0.05)). The contraction ratios of the control and unaffected sides were significantly higher than those of the affected side (control and unaffected side vs affected side when collapsed across muscle; 11.3 and 11.9 vs 5.3 (all p<0.01)).
The contraction ratio of the vastus medialis (VM), vastus lateralis (VL) and rectus femoris (RF) in (A) control, unaffected side and affected side, (B) averaged across limb factor and (C) averaged across muscle factor. *P<0.05 between muscles. #P<0.01 between limbs.
Discussion
This present study showed that the shear moduli of the VM and VL on the affected side in patients after knee joint arthroscopic surgery were significantly lower than the unaffected side in the contraction condition, but no significant differences in the resting condition. The muscle thickness and pennation angle of the three muscles were not significantly different in the affected and unaffected sides in the patient group. Additionally, the contraction ratio of the VM, VL and RF in the control, unaffected side and affected side had no significant muscle-by-limb interaction.
Muscle force cannot be quantified directly from the shear modulus of the contraction condition of the muscle. However, it can be used to estimate the change of muscle force from change of shear modulus, because muscle force and shear modulus have a strong linear relationship. Sasaki et al investigated the relationship between ankle joint torque and the shear modulus of the tibialis anterior muscle.7 The results indicated a linear association between muscle force and the shear modulus (R2=0.52). In the control group, the shear modulus of each muscle showed no interaction, so the change from resting condition to contraction condition showed the same pattern on the left and right side. On the other hand, the shear moduli of the VM and VL in the patient group showed different patterns between the unaffected and affected side. It can be assumed that there was no pathological change in the mechanical properties of the muscle after surgery in the patient group, since there were no significant difference in shear modulus between the unaffected side and the affected side at resting condition. Therefore, on the affected side of the patients, it is suggested that muscle force may be decreased corresponding to a decrease in shear modulus.
It is reported that knee joint extension torque decreased by 61% at 1 month after knee arthroscopic surgery. Furthermore, several studies using surface electromyogram (EMG) showed that the muscle activity of the quadriceps femoris muscle declines in the early phase after knee joint surgery. The muscle activity during isometric knee joint extension movement decreased by 37% in 2 weeks after surgery.3 In addition, when isometric leg press was performed at 2 weeks after surgery, it decreased by 31%.2
These results from previous studies clearly demonstrate the low function of the quadriceps femoris muscle of the knee joint postsurgery. In the present study, the shear moduli of the VM and VL on the affected side were 30% (68.3 vs 20.8 kPs) and 52.3% (63.3 vs 33.1 kPa), respectively, on the unaffected side at maximum isometric contraction of the quadriceps femoris muscle with knee joint extension. These results are similar to the reported muscle activity and knee extension torque.
It was suggested that the change in muscle architecture does not influence changes in the shear modulus of the VM, VL and RF because there were no differences between the unaffected and affected sides with regard to muscle thickness and pennation angle, whether the muscle was contracted or not. It was reported that muscle architecture is possibly an index of the force-generating capacity of the muscle.10 12 However, it was difficult to predict a significant decrease of the shear modulus on the affected side in the present study from the change in muscle architecture with muscle contraction. Thus, it was expected that the measurement of the shear modulus is a clinical indicator that can sensitively evaluate decreased contraction of muscle.
There were no significant differences in the shear modulus of the RF between the unaffected side and the affected side in the contraction condition (figure 4F). The contraction ratios of the VM and VL were significantly larger than those of the RF when collapsed across measurement limbs (figure 5B). This may be because of the influence of measurement position. When the hip joint is in flexion position, the RF, which is a biarticular muscle, is relaxed and the contraction force decreases. Therefore, the difference in the shear modulus between the unaffected side and affected side was small.
Hug et al stated that the measurement of shear modulus is an effective indicator that can estimate the muscle force of individual muscles in the agonist muscles.13 However, the contraction ratio of the VM, VL and RF in the control, unaffected side and affected side had no significant muscle-by-limb interaction (figure 5A). We considered that the balance of the contraction ratio between muscles on the affected side had not collapsed due to surgery.
Some factors have been reported to cause muscle dysfunction postsurgery. Arthrogenic muscle inhibition (AMI), which is a mechanism of reflex inhibition in the nervous system, may be strongly related to intraarticular swelling postsurgery.14 Given that atrophy of the quadriceps femoris muscle is related to a decrease of the force-generating capacity of the muscle,15 factors such as AMI and muscle atrophy may be the reason for the difference between the unaffected and affected sides of the shear modulus; however, it was difficult to identify these factors from the data in the present study. Further comprehensive examinations related to establishing an index of muscle architecture, muscle activation and force-generating capacity of the muscle will be necessary in the future.
The evaluation of muscle function using shear-wave elastography, as demonstrated in the present study, is expected to became a useful index for measurement of muscle function.4 6 7 As mentioned above, muscle dysfunction in the early postsurgery period was assessed using surface EMG and knee extension strength measuring equipment. However, the value measured by surface EMG possibly has low validity in a comparison of daily variation and difference between the unaffected and affected side. In addition, there are patients who have difficulty performing knee extension at maximal effort because of pain during the early postsurgical period. Drechsler et al reported that 71% (22/31) of patients could not accomplish the knee extension task 1 month after surgery.1 It was difficult to evaluate dysfunction of the quadriceps femoris muscle with accuracy during the early postsurgery period due to physical burden and non-quantitative evaluation. This study showed that shear-wave elastography successfully and quantitatively evaluated the shear modulus without being influenced by the position of the patients. Therefore, we suggest that the measurement of the shear modulus has potential as a new evaluation index with high clinical value as it is quite sensitive to decreases in muscle contraction.
Limitations
This study has a few limitations. First, we could not measure knee extension torque. The reason was we wanted to prevent aggravation of inflammation and hyperstress of the repair tissue. It was reported that the shear modulus is related to contraction intensity of the biceps brachii muscle and the tibialis anterior muscle, but there was no study on the quadriceps femoris muscle. Therefore, it will be necessary to investigate the relationship between the shear modulus and contraction intensity in the quadriceps femoris muscle in the future. Second, we did not assess the shear modulus, presurgery and during follow-up. The previous study reported that the EMG amplitude of the VM lowered 9 hours postsurgery compared with the presurgical value.2 However, functional deterioration before surgery may have possibly existed. It will be necessary to assess the presurgical shear modulus of the quadriceps femoris muscle. In addition, it will be important to investigate the postoperative progress in the future. The follow-up study estimates the recovery of the quadriceps femoris muscle function and may become an index of progress and may be used to measure the effects of rehabilitation. Third, the vastus intermedius (VI) is also a muscle of the quadriceps, but we evaluated only the VM, VL and RF. The reason is that the shear wave did not reach the muscle belly of the VI that was deeply located. Therefore, it will be necessary to clarify the active properties of the quadriceps femoris muscle, including the VI, in the future.
Conclusions
We measured the shear modulus of the VM, VL and RF during rest and quadriceps contraction exercises in the early postsurgical period. The shear modulus during contraction was significantly lower in the VM and VL on the affected side than the unaffected side. Additionally, the contraction ratio of the VM, VL and RF in control, unaffected side and affected side had no significant muscle-by-limb interaction. The results demonstrated a decrease in muscle stiffness during contraction in patients with quadriceps femoris dysfunction, but did not show a difference in the balance of the contraction ratio between the muscles. Measurement of the shear modulus has good potential as a new, sensitive evaluation index to assess the decrease in muscle contraction.
Acknowledgments
We are grateful for support from Arika Saito about measuring data.
References
Footnotes
Contributors MK performed all the experiments and data analysis. KT advised and supervised the data analysis and helped to draft the manuscript. TS supervised the data measurement. MK participated in coordination and helped to draft the manuscript. All authors read and approved the final submitted manuscript.
Funding The authors have not declared a specific grant for this research from any funding agency in the public, commercial or not-for-profit sectors.
Competing interests None declared.
Patient consent Obtained.
Provenance and peer review Not commissioned; externally peer reviewed.
Data sharing statement Data set available from MK (email: mkt1031pc@yahoo.co.jp). This study was approved by the ethics board of the Sapporo Medical University Hospital.