Article Text

Abstract
Objectives For several decades, autologous blood doping (ABD) in sports has been a major problem, and even today there is still no reliable method for satisfactorily detecting ABD. For this kind of doping, stored individual erythrocytes are used to increase stamina and endurance caused by a higher erythrocyte level in the athlete’s body. Since there is growing evidence that these cells are enriched with microRNAs (miRNAs), this study has been carried out to discover and validate all miRNAs occurring in fresh blood as well as in stored blood.
Methods Therefore, small RNA Next Generation Sequencing has been performed, which allows untargeted detection of all miRNAs in a blood sample. The focus of this investigation has been to find miRNA alterations in blood bags after erythrocyte processing and during storage, as compared with fresh blood directly withdrawn from subjects. Blood samples were obtained from 12 healthy, recreationally active male subjects three times before blood donation and from blood bags at several time points after blood processing.
Results 189 miRNAs have been considered stable over two consecutive weeks. A further analysis revealed a complex biomarker signature of 28 miRNAs, consisting of 6 miRNAs that altered during 6 weeks of storage and 22 miRNAs that altered due to processing.
Conclusion These results suggest that the identified miRNA biomarker signature may be used for the detection of ABD. These 28 miRNA candidates are tested and verified currently in a follow-up study, a human transfusion clinical trial in healthy sportsmen.
- NGS
- smallRNA Seq
- miRNA
- erythrocyte
- autologous blood doping
This is an Open Access article distributed in accordance with the Creative Commons Attribution Non Commercial (CC BY-NC 4.0) license, which permits others to distribute, remix, adapt, build upon this work non-commercially, and license their derivative works on different terms, provided the original work is properly cited and the use is non-commercial. See: http://creativecommons.org/licenses/by-nc/4.0/
Statistics from Altmetric.com
What are the new findings?
RNA extracted from erythrocyte concentrates (ECs) have good RNA integrity number values appropriate for Next Generation Sequencing.
Long-time storage of ECs resulted in an upregulation of six miRNAs (miR-16-2-3p, miR-1260a, miR-1260b, miR-4443, miR-4695–3 p and miR-5100).
A complex biomarker signature consisting of 28 miRNAs was successfully created and are currently being tested in our study.
Introduction
Performing homologous or autologous ‘blood doping’ increases the erythrocyte counts in the bloodstream of up to 10% and therefore will lead immediately to increased stamina and endurance thanks to improved oxygen-carrying capacity. After months of training, the erythrocyte mass would increase just 5%.1
Blood withdrawal and blood reinfusion induce changes in some haematological markers of erythropoiesis during the caused temporary anaemia and erythrocythemia.2 However, appropriate highly sensitive methods of detecting even small amounts of transfused autologous blood are still missing.3Hence new innovative methods to detect ‘blood doping’ and promising new prospects, for example, on the transcriptome level,4 5 are required in order to find new valid biomarker signatures. There are various reasons why microRNAs (miRNAs) should be taken into account when searching for new and stable biomarkers.6 miRNAs comprise a large family with more than 2500 mature miRNAs in humans,7 of evolutionarily conserved, small non-coding RNAs (~21 nt) with great stability and long half life,8–10 which regulates gene expression by binding complementary to the 3’UTR, 5’UTR or open reading frame of target mRNA. This results either in translational inhibition or in mRNA degradation based on degree of homology.11 It is estimated that the majority (over 60%) of human protein-coding genes are regulated by miRNAs.12 These post-transcriptional regulators play a crucial role in various biological processes, such as cell growth, tissue differentiation, cell proliferation, apoptosis13 and also haematopoiesis.11 Since several years miRNAs are also successfully used as diagnostic biomarkers for various diseases.14 It is conceivable that altered miRNA expression levels lead to disease and cellular pathologies as well as dysregulated miRNA expression is a consequence of disease.15
Since performing autologous blood doping (ABD) is associated with blood storage for several weeks, we focused on erythrocyte processing and storage to investigate the usefulness of miRNA in erythrocytes as a new parameter in a pilot study. We hypothesise that the non-physiological conditions of erythrocyte storage result in dysregulation in the transcriptome and in particular in a changed miRNA expression pattern as a consequence of detrimental changes in erythrocyte physiology and function, which is known as storage lesion. The aim of the study was to discover and validate all miRNAs that show alteration in blood bags during storage compared with those in fresh blood and to develop a valid biomarker signature of significant increased miRNAs, which can be used in a follow-up study with ABD.
Methods
Subjects
Twelve healthy, recreationally active male subjects participated in the pilot study. Their anthropometric data are outlined in online supplementary table 1. All subjects were non-smokers and free of all kinds of medication during the study course. They obtained detailed verbal and written reports about the study and signed the declaration of consent before participation. The study was performed in accordance with the latest revised form of the Declaration of Helsinki and approved by the Ethics Committee of the LMU (Ludwig-Maximilians Universität München; project no. 385–13).
Supplemental material
Study design
To get an insight into the normal physiological baseline RNA profile of each subject, venous blood samples were taken 3, 2 and 1 week before blood donation performing standard venipuncture at the bend of the elbow using the median cubital vein. One week later, the whole blood donation (WBD) was drawn using the Composelect T3984-23 System (Fresenius, Bad Homburg, Germany) according to practice. Erythrocyte concentrates (ECs) were produced using the Compomat G4 (Fresenius, Bad Homburg, Germany) and stored at 4°C according to practice. EC blood samples were taken at the following points in time: 0 week, 1 week, 2 weeks, 4 weeks and 6 weeks as shown in figure 1.

Study design. The WB was sampled thrice before WBD and stored as EC at 4°C afterwards for 6 weeks (w). The samples were taken at the given points in time using the PAXgene Blood RNA Tubes (PAX). EC, erythrocyte concentrate; WB, whole blood; WBD, whole blood donation.
Blood sampling and processing
Venous blood samples from the first three points in time were taken directly into the PAXgene Blood RNA Tubes (PreAnalytiX, Hombrechtikon, Switzerland) using a 20-gauge butterfly needle. These tubes allow the stabilisation of the actual RNA profile including the miRNAs.
The blood donation of 500 mL blood was drawn into the Composelect T3984-23 System (Fresenius, Bad Homburg, Germany) containing 70 mL of citrate phosphate dextrose (CPD). During the blood donation, the blood was automatically mixed by a blood blending weigher (Compomixer M2, NPBI) to prevent clot formation. The blood was then leucodepleted at room temperature using the inline filter system. After a centrifugation step (3998 g for 10 min at 20°C), the plasma was separated from the erythrocytes and most of the plasma was removed from the erythrocytes into an empty satellite bag for plasma using the Compomat G4 (Fresenius, Bad Homburg, Germany). The Compomat G4 is controlled by a computer system using the Compomaster software (Compomaster Net, V.2.01.01. D, NPBI).16 In a last step, 110 mL of an additive solution of phosphate, adenine, glucose, guanine, saline and mannitol was added to the erythrocytes.
For each point in time during EC storage, 18 mL of blood was collected from the bag for multiple blood samples. The fastest way to collect enough blood and to avoid shear forces was to clamp the hose (with a forceps) and cut it with a sterile scalpel, since RNA transcript levels change dramatically within short time intervals.17–19 To avoid air in the bag, the blood was drained from a lifted/head first blood bag into a 50 mL tube. After the blood collection, the hose was immediately clamped before lowering the blood bag and welded under the forceps. Three millilitres of blood was then instantly transferred to a PAXgene Blood RNA Tube with a serological pipette and gently inverted 10 times for complete lysis. ECs were stored in a 4°C blood bank fridge until the next sampling.
Total RNA extraction
Total RNA was extracted from PAXgene tubes using the PAXgene Blood miRNA Kit (Qiagen, Hilden, Germany) according to manufacturer’s protocol until the elution step. For elution, 60 µl of Buffer BR5 were pipetted directly onto the spin column and centrifuged for 1 min at 20 000 × g. This step was repeated with the 60 µl eluate in a microcentrifuge tube. Total RNA concentration was quantified using the Qubit 2.0 Fluorometer (Life Technologies, Grand Island, New York, USA) in combination with the RNA HS Assay Kit (Life Technologies) according to the manufacturer’s protocol.
To determine the RNA quality, the RNA integrity number (RIN) was measured on an Agilent 2100 (Agilent Technologies, Waldbronn, Germany) using an Agilent RNA 6000 Nano Kit (Agilent Technologies). In addition, a Small RNA Kit (Agilent Technologies) was used to measure the small RNA fraction. Both measurements were performed according to the manufacturer’s protocol.20 21 The extracted RNA was stored at −80°C until further processing.
Library preparation and small RNA sequencing
For library preparation, 100 ng of total RNA of each blood sample was converted into barcoded cDNA libraries using the NEBNext Multiplex Small RNA Library Prep Set for Illumina (New England Biolabs, Ipswich, USA). The steps of this kit include sequential adaptor ligation to both ends, reverse transcription and the introduction of unique barcodes during the PCR step to each sample. After PCR enrichment, the cDNA was purified using the MinElute PCR Purification Kit (Qiagen) and loaded on a DNA 1000 Chip (Agilent Technologies) to determine the concentration of the produced cDNA construct. For size selection, the pooled cDNA constructs were separated on a 4% agarose gel (at 4°C and 150 V for 3 hours) using MetaPhor Agarose (Lonza, Rockland, USA) for better resolution.22 The produced small RNAs are of approximately 135–160 bp due to the adaptor ligation to both ends and the introduction of unique barcodes to each sample. To ensure that only small RNAs of interest are included in the final library, the appropriate band between 135 and 160 bp was cut out. The cDNA from the gel slice was extracted with the MinElute Gel Extraction Kit (Qiagen) and analysed regarding size and purity on the High Sensitivity DNA Chip (Agilent Technologies). The concentration was determined with the Qubit 2.0 Fluorometer (Life Technologies) in combination with the ds HS DNA Assay Kit (Life Technologies) according to the manufacturer’s protocol. The cDNA libraries were subjected to the Illumina sequencing pipeline at Next Generation Sequencing (NGS) @ TUM (NGS core facility at Technical University of Munich Weihenstephan). The pipeline consists of clonal cluster generation on a single-read flow cell (Illumina) by bridge amplification on the cBot via TrueSeq SR Cluster Kit v3-cBOT-HS (Illumina) and 50 cycles sequencing-by-synthesis on the HiSeq2000 (Illumina).
Generating a read count table
Raw read data were processed using an in-house procedure.23 Btrim was used to trim the 3’end adapter sequence.24 Reads without detectable adapter sequence or with less than 16 nt were excluded from the data set. The quality control software Fast QC (Babraham Bioinformatics, UK, V.0.10.1) was used to calculate sequence length distribution and representing base calling accuracy by the mean phred quality scores (Q score). For further specificity of the reads, all human rRNA, tRNA, snRNA and snoRNA sequences were removed by mapping the reads to RNAcentral database (RNAcentral Consortium 2015). For filtering, one mismatch in the first 15 nts and a variable number of mismatches in the remaining sequence was allowed. The remaining reads were mapped to the most recent miRBase database (release 21).7 All alignments were carried out via Bowtie short read aligner25 ,26 using the ‘best alignment algorithm’. The sorting and indexing of aligned reads were carried out by SAMtools27 ,28 and readcounts finally generated by calling the sum of hits per miRNA sequence. MiRNAs with average readcounts<50 were excluded from the read count table as a noise-cutoff.
Statistical analysis
All sequencing data were normalised and differential gene expression was assessed using the DeSeq2 R script29 30 (RStudio V.3.1.2). P values have been adjusted for multiple testing using Benjamini-Hochberg approach. Heatmap, Hierarchical Cluster Analysis and (dynamic) Principal Component Analysis were carried out with GenEx software (GenEx Pro, 5.4.4.119, Multid Analyses AB, Sweden).
Results
RNA quality and quantity
The total RNA yields over all 96 samples were 4880.6±2375.6 ng per sample, measured by fluorometric quantification. As expected, the total RNA yield was significantly different (p<0.01) between the blood samples which were taken freshly versus the stored blood samples. RNA quality and RIN values were determined using the Bioanalyzer 2100 (Agilent Technologies) and resulted in integer total RNA in all samples with mean RIN values of 7.53±0.64 (figure 2). The miRNA content of total RNA was 7.67%±2.46% determined by the Bioanalyzer 2100 analysis software, with no differences between sampling groups or sampling weeks.
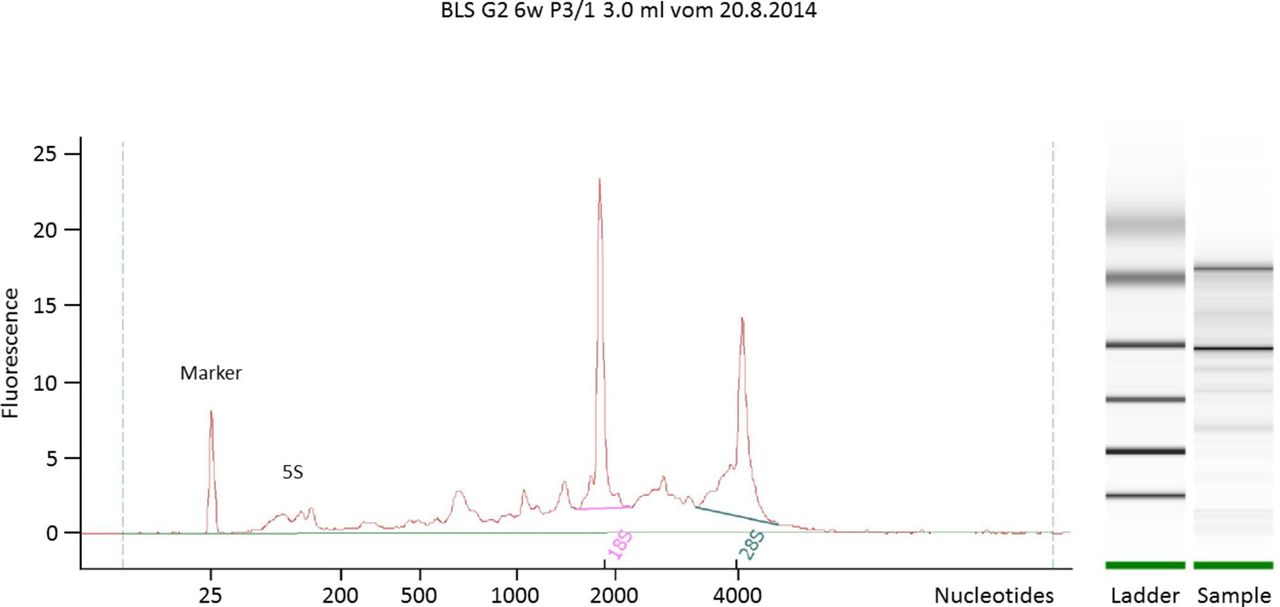
Electropherogram and gel image to calculate RNA quality. A typical electropherogram of total RNA of human EC. This example shows a sample with good quality (RIN: 7.4). EC, erythrocyte concentrate; RIN, RNA integrity number.
Phred score
For sequence accuracy, a quality value called Phred score was estimated for each sample. A mean Phred score >30 means a 99.9% probability of correct base call. Each sample had a mean Phred score of 37 and only 3.41% of all reads had a Phred score <30.
Data evaluation
Raw reads per sample with an average of 12.0±5.45×10⁶ were obtained. Based on a shorter read length than 16 nucleotides 4.51±2.96×10⁶ reads per sample were excluded. The remaining 7.52±3.35×10⁶ reads were mapped to the RNAcentral database to remove all human rRNAs, tRNAs, snRNAs and snoRNAs. After excluding 2.60±1.51×10⁶ reads mapped to RNAcentral, the remaining 2.69±2.29×10⁶ reads were mapped to 2588 annotated human miRNAs collected in the miRBase database. 2.99±1.35×10⁶ reads aligned to 1734 different human miRNAs which correspond to 32.4% of the raw reads.
To avoid background noise and false positive, an average threshold of ≥50 reads over all samples was set. This excluded 1539 miRNAs and 195 human miRNAs were considered for further analysis. Most of these miRNAs (113) have the typical miRNA sequence length of 22 nucleotides, which corresponds to exactly 90.0% of all remaining reads. More information about the abundance of miRNAs and their corresponding sequence length is shown in online supplementary table 2 and figure 1.
Supplemental material
Natural quantity variation in miRNA expression
To identify natural quantity variations in miRNA expression, three sampling time points were taken over 2 weeks. Between two following samplings, that is, during 1 week, there were no significant differences (3 weeks before vs 2 weeks before and 2 weeks before vs 1 week before). During three samplings over 2 following weeks, small differences occurred only in six miRNAs out of 195 (online supplementary table 3). Between time points 3 w before and 1 w before let-7g-5p, miR-126–3 p, let-7a-5p, let-7i-5p, miR-107 and miR-107 were downregulated. Based on this significant expression changes (p<0.05), these miRNAs were excluded from further analysis.
Most significantly upregulated miRNAs after blood bag processing
For ABD, stored blood bags must be transfused to the donor to increase their erythrocytes. In order to reveal doping sinners on the basis of a different miRNA expression profile only highly upregulated miRNAs, which increase their normal miRNA level, can be used. Since three samples were taken on a weekly basis to identify natural variation, every single one of these time points were compared with time point 0 w, the sample directly taken after processing the blood bag. This resulted in three different tables where the miRNAs were sorted according to the smallest p value. After excluding the unstable miRNAs and the downregulated miRNAs, the Top 20 significantly regulated miRNAs of time point 0 w of each table were combined into one table with 22 miRNAs (table 1). Almost every miRNA in the initially Top 20 0 w could be found in all three tables. Only two miRNAs were different ones. To set up only one table the Top 20 0 w miRNAs were expanded to a Top 22 0 w miRNA list with the missing miRNAs from the other tables. In the further course of the paper, this Top 22 0 w list with the greatest p value will be referred to as Top 22 0 w pv (p value). The Top 22 0 w pv are ranked for each time point before blood donation. MiRNAs that did nOt occur in every table are marked with bold rank numbers.
Top 22 upregulated miRNAs with the greatest p values
Most affected miRNAs by blood bag processing
A list with the Top 22 0 w miRNAs with the greatest fold change (Top 22 0 w fd) was created as described above. The miRNAs were sorted according to the greatest fold change in expression, the three tables were combined and expanded to include two miRNAs to generate one single table. Again miRNAs that did not occur in every table are marked with bold rank numbers. 19 miRNAs out of the Top 22 0 w fd were identical with the Top 22 0 w pv. Only three miRNAs (miR-574–5 p, −103a-3p, −106b-5p/let-7f-5p, miR-27a-3p, −101–3 p) were different ones, which refer to the underlined miRNAs in table 1 and online supplementary table 4.
Changes during blood bag storage
During blood storage miR-16-2-3p, miR-1260a, miR-1260b, miR-4443, miR-4695–3 p and miR-5100 were found to be significantly upregulated over time (table 2).
Changing miRNAs during blood bag storage
None of these miRNAs were part of unstable miRNAs, Top 22 p value or Top 22-fold change lists as shown in table 1 and online supplementary table 4.
Most affected miRNAs at time point 6 w
It is known that the body needs several weeks to replenish harvested cells and to normalise blood variables like iron and Hb.31 32 So it can be assumed that doping sinners will wait for at least 6 weeks before transfusion of the own blood bag. Therefore, the differences between the time points before and time point 6 w are important to identify the most affected miRNA due to blood bag processing and storage. Likewise every time point before the blood donation was compared with time point 6 w and a common list of Top 21 6 w pv was generated base on p values (table 3). The same procedure was performed with the lists based on fold changes to generate a list of Top 22 6 w fc (online supplementary table 5 ). Tables 2 and 3 and online supplementary tables 4 and 5 did not differ much from each other. The only new miRNAs were the ones that changed during blood bag storage, like miR-1260a, miR-1260b, miR-4695–3 p and miR-5100.
Top 21 upregulated miRNAs with the greatest p values
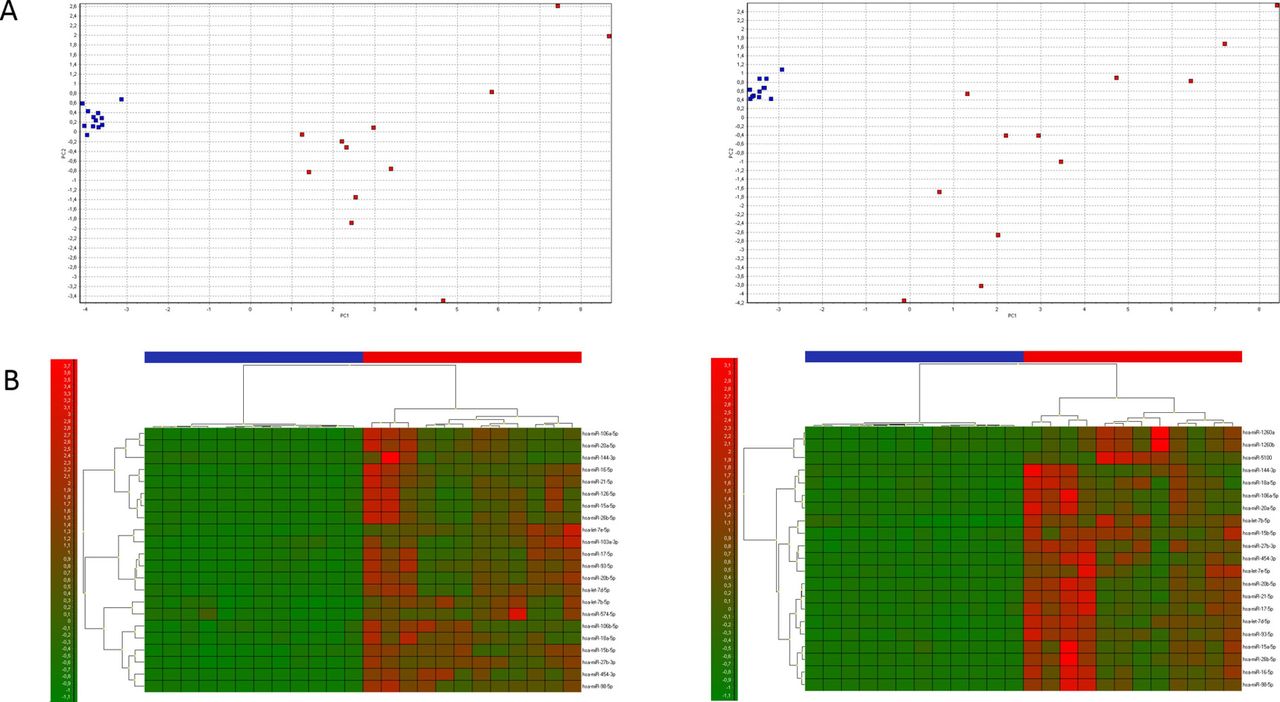
Multivariate analysis
The Top 22 0 w pv and the Top 21 6 w pv from time point 1 w before were analysed by PCA (figure 3A). The first component (PC1) explained 79.7% and 74.6% of the total variance, respectively. Based on the selected miRNAs, two clear clusters formed between samples taken from subjects (Arm) and those taken from stored blood bags (Bag). The corresponding heatmaps showed the same picture of well separated samples from arm (red bars) and blood bags (blue bars) (figure 3B).
Multivariate analysis. (A) Red and blue indicate samples from a blood bag and from a patient’s arm, respectively. On the left side are the Top 22 0 w pv loaded with the samples from time points 1 w before vs 0 w. On the right side are the Top 21 6 w pv loaded with the samples from time points 1 w before vs 6 w. The first component (PC1) explained 79.7% and 74.6% of the total variance, respectively. (B) The associated heatmaps are shown directly below the PCAs. Red and blue indicate bars represent samples from a blood bag and from a patient’s arm, respectively. Green and red colours in heatmap represent low and high expression of the miRNAs, respectively. More details about the miRNAs used for the heatmaps can be found in tables, respectively.
Discussion
Huge amount of RNA in erythrocytes
For a long time, erythrocytes have been thought to lack genetic material as compared with their progenitors, the reticulocytes.33 For a decade now, there is growing evidence that erythrocytes contain plenty miRNAs,34 35 even more than in other blood fractions.36 Hence, we focused our biomarker discovery on the most promising RNA family, the miRNAs. Final goal is the establishment of a stable and valid biomarker signature to detect ABD. In this study, erythrocytes were obtained from ECs and not from density gradients. Although, compared with whole blood, the percentage of erythrocytes in blood bag units, measured using the haematocrit value, is between 50% and 70%,37 because WBCs and platelets were filtered out. Most of the plasma and the conservation buffer CPD were removed down to a minimum of a few millilitres. Hence, it can be assumed that free plasma RNA does not make a significant contribution to the extracted total RNA and that the total RNA were gained mainly from erythrocytes. This study should further show that erythrocytes in fact contain a huge amount of total RNA including diverse miRNAs and typical eukaryotic 5S, 18S and 28S rRNA subfractions.38 These rRNA subfractions can be used in addition to calculate the RNA quality based on a Bioanalyzer RIN analysis, in order to use only biological blood samples with high RIN values for further analysis, whereas Chen et al could not find any rRNA subfractions.35
Unsuitable miRNAs as biomarker
After the successful RNA extraction from ECs, it was important to determine the natural variation of all miRNAs in healthy donors. Over a time period of 2 weeks, six ‘unstable miRNAs’ (eg, let-7g-5p) were identified and excluded from further analysis. Leuenberger et al, who investigated circulating miRNAs as biomarkers for ABD, discovered let-7g being one of the most affected circulating miRNA after blood transfusion.39 Together with our finding, it would not be advisable to use this miRNA as a biomarker, since it shows large natural arbitrary variation in gene expression.
Dilution factor of upregulated miRNAs
Since erythrocytes contain plenty of miRNAs and ABD is based on transfusion of ECs to increase the erythrocyte count in the body, this transfusion should also lead to a couple of increased miRNAs in the EC. Clearly, not all of the so far identified upregulated and increased miRNAs can be found in the body after transfusion due to dilution. A small blood bag of approximately 280 mL39 dilutes in the body with approximately 5.43 L of blood after Nadler’s formula for men.29
According to this formula, the dilution factor would be around 20 for one EC or only around 10 for two ECs. Only highly increased miRNAs will lead to a measurable difference in the miRNA profile of a treated subject. Although it is not only conceivable that miRNAs from the EC will increase the level of the miRNA in the body, it is also possible that erythrocyte and other cells, which have their origin in the body, respond to the blood or erythrocyte donation. Either the storage buffer, the increased erythrocyte count and/or the transfusion stress can change the miRNA gene expression.
Haemolysis
Several studies have shown that miRNAs in circulation are affected by haemolysis.27 36 40 41 Ruptured erythrocytes release their content into the plasma, which, depending on the haemolysis level, leads to a different miRNA signature.27 Therefore, haemolysed samples should be discarded out when searching for reliable miRNA biomarkers in plasma or serum. In this case, miRNAs have not been detected in cell-free plasma or serum but in whole blood and ECs where all cells were lysed. Hence, the haemolysis level should not have an impact on the miRNA profile when total RNA extraction is done from lysed samples.
Complex biomarker signature needed
The major goal of this study was to create a potential ‘biomarker signature’ of miRNAs in ECs in order to detect ABD. Therefore, miRNAs were selected according to their highly increased expression during storage and they should distinguish between fresh and stored blood samples. For creating such a ‘biomarker signature’, various parameters like timepoints, p value and fold-change were taken into account (figure 3A and B).
The use of a single biomarker would limit the specificity because of the numerous and complex underlying mechanisms of an autologous blood transfusion. Compared with the use of a complex biomarker signature, the likelihood of identifying doping sinners is strongly improved. A complex signature reduces false positive as well as false negative results.
In a follow-up study, the practicality and applicability of these biomarker signatures are currently being tested including actual ABD. The most promising single miRNA candidate was miR-5100. With an increase of over 120-fold change, there should not be a problem to detect this increase in the body after transfusion and is expected to be part of the final biomarker signature.
Conclusion
In conclusion, erythrocytes contain a huge amount of total RNA with a high miRNA fraction. The miRNA expression of 198 miRNAs was stable over two consecutive weeks, except for six miRNAs for creating the biomarker signature. After blood bag processing, consisting of filtration, addition of preservative solution and centrifugation, ECs revealed a highly different miRNA expression profile compared with fresh drawn blood. In addition, storage over a period of 6 weeks had an impact on six miRNAs. The biomarker search resulted in 28 differential regulated miRNAs after considering timepoints, p values and fold changes. The identified 28 miRNAs are the most promising ones for a prospective biomarker signature to detect ABD. These 28 miRNA candidates are tested and verified currently in a follow-up study, a human transfusion clinical trial in healthy sportsmen.
Acknowledgments
The authors acknowledge Dr med. Georg Wittmann from the Department of Transfusion Medicine, Cell Therapeutics and Hemostaseology, Ludwig-Maximilians-University Hospital, Munich, Germany for supporting the study.
References
Footnotes
Contributors AH, IR and MWP performed the conception and design of the study. AH, CW and RB were responsible for sampling. AH and BK performed data analysis. BK, IR, RH and MWP reviewed and revised the paper.
Funding The study was funded by the Federal Institute of Sports Science (Bundesinstitut für Sportwissenschaft, BiSp: AZ 070301/13).
Competing interests None declared.
Patient consent Not required.
Ethics approval LMU Ethics Committee—Ludwig-Maximilians Universität München; project no. 385-13.
Provenance and peer review Not commissioned; internally peer reviewed.