Article Text

Abstract
Background Although carbohydrate is the predominant fuel source supporting high-intensity exercise workloads, the role of fat oxidation, and the degree to which it may be altered by training status, is less certain.
Methods We compared substrate oxidation rates, using indirect calorimetry, during a high-intensity interval training (HIT) session in well-trained (WT) and recreationally trained (RT) runners. Following preliminary testing, 9 WT (VO2max 71±5 mL/min/kg) and 9 RT (VO2max 55±5 mL/min/kg) male runners performed a self-paced HIT sequence consisting of six, 4 min work bouts separated by 2 min recovery periods on a motorised treadmill set at a 5% gradient.
Results WT and RT runners performed the HIT session with the same perceived effort (rating of perceived exertion (RPE) =18.3±0.7 vs 18.2±1.1, respectively), blood lactate (6.4±2.1 vs 6.2±2.5 mmol/L) and estimated carbohydrate oxidation rates (4.2±0.29 vs 4.4±0.45 g/min; effect size (ES) 90% confidence limits (CL)=−0.19±0.85). Fat oxidation (0.64±0.13 vs 0.22±0.16 g/min for WT and RT, respectively) accounted for 33±6% of the total energy expenditure in WT vs 16±6% in RT most likely very large difference in fat oxidation (ES 90% CL=1.74±0.83) runners. Higher rates of fat oxidation had a very large correlation with VO2max (r=0.86; 90% CI (0.7 to 0.94).
Conclusions Despite similar RPE, blood lactate and carbohydrate oxidation rates, the better performance by the WT group was explained by their nearly threefold higher rates of fat oxidation at high intensity.
- Carbohydrates
- Metabolism
- Fat
- Physiology
- Training
This is an Open Access article distributed in accordance with the Creative Commons Attribution Non Commercial (CC BY-NC 4.0) license, which permits others to distribute, remix, adapt, build upon this work non-commercially, and license their derivative works on different terms, provided the original work is properly cited and the use is non-commercial. See: http://creativecommons.org/licenses/by-nc/4.0/
Statistics from Altmetric.com
New findings
Well-trained and recreationally trained athletes performed a high-intensity interval training (HIT) session with similar levels of rating of perceived exertion (RPE), blood lactate and carbohydrate oxidation.
Well-trained runners oxidised nearly three times more fat than recreationally trained athletes during HIT.
The greater capacity to perform high-intensity intermittent work is mostly explained by the higher fat oxidation rates in well-trained runners.
Introduction
Most Olympic sports events require near maximal sustainable energy output over <8 min. Unsurprisingly, preparation for such events tends to involve strategically programmed ‘key’ workouts consisting of high-intensity intermittent training, completed at work intensities above 90% VO2max. This training method is often termed as high-intensity interval training (HIT).
Oxidation of lipid (FATox) and carbohydrate (CHOox) meets energy demands during exercise across a broad range of intensities and durations. Endurance training is well known to shift energy reliance towards FATox during continuous exercise at submaximal intensities. However, relative and absolute contribution of FATox to energy demand is believed to decrease once exercise intensity exceeds 60–75% VO2max, presumably becoming negligible above approximately 85% VO2max.1–4 Consequently, great emphasis is placed on maximising CHOox for athletes competing in high-intensity endurance events.
Substrate oxidation is often estimated using gas exchange and stoichiometric equations; a technique known as indirect calorimetry. Indirect calorimetry is thought to be the gold standard technique for measuring whole body substrate metabolism, but has limitations. For example, when exercise intensity exceeds an individual's maximal lactate steady state, shifts in acid–base balance occur. During increased glycolytic flux, lactate accumulation in the contracting muscle moves to the extracellular fluid and increases [H+], which is buffered by [HCO3−]. This excess (non-oxidative) CO2 is excreted through hyperpnoea, elevating the VCO2. As a result, indirect calorimetry overestimates CHOox and underestimates FATox during high-intensity exercise.
Given these challenges, the contribution of fat metabolism to energy demand during HIT has been less studied.5 In the only study we are aware of, attempting to quantify FATox during HIT, Stepto et al5 had seven well-trained (WT) cyclists perform 8×5 min work bouts at 86±2% VO2 peak (60 s recovery intervals). They showed that muscle glycogen concentration decreased by 50% over the HIT session, with high rates of total CHOox declining from the first (346±62 μmol/kg/min) to the seventh (328±61 μmol/kg/min) repetition. FATox increased from 16±8 during the first to 25±13 μmol/kg/min during the seventh interval. While CHOox contributed the majority of energy for HIT in these WT athletes, FATox was not negligible, as typically believed.1 ,2 By our calculations, it provided more than 20% of the energy requirements for the fifth and seventh interval repetitions. This finding suggests that FATox rates at high exercise intensities may be more important for performance than typically thought.
Acknowledging the limitations associated with the assessment of substrate oxidation at high exercise intensity, and given the interest in substrate use for performance at high exercise intensities, the purpose of this study was to compare the energy metabolism and substrate use responses during self-paced high-intensity intermittent exercise as a function of training status in a group of recreationally trained (RT) and WT runners.
Methods
Participants
We compared nine RT with nine WT male runners performing the same self-paced HIT session. The Regional Ethics Committee for southern Norway and the Norwegian Social Science Data Services approved the study. All participants provided written consent to participate before testing. RT participants were active in a variety of sports and performed endurance-type training 2–4 times each week. WT participants included regional level distance runners and national level orienteers training 6–10 sessions weekly. All participants were familiar with treadmill exercise and HIT. Although this specific interval prescription was not familiar with either group, the WT group had more experience with HIT. No specific task familiarisation trials were performed. Participants were instructed to abstain from hard training the day before laboratory tests, and adhere to their normal diet (approximately 55–60% carbohydrates, 30% fat and 10–15% protein). Participants were asked to consume a normal meal 3 h prior to the laboratory sessions, and to refrain from alcohol, tobacco or caffeine consumption 3 h prior to exercise.
Preliminary testing
Approximately 1 week before their laboratory HIT session, participants performed a continuous treadmill test to exhaustion, to determine maximal oxygen consumption (VO2max), maximal heart rate (HRmax), velocity at the first ventilatory threshold (vVT1), velocity at the second ventilatory threshold (vVT2), peak blood lactate concentration ([ ]) and peak rating of perceived exertion (RPEpeak). EqO2 and EqCO2 were used to establish the ventilatory thresholds, using previously described methods.6 ,7 All sessions were performed on a motorised treadmill (Woodway ELG55, Weil am Rhein, Germany). The study took place during winter in Norway, and the outdoor conditions were snowy. To avoid unaccustomed high velocities, we performed all testing and interval sessions at a constant 5% incline. After a 20 min standardised warm-up, a continuous, progressive test to voluntary exhaustion was performed, as previously described.7 RPEpeak was determined at exhaustion using the 15-point Borg RPE scale.8 Blood was collected from a finger, 1 and 3 min after exhaustion, to quantify peak lactate concentration (Lactate Pro LT-1710, Arkay KDK, Japan).
High-intensity interval exercise
After preliminary testing, participants performed an interval session consisting of six work periods of 4 min duration separated by 2 min rest periods, based on previous studies in our laboratory.7 ,9 They were instructed, verbally and in writing, to maintain their highest possible average running velocity throughout the work periods. Participants controlled the treadmill velocity at all times during the interval session. Warm-up and interval session intensity control procedures by the participants has been previously described.7 ,9 Gas exchange and HR were measured continuously. RPE was determined at the end of each work period, while blood lactate was determined immediately after the first, third and sixth work periods.
Metabolic calculations
Energy expenditure (EE) and substrate oxidation were estimated for the interval session, including work and rest periods. Owing to the lack of equations for very high intensity (85–95% VO2max), we used equations for moderate to high intensity (50–75% VO2max) proposed by Jeukendrup and Wallis,10 to estimate the EE, CHOox and FATox, assuming negligible contribution of protein oxidation, for all calculations. Oxidation of 1 g of carbohydrate was assumed energetically equivalent to 17 kJ (80% glycogen, 20% glucose), while oxidation of 1 g of fat was assumed energetically equivalent to 40.8 kJ. Oxygen consumption (VO2) and CO2 production (VCO2) are expressed in L/min.


Statistical analyses
Data are presented as means, SDs and 90% confidence limits (CLs). To assess substantial differences between WT and RT runners, we used magnitude-based inferences by calculating standardised differences/effect sizes and 90% CIs using a modified spreadsheet.11 ,12 ES and both their associated qualitative inference likelihood descriptions were applied based on previously suggested ranges.11 ,12 Pearson correlation with 90% CL were used to establish the relationship between variables. The magnitude of correlation (r (90% CI)) between select variables was assessed using previously suggested thresholds.11 ,12
Results
Participant characteristics
Physical characteristics of the participants are presented in table 1.
Physiological characteristics of participants
As expected, WT runners ran at substantially higher maximum velocities, had higher ventilatory thresholds (VT1 and VT2) relative to their maximal oxygen consumption and reached higher maximal oxygen consumption values compared to RT runners.
Velocity selection and pacing comparison
The WT group self-selected a higher running velocity at a constant 5% gradient during the work as well as rest periods compared to the RT group. The average velocity (km/h) for the entire HIT session was 14.92±0.72 and 11.02±0.90 for WT and RT groups, respectively (ES (90% CL)=4.39±0.64; most likely very large). Running velocity and standardised differences between WT and RT groups for each respective repetition are shown in table 2 and figure 1.
Differences in running speed during the 6×4 min work periods (WP1–6) in well-trained (WT) and recreationally trained (RT) runners
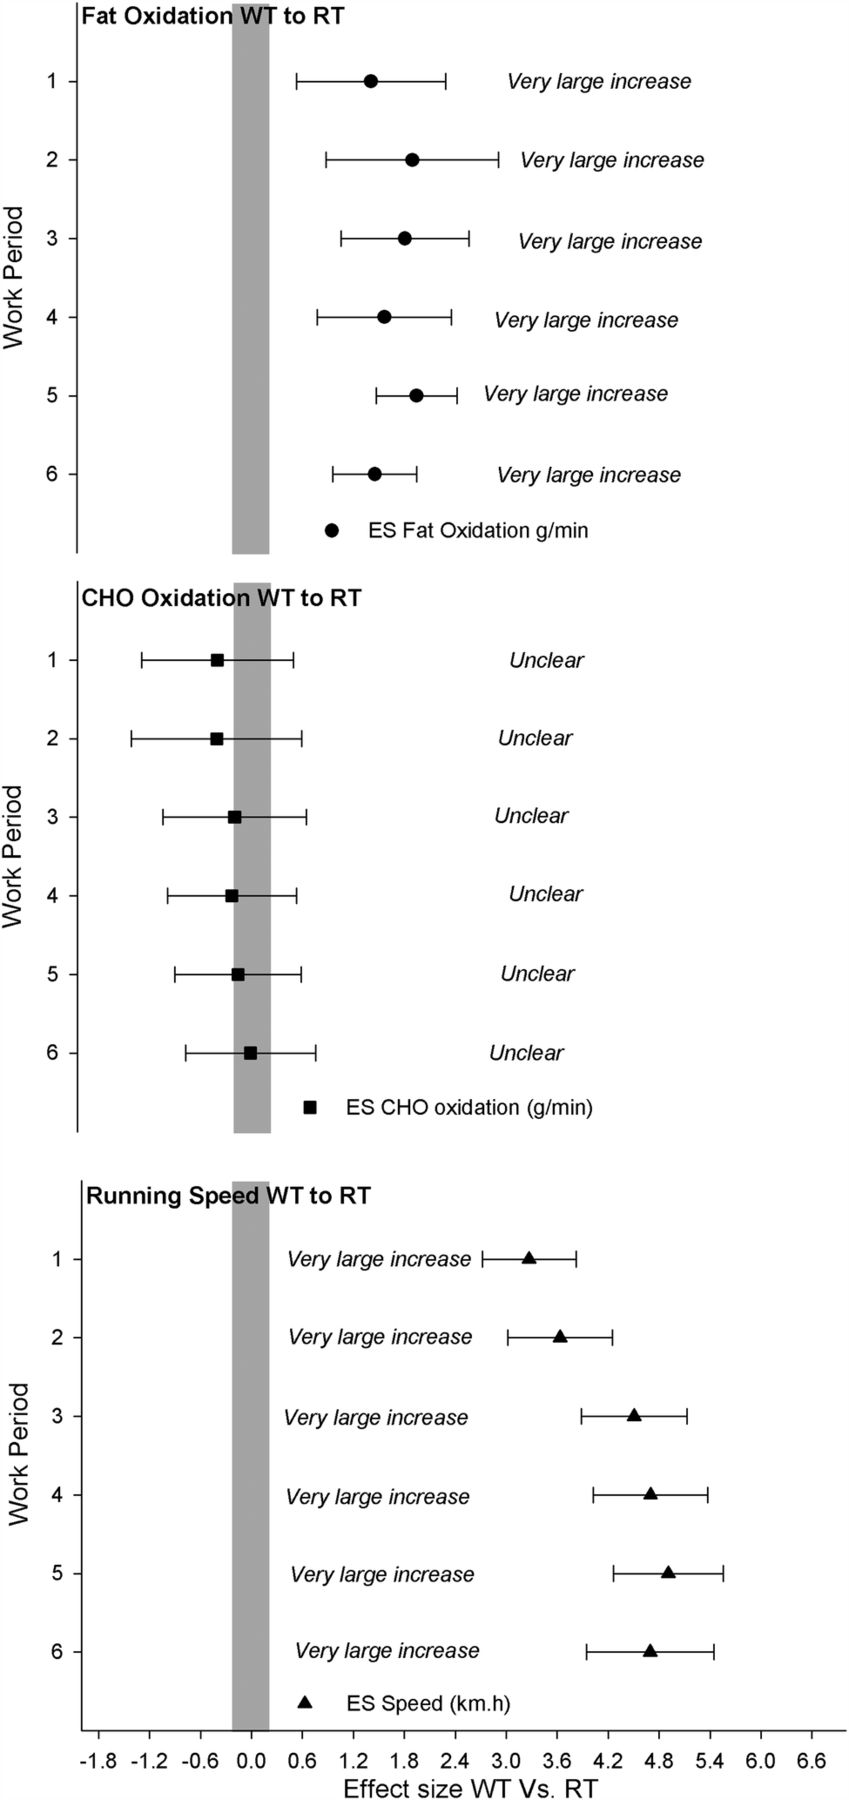
Standardised differences in fat and carbohydrate (CHO) oxidation rates and running speed between well-trained (WT) and recreationally trained (RT) runners during the high-intensity interval training sequence for each work piece (WP). Data are presented as mean and 90% confidence limits, with the grey bar representing the trivial effect size (ES) threshold. If 90% confidence limits overlap either the positive or negative trivial threshold, the outcome is deemed unclear.
Objective and subjective intensity responses
Mean responses during the HIT session can be seen in table 3.
Differences in WT and RT runners for physiological variables assessed during the high-intensity interval sequence
WT and RT performed the prescribed interval session with similar perceived effort and intensity. Blood lactate measurements taken throughout the interval session gave similar mean lactate responses for WT (6.2 mmol/L; 90% CL±0.91) and RT (6.4 90% CL±1.45 mmol/L; ES (90% CL)=0.02±0.06, unclear). Perceived exertion increased linearly in both groups from ‘hard’ on the Borg scale to ‘very hard’ by the last bout, with no differences in overall RPE between WT and RT groups (ES 90% CL=0.01±0.78; unclear). HR responses were also similar, with peak responses averaging 93–95% of maximal HR in both groups. However, the WT athletes performed the work periods at substantially higher relative oxygen consumption (94±4 vs 89±6% VO2max; ES (90% CL)=1.10±0.56, possibly moderate). Individual oxygen consumption peak responses varied from 89% to 100% VO2max in WT and 78% to 96% VO2max in the RT runners.
EE and substrate utilisation
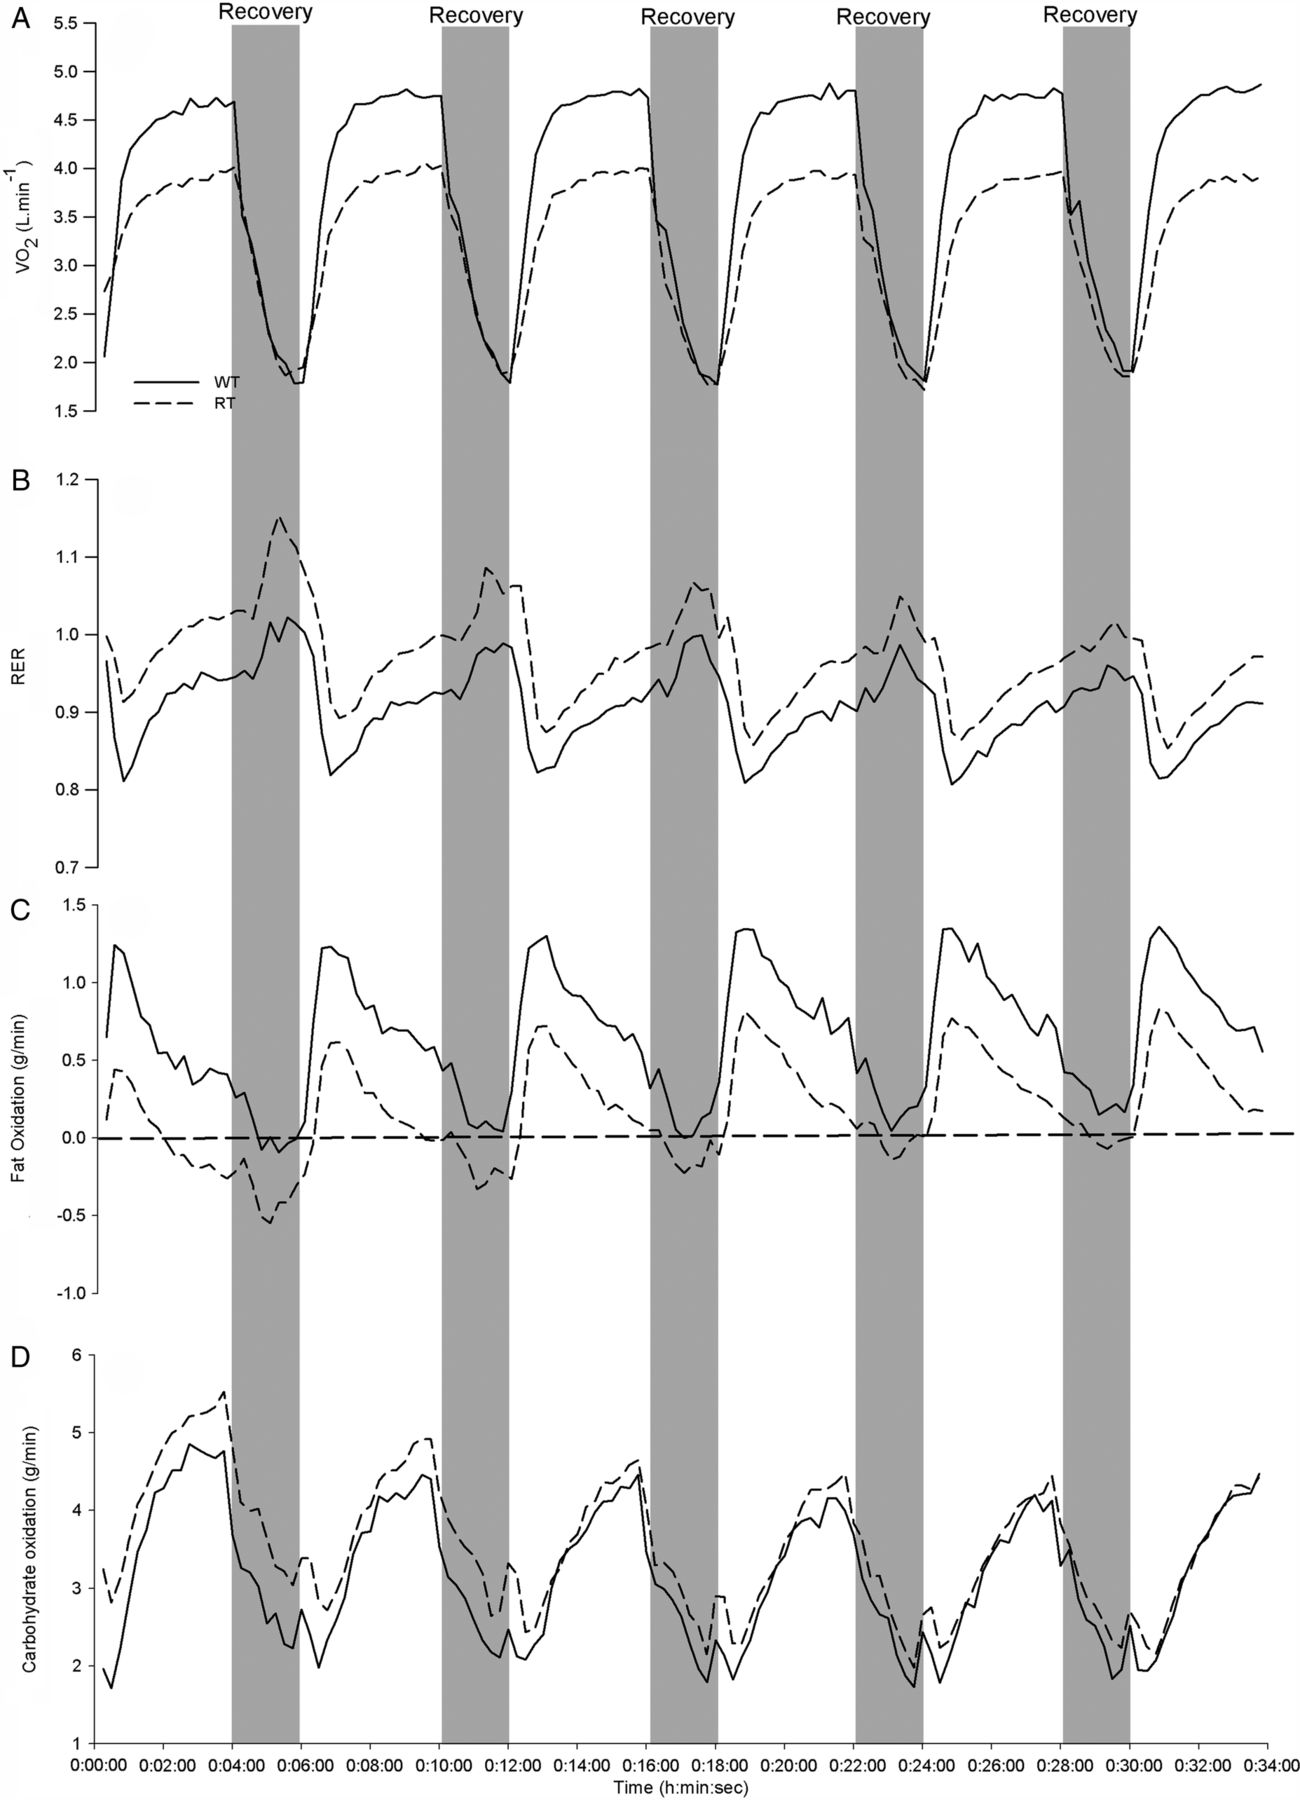
Figure 2 displays mean FATox, CHOox and respiratory exchange ratio (RER) during the HIT session for WT and for RT groups. Total EE for the interval session was predictably higher in the WT compared to the RT group (38.1 vs 28.6 kJ/kg, ES 90% CL=2.71±0.84). The higher EE observed in the WT runners was not due to greater CHOox (mean values WT (90% CL)=3.61±0.94 g/min vs RT=3.79±1.01 g/min; ES 90% CL=−0.19±0.85, unclear), but was explained more by markedly higher total FATox during the HIT session in the WT compared to RT group (mean WT (90% CL)=0.57±0.18 4 g/min vs RT=0.20±0.11 g/min; ES 90% CL=1.74±0.93, most likely very large), accounting for 33±6% of the total EE in the WT versus 16±6% in RT group. The standardised difference for each respective work item for fat and CHOox can be seen in table 4 and figure 1.
Differences in carbohydrate (CHO) and fat oxidation rates for WT and RT participants during the high-intensity interval training session for each WP1–6

Mean oxygen consumption (VO2), respiratory exchange ratio (RER), fat oxidation and carbohydrate oxidation rates during the high-intensity interval training sequence for well-trained (WT, solid-line) and recreationally trained (RT, dotted-line) runners. The grey bars show the 2 min rest period between each 4 min work piece. The horizontal dotted line on C represents zero fat oxidation.
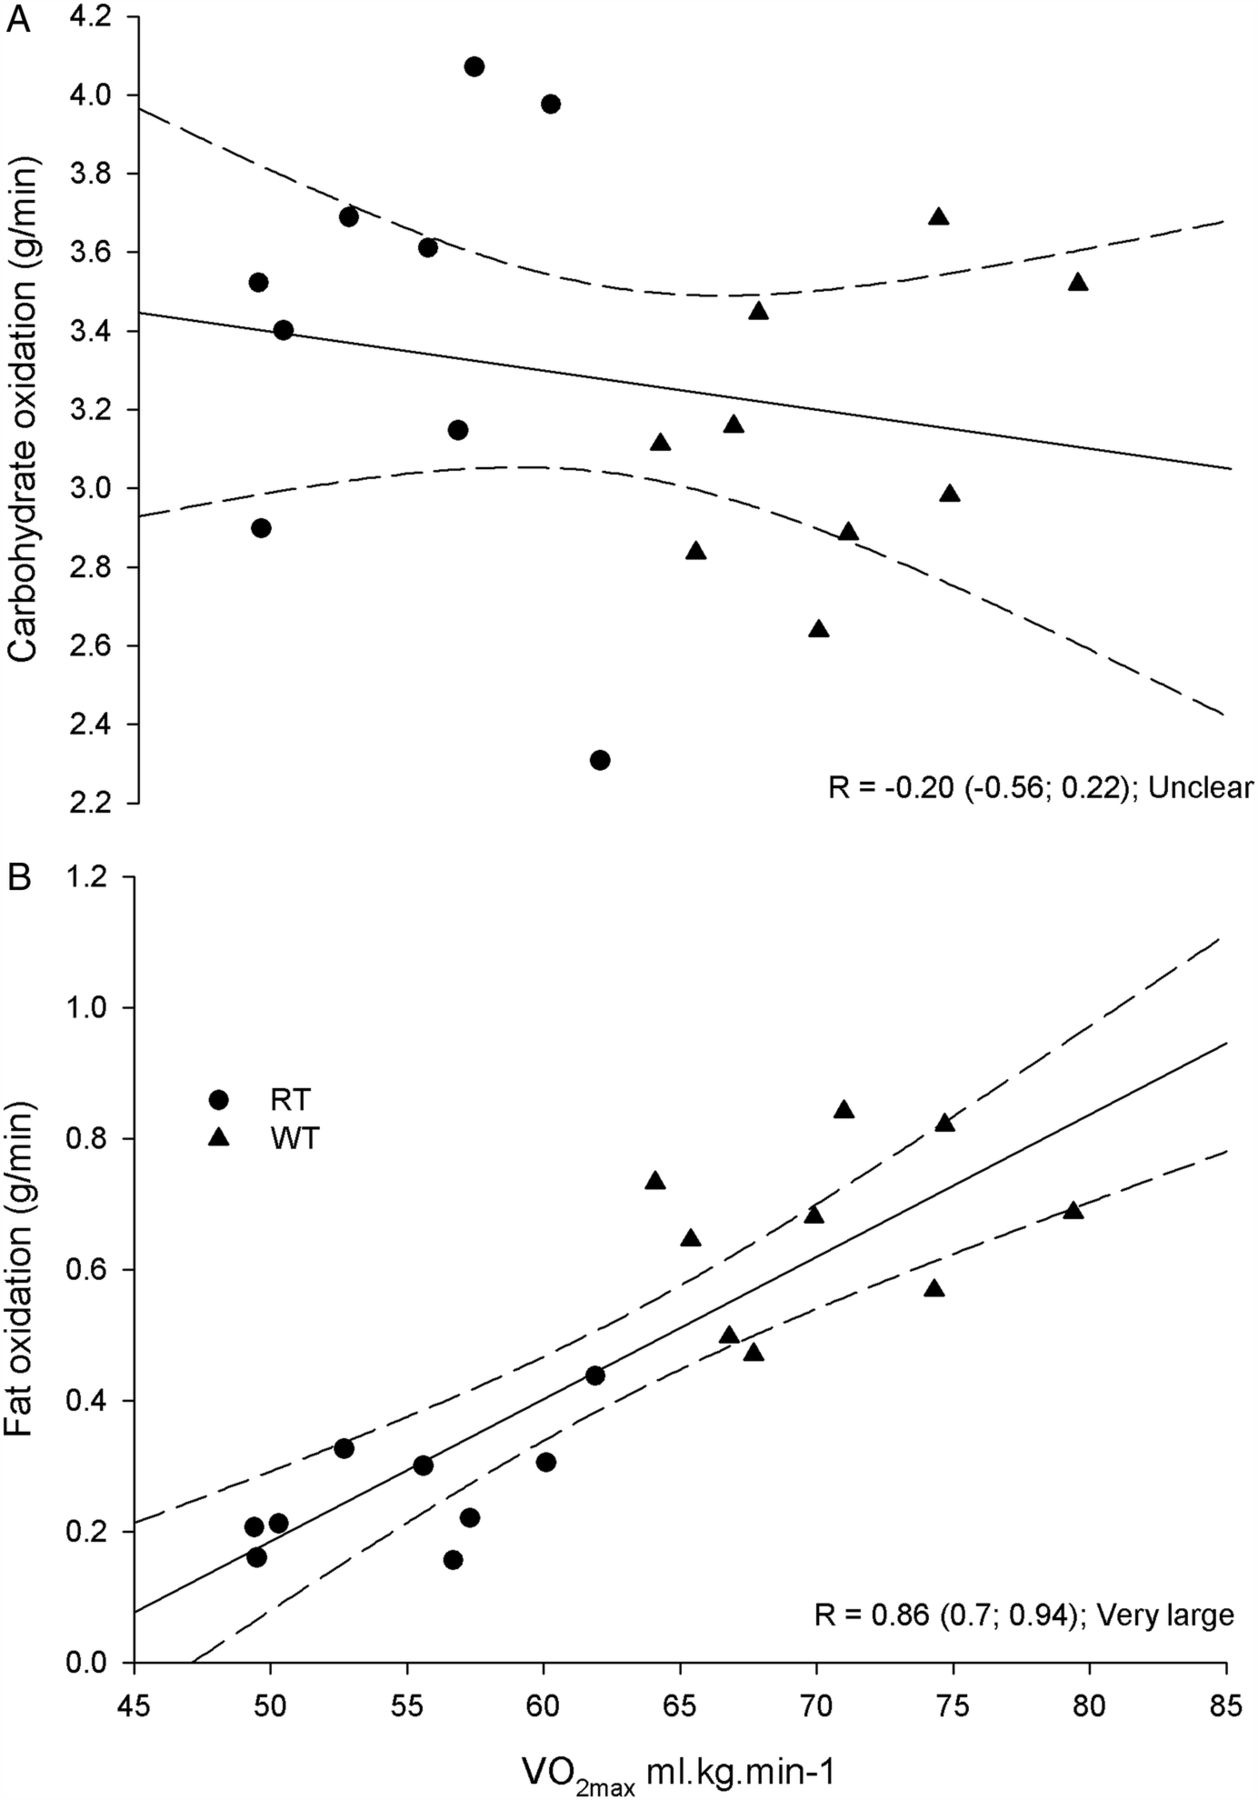
Figure 3 shows the high correlation between average rates of fat oxidation during the HIT session and individual VO2max (r=0.86, 90% CI (0.7 to 0.94); very large). Conversely, there was an unclear relationship between VO2max and CHOox measured over the same time period (r=−0.20, 90% CI (−0.56 to 0.22); unclear).

Correlations and 90% confidence limits (dashed line) between mean carbohydrate and fat oxidation rates measured during the high-intensity interval training sequence relative to the maximal oxygen uptake (VO2max) measured during the progressive exercise test in well-trained (WT, triangle) and recreationally trained (RT, circle) runners.
Discussion
Increased fat utilisation during exercise is a well-established adaptation to endurance exercise training. However, the role of FATox is often thought to be negligible above a work intensity of approximately 85% of VO2max.1 ,13 Findings from the present study challenge this assumption. Indeed, in WT runners with VO2max ranging from 65 to 79 mL kg/min, and running repeated 4 min segments at 14.9±0.7 km/h up a 5% gradient, fat oxidation contributed nearly a third of their total EE.
We asked the RT and WT groups to run at their highest sustainable running velocity throughout their 6×4 min segments, with 2 min recovery periods. Both groups performed these prescribed intervals just above their second ventilatory turn point (VT2), identified during preliminary testing (89 vs 83% for RT, and 94 vs 90% in WT), achieving comparable blood lactate concentrations by the end of the training session. Despite higher peak oxygen uptakes during the HIT work periods (94% vs 89%), and similar blood lactate values (6–7 mmol/L), FATox accounted for more than twice the EE for the WT versus the RT group. CHOox was virtually identical in the two groups (table 4 and figures 1⇑–3). The 30% higher EE sustained by WT during the 34 min intermittent high-intensity exercise session (table 3) was accounted for almost entirely by a higher rate of FATox (table 4 and figures 1⇑–3). Over the entire session, FATox in the WT group was 0.66 g/min (90% CL±0.17) compared to 0.26 g/min (90% CL±0.10) for the RT group. Sharp transitions in exercise intensity could confound metabolic calculations. However, using averages from the last 2 min of every work period, when VO2 and VCO2 measurements were most stable, did not affect the results for the WT group (0.66 vs 0.64 g/min), while only minor differences were seen for the RT group (0.26 vs 0.20 g/min).
FATox rates during HIT were very strongly correlated to VO2max across all runners (r=0.86; 90% CI (0.7 to 0.94)), while the CHOox–VO2max relationship across runners was slightly negative and unclear (figure 3). Absolute FATox rates observed (table 4) in WT performing high-intensity intermittent exercise are actually higher than typical ‘fat max’ values reported for steady-state exercise, identified at about 60–65% of VO2max.1 ,2
Several factors may reconcile the moderate to high FATox rates reported here, with some previous studies concluding that fat oxidation was negligible at 90% of VO2max.2 Studies estimating fat oxidation at low to moderate intensities generally have not used athletes with the same high VO2max as the WT participants here. The WT participants in the present study were highly trained runners, including elite orienteers training twice daily, with VT2 identified at 90±3% VO2max. Absolute FATox rates are constrained by the overall rate of EE. An athlete who can sustain 5 L/min oxygen uptake during repeated work periods, where RER averages 0.88, must oxidise considerable fat. The example above would yield a FATox rate ≈1.0 g/min using the equation proposed by Jeukendrup and Wallis,10 and assuming negligible protein utilisation. This is much higher than the maximal rates of fat oxidation (0.52+/−0.15 g/min) reported by Achten and Jeukendrup in trained men.2
Continuous, graded exercise protocols consisting of 3–5 min periods of exercise at increasing intensities have been frequently used to estimate maximal FATox rates in untrained to moderately trained participants. Using these protocols, RER typically approximates 1.0 by 90% of VO2max, supporting the assumption of negligible FATox beyond this intensity.1 ,2 However, we expect that the specific relationship between fat oxidation rate and exercise intensity is protocol-specific. Both the present study and that of Stepto et al5 show that RER declines with successive high-intensity work periods (see figure 2). We observed that most of this decline occurs between the first and second work periods despite maintained or elevated oxygen consumption and running speed. Similarly, blood lactate concentration typically increased to approximately 5 mmol/L after the first work bout in the WT runners, rising modestly over the next 5 work/recovery cycles to 6–7 mmol/L, suggesting a near steady state was achieved between lactate production and elimination during the interval session. Although we did not measure blood lactate concentration at the end of the rest periods, any changes during the 2 min rest periods would be small. In the RT runners, blood lactate concentrations did not notably change from the end of the first to the end of the sixth work period, in part due to the tendency of the RT group to reduce their pace by about 5% after the first 1–2 work intervals. Our calculated FATox rates closely match with those reported by Stepto et al in WT cyclists eating a normal diet.5 Their participants performed at a lower relative percentage (86%) of a lower mean VO2max, and used 1 min recovery periods between each 5 min work period. Also, the exercise mode of running has been shown to elicit a higher degree of fat oxidation compared to cycling at the same relative intensity.13 ,14
We have estimated fat and CHOox based on indirect calorimetry using equations proposed for ‘high-intensity exercise’.10 However, the intensity of exercise used in the present study exceeded the authors’ guidelines for these equations. Substrate utilisation calculations based on oxygen consumption and carbon dioxide release assume a steady-state exercise intensity where lactic acid production and elimination are in equilibrium such that bicarbonate buffering of H+ by HCO3− does not ultimately contribute to non-oxidative CO2 removal via hypernoea. Indirect calorimetry has been previously shown to be a valid method for quantifying rates of substrate oxidation up to about 85% of VO2max.15 The peak exercise intensities used in the present study exceeded 85% of VO2max and net lactate production exceeded total elimination throughout the interval bout in the WT group, albeit only slightly, after the first exercise bout. Stable CO2 production rates were seen in the WT as well as the RT groups after the first work/recovery cycle, suggesting that the chosen paces during work and recovery elicited a quasi-equilibrium of lactate production and elimination. Furthermore, although we did not measure the HCO3− pool, the relatively stable lactate concentrations seen after the first work period suggest it to be stable;16 ,17 a requirement for reliable estimations of fat oxidation from indirect calorimetry.15 While contamination of non-oxidative sources to the VCO2 values is possible, this potential source of error contributes to underestimation, not overestimation, of fat oxidation. We did not control the diet of the participants. All participants were instructed to consume their normal diet and consume their last meal ≥3 h before laboratory visits. While fasting status was not confirmed with blood testing, had participants consumed a high carbohydrate meal shortly before the interval training session, this would have had the tendency to decrease the contribution of FATox to total EE.
Our findings suggest that the capacity to oxidise fat at high exercise intensities is a supremely advantageous adaptation for endurance athletes. If the capacity for fat oxidation is important for athletes exercising at high intensities, and if it appeared to separate RT from WT runners, the logical progression would be to question how this quality might be enhanced. While beyond the scope of the present investigation, various forms of training intensity and duration,18–21 as well as substrate manipulation,22–24 should be examined as potential contributors.
In conclusion, we found that WT and RT runners perform HIT sessions at similar levels of perceived effort and blood lactate accumulation, and at comparable CHOox rates. The novel finding, however, was that higher fat oxidation rates explained the WT participants’ greater capacity to perform high-intensity intermittent work.
Perspective
Intermittent high-intensity exercise is both a powerful training stimulus and a challenging exercise method to perform. The present data suggest that RT and WT participants respond similarly, physiologically as well as perceptually, to the same interval prescription. However, highly trained participants sustain higher work rates with substantially greater fat oxidation rates, but similar CHOox rates, during intermittent high-intensity exercise.
Acknowledgments
The authors are grateful to the participants for volunteering their time and energy to this study.
References
Footnotes
Twitter Follow Paul Laursen at @PaulBLaursen
Contributors KJH designed and delivered the execution and write-up of the study. DJP contributed data analysis, figure drawing and write-up. EH contributed to study design and data collection. PBL contributed to data interpretation and write-up. SS contributed to study design, data interpretation and write-up.
Competing interests None declared.
Ethics approval Regional Ethics Committee for Southern Norway.
Provenance and peer review Not commissioned; internally peer reviewed.
Data sharing statements No additional data are available.