Article Text

Abstract
ACL injuries are among the most severe knee injuries in elite sport, with a high injury burden and re-injury risk. Despite extensive literature on the injury and the higher incidence of injury and re-injury in female athletes, there is limited evidence on the return to sport (RTS) of elite female football players following ACL reconstruction (ACLR). RTS is best viewed on a continuum aligning the recovery and rehabilitation process with the ultimate aim — a return to performance (RTPerf). We outline the RTS and RTPerf of an elite female football player following ACLR and her journey to the FIFA Women’s World Cup, including the gym-based physical preparation and the on-pitch/sports-specific reconditioning. We used the ‘control–chaos continuum’ as a framework for RTS, guiding a return above pre-injury training load demands while considering the qualitative nature of movement in competition. We then implemented the ‘RTPerf pathway’ to facilitate a return to team training, competitive match play and a RTPerf. Objective information, clinical reasoning and shared decision-making contributed to this process and helped the player to reach her goal of representing her country at the FIFA Women’s World Cup.
- Football
- female
- ACL
- rehabilitation
- performance
This is an open access article distributed in accordance with the Creative Commons Attribution Non Commercial (CC BY-NC 4.0) license, which permits others to distribute, remix, adapt, build upon this work non-commercially, and license their derivative works on different terms, provided the original work is properly cited, appropriate credit is given, any changes made indicated, and the use is non-commercial. See: http://creativecommons.org/licenses/by-nc/4.0/.
Statistics from Altmetric.com
INTRODUCTION
ACL injuries are one of the most severe knee injuries in professional sport. While injury incidence is low, time loss is substantial and the associated burden is high.1 There is a large body of research examining ACL injury mechanisms, associated risk factors and risk reduction in female athletes.2–4 At the amateur level, an estimated 32% of female football players do not return to sport (RTS), and those who do return to competition have a high re-injury risk, particularly to the contralateral limb.5
Contrary to expectation following ACL injury, many athletes fail to reach their previous level of performance.6 Potentially, this is due to the over-reliance on traditional time-based criteria for rehabilitation progression and RTS, which may overlook individual variation. Individualised rehabilitation should not only consider the specifics of the injury but should also take into account, and ideally quantify, the variability between player’s competitive demands, their cognitive, neuromuscular and mechanical response to the injury, and the consequent unloading and the subsequent response to components of reloading applied during the rehabilitation process.7
A performance-based rehabilitation process following ACL injury should aim to identify and resolve deficits in neuromuscular performance, providing conditioning of sufficient intensity, volume and specificity to prepare an elite athlete for the demands of their sport. A ‘return to function’ may therefore not be an appropriate paradigm for elite sport,8 due to the far higher demands imposed on these athletes. Additionally, sports science and medical practitioners are also under pressure to return athletes earlier than might be considered completely safe.9 Therefore, the integration and accumulation of adequate sports-specific loading and the use of objective tools to control and quantify load while monitoring the response are important means to mitigate the increased risk that is associated with an accelerated return. A performance-based approach should go beyond returning an athlete to their previous condition or simply integrating conditioning to rehabilitate the injury. Physical preparation should also aim to return the athlete with greater capabilities than pre-injury, while recognising certain aspects of performance may only fully recover after exposure to competition. As such, monitoring of neuromuscular performance should extend beyond RTS to characterise an athlete’s response to competition and their journey towards a return to performance (RTPerf).10
Currently, there is little published research describing the RTS or RTPerf process in elite female football players following ACL reconstruction (ACLR). In this article, we outline the gym-based physical preparation and on-pitch/sports-specific reconditioning of an elite female football player following ACLR, and her journey towards a RTPerf at the FIFA Women’s World Cup. We used the ‘control–chaos continuum’11 as a framework for sports-specific physical preparation and RTS. Within the RTS continuum,12 we also outlined an ‘RTPerf pathway’,13 which aids a progressive return to team training, competition and ultimately, a RTPerf.
CASE SCENARIO
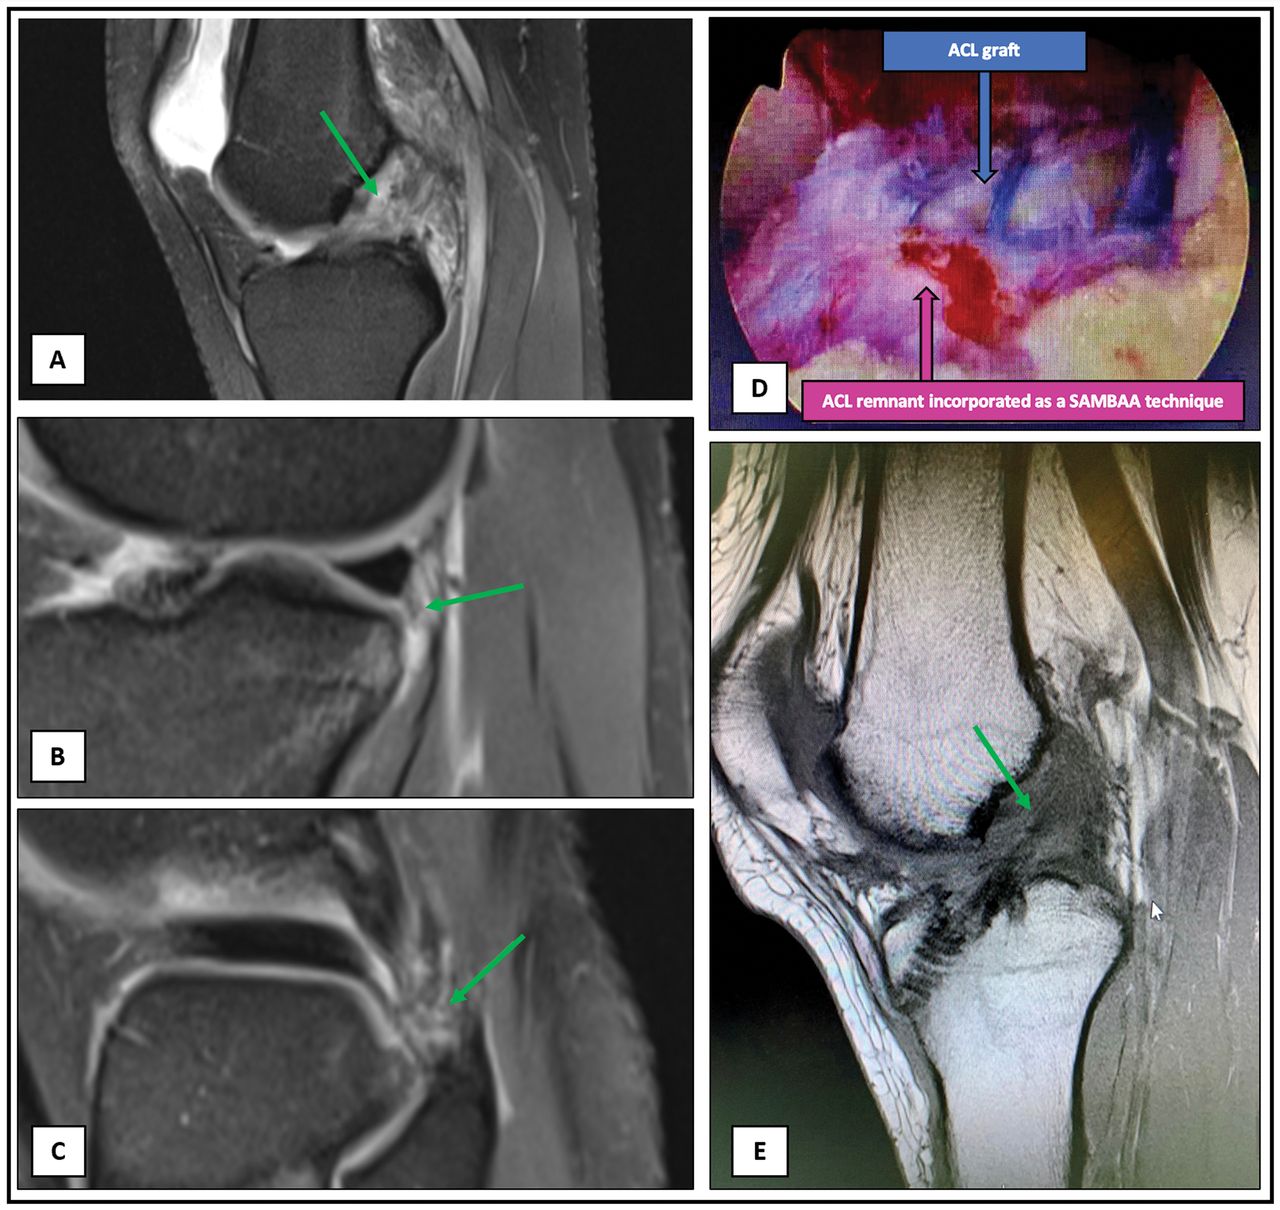
The 24-year-old female player, who gave informed consent for the use of her information was a New Zealand International central midfielder with 8 years of playing experience across the US collegiate system (2012–2016), Icelandic league (2016–2017), English Women’s Super League (2017–current) and at International level since 2011. She ruptured her left ACL in contact made during a tackle in an English Women’s Super League match. She was unable to play on or weight-bear in the immediate period following the injury. An MRI scan was performed 2 days later and revealed a mid-substance full-thickness tear of the ACL (figure 1A), along with a partial tear of the popliteal attachment of the posterior inferior meniscal popliteal fascicle (figure 1B) and a partial tear of the popliteofibular ligament (figure 1C). Ten days later she was assessed by a consultant Orthopaedic surgeon. She described no instability or locking symptoms but was uncomfortable weight-bearing. She also reported no previous injuries or family history of ACL tears.

MRI and intra-operative imagining following ACL injury and surgical repair. (1) Post-injury MRI; (A) T2 image showing acute mid substance ACL rupture with associated pivot shift related osseous contusion on the sulcus terminalis and along the posterior margin of the lateral tibial plateau. No osteochondral fracture or step deformity in either contusion region. (B) Acute partial tearing of the popliteal attachment of the posterior inferior meniscal popliteal fascicle. No associated lateral meniscal tear. (C) Acute partial tearing of the popliteofibular ligament. (D) Intra-operative image; pink arrow represents ligament preservation (SAMBBA type) technique used for the reconstruction preserving ~60% of the players original ACL, blue arrow represents ACL graft. (E) Post-operative (18 months) MRI; T1 sagittal image showing a grossly intact ACL reconstruction with evidence of ligamentisation. SAMBBA, single-anteromedial bundle biological augmentation.
Clinical examination revealed normal lower limb alignment, mild quadriceps atrophy and a persistent mild effusion. There was no joint line tenderness, and meniscal provocation tests were negative. Her range of movement was restricted from 10° to 80° flexion, in comparison with a hyperextension of 5° and flexion to 130° on her uninvolved limb. She had mild tenderness to palpation at the origin of the medial collateral ligament, but this was stable on valgus stress testing. Lachman’s and Anterior Drawer tests were positive. The pivot-shift test demonstrated a positive glide and the dial test was negative. There were no signs of generalised ligamentous hyperlaxity.
Sixteen days later (1 month post-injury), the player underwent ACLR once her effusion was fully resolved and she had regained full range of motion. Surgery was performed under general anaesthetic using a 7.5 mm four-strand autologous hamstring (semitendinosus and gracilis) graft that was prepared along its length with a #2-Fibreloop suture (Arthrex, Naples, FL, USA). A ligament preservation (single-anteromedial bundle biological augmentation type) technique14 was used for the reconstruction, which preserved about 60% of her original ACL (figure 1D). Suspensory fixation using a cortical button with an adjustable loop was used for femoral fixation introducing the graft into a femoral socket of 20 mm×7.5 mm within a total femoral drill length of 34 mm. An 8 mm×28 mm tapered biocomposite interference screw was used for tibial fixation (Arthrex) within a tibial tunnel with a diameter of 7.5 mm. There were no associated chondral lesions seen at the time of the arthroscopic surgery, and no meniscal tears (including root and RAMP tears) were observed following direct visualisation and probing. Post-reconstruction examination under anaesthesia produced a normal pivot-shift test and normal Lachman’s test. It was determined that the knee was stable and therefore it was not indicated to address the partial tears of the meniscal popliteal fascicle or popliteofibular ligament, with the expectation that these would heal non-operatively. Weight-bearing and range of motion were permitted immediately following surgery, and no brace was used.
The player’s RTS was viewed on a continuum, aligning her recovery and rehabilitation (figure 2)12 with the goal of returning her to full-team training/competition and an opportunity to challenge for World Cup squad selection. The main objectives of early management (0–4 months; figure 2), led by a club physiotherapist, were to minimise pain and swelling, resolve arthrogenic muscle inhibition, re-establish range of motion and limit muscle atrophy through early loading.15 Following this, reconditioning was integrated based upon the optimal loading concept — to maximise adaptation of the healing structures,16 while throughout the RTS process being mindful of the biological healing timeline, pain was assessed with a numerical rating scale and joint effusion, which were monitored daily.
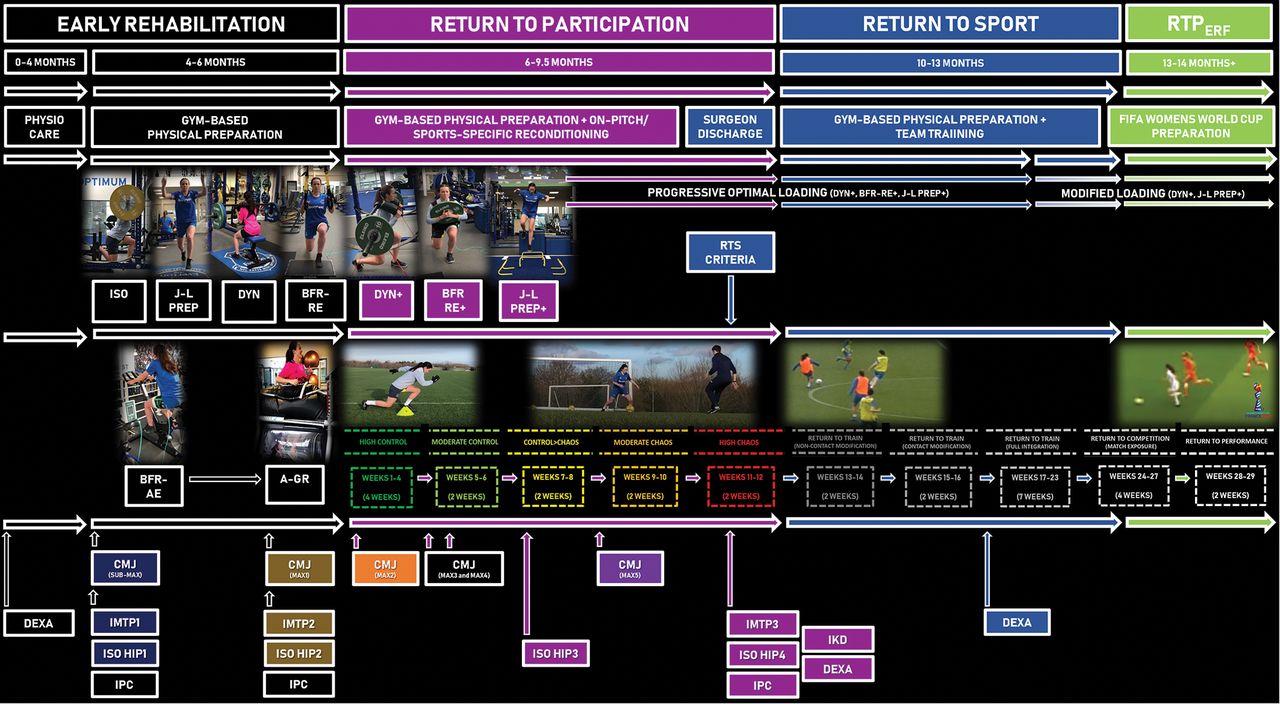
An overview of the return to performance (RTPerf) of an elite female football player following ACL reconstruction (ACLR). Early rehabilitation phase (0–6 months): early physiotherapy care (0–4 months), gym-based physical preparation (4–6 months) including isometrics (ISO), jump-landing preparation (J-L PREP), dynamic strength training (DYN), blood-flow restriction resistance exercise (BFR-RE) alongside blood-flow resistance aerobic exercise (BFR-AE) and anti-gravity treadmill running (A-GR). Return to participation phase (6–9.5 months); on-pitch/sports-specific reconditioning using the ‘control–chaos continuum’ (on-pitch weeks displayed) plus gym-based physical preparation; progressive dynamic strength training (DYN+), BFR-RE+ and J-L PREP+. With surgeon discharge and RTS criteria completed the player returned to sport and followed the RTPerf pathway (10–13 months; on-pitch weeks displayed), and progressive optimal loading continued (DYN+, BFR-RE+ and J-L PREP+) until the player reached the Women’s World Cup preparation period; optimal loading was then modified due to increased match play and maintained through an RTPerf at the FIFA Women’s World Cup (13–14 months+). During the RTS process, objective measures included the countermovement jump (CMJ — Submax; submaximal and Max; Maximal — colour coded in-line with Max test number — figures 4 and 5), isometric mid-thigh pull (IMTP; figure 6B), isometric hip strength (ISO HIP; figure 6A), isokinetic dynamometry (IKD) and DEXA (table 3) were used alongside daily assessment of pain (<2/10 numerical rating scale) and degree of joint effusion. DEXA, dual-energy X-ray absorptiometry; RTS, return to sport.
INFORMING PROGRESSION THROUGHOUT RTS
Strength and power diagnostic tests were used to assess and objectively quantify progress in strength and power qualities.11 17 Global Positioning Systems (GPS) data were used to plan and provide a quantitative assessment of on-pitch running load throughout the RTS process, following a return to on-pitch reconditioning. These were key elements of objective data that informed decision-making alongside clinical reasoning and experience.11
The dual-force platform double-leg countermovement jump (CMJ) was our core strength and power diagnostic test, used to characterise changes in specific neuromuscular qualities represented by eccentric (downwards), concentric (upwards) and landing phase force, impulse, velocity, power and centre of mass displacement variables and was also used to monitor load-response. As a component of squad preseason and in-season monitoring, the player was familiarised with the test, and importantly, her healthy pre-injury ‘benchmark’ data was available. The CMJ phase-specific variables and asymmetries (figure 3A,B and online supplemental appendix) derived from vertical ground reaction force time data are not joint-specific but are considered clinically relevant18 19 due to associations with knee kinetic deficits and function post-ACLR. While significant asymmetries are observed across the three phases of the bilateral CMJ following ACLR and other lower limb injuries, those in the CMJ eccentric deceleration (countering negative velocity during the downward phase) and landing (impact load absorption) phases, characterised as compensatory strategies to attenuate involved knee loading are especially persistent and of concern as post-ACL they are associated with poorer knee function.18 20–23 These asymmetries are however reported to be lower following semitendinosus-gracilis than patellar tendon autografts.24 We used the CMJ data (individual limb outputs and CMJ bilateral performance variables (table 1; figures 4 and 5), referenced to the player’s pre-injury values, to quantify early post-surgery deficits/compensatory strategies, then to monitor the response of targeted components of neuromuscular function to conditioning and to inform progression decisions.11 25 Gathercole26 characterised the jump height, peak power and variables typically reported in CMJ performance as CMJ-TYP, and those that quantify phase durations, and rates/or time-limited force, power characteristics or CMJ mechanics during eccentric and concentric phases as alternative variables (CMJ-ALT).26 27 It is well documented that changes in CMJ-ALT variables reflecting underlying neuromuscular/biomechanical ‘strategy’ alterations may not be expressed in CMJ-TYP and therefore are more sensitive to both acute and residual fatigue following competition or high-intensity fatiguing exercise.26 28 Conversely, positive adaptations to training may be detected by CMJ-ALT in the absence of significant changes in CMJ-TYP.26 29 While CMJ-ALT variables have been used to improve the detection of positive or negative adaptations to load and competition (‘load-response’ monitoring) in healthy athletes, recent evidence and case studies also indicate value in better characterising the status of the injured athlete and their response to reconditioning during the RTS process.10 22 30 31
Selected trends in countermovement jump (CMJ) bilateral, involved and uninvolved limb outputs, and interlimb asymmetries considered during the rehabilitation process: interpretation and influence on decision-making

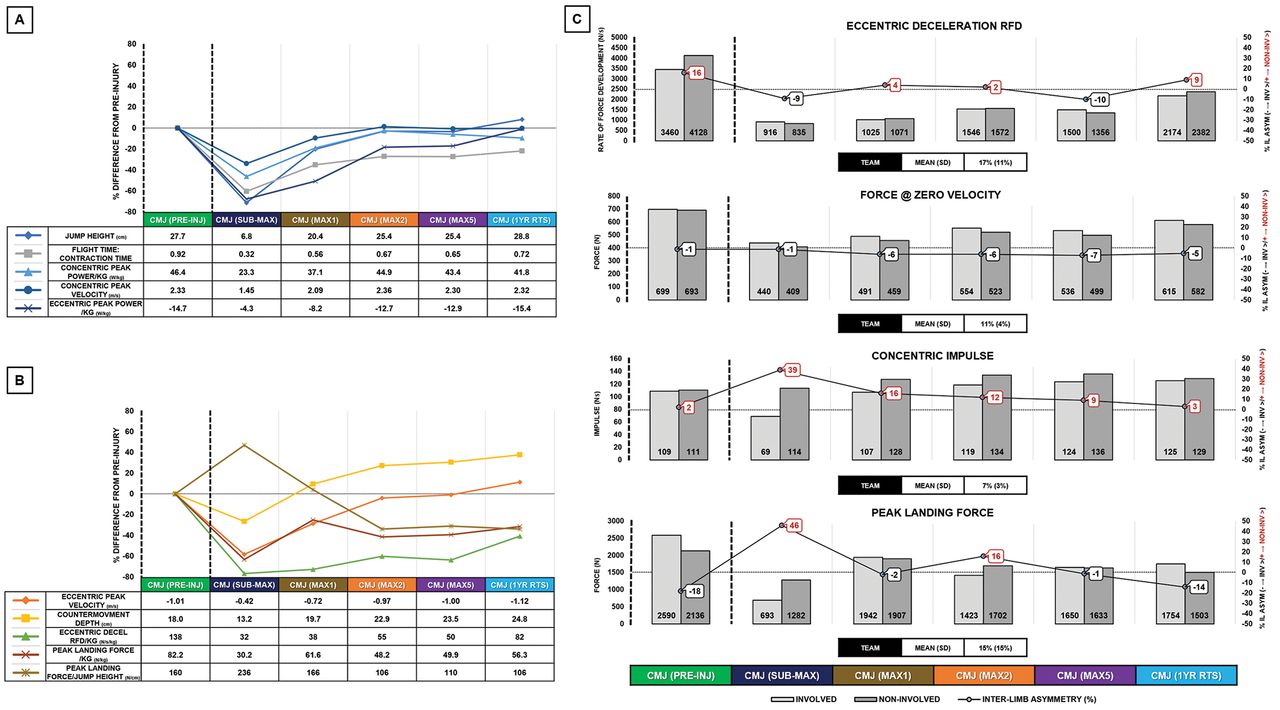
Countermovement jump (CMJ) force, velocity, power, displacement–time curves and selected variables and asymmetries. (A) Bilateral CMJ force, velocity, power, displacement–time curves and selected variables. Vertical ground reaction force–time, velocity–time, power–time and displacement (of centre of mass) –time curves during a sample CMJ, showing selected bilateral (combined limb) variables discussed in text, figures 4 and 5. Force (N) and power (W) are expressed as multiples of body weight (BW). Note that velocity and power during the downward ('eccentric') phase (unweighting→yielding→deceleration) are negative (see figure 5) but for visualisation purposes are shown here as positive. Con, concentric; Ecc, eccentric; ecc decel RFD=(average) rate of force development over the eccentric deceleration phase; Con Imp100=(net) concentric impulse 100 ms after the start of the concentric phase. (B) Bilateral CMJ involved and uninvolved force–time curves and selected asymmetries. Sample CMJ with involved, uninvolved limb force–time and combined limb vertical force–time and displacement curves in sample CMJ at Max2 with selected asymmetries highlighted. Shaded areas represent asymmetries in eccentric deceleration and concentric impulse asymmetries. Force (N) is expressed as multiples of BW. For definitions of variables and phases shown here and previous examples of use in athlete monitoring, see Gathercole et al,26 Cormack et al,28 Taberner et al,29 Harry et al 34 and Jakobsen et al 35

Trends in selected countermovement jump (CMJ) bilateral, individual limb variables and asymmetries at selected timepoints during rehabilitation and 1-year post RTS. Panels (A and B). Table shows values for selected bilateral CMJ variables for the player pre-injury (in-season; 2 months prior to injury) and in post-ACLR submaximal (Submax) and in the subsequent monthly maximal tests (Max1, Max2, Max5). Graph shows percentage change in variables relative to the pre-injury values. For the timing of tests relative to on- and off-pitch conditioning and phases (see figure 2). CMJ bilateral variables refer to variables derived from the total vertical ground reaction force data (combined individual limb outputs) during a bilateral CMJ performed on floor-embedded dual-force platforms, sampling at 1000 Hz (FD4000, Vald Performance, Brisbane, Australia). Panel (C). Absolute left and right limb values and interlimb asymmetries (ILAs) for selected variables during the performance of the bilateral CMJs in panels A and B. The team mean (SD) is ILA% measured at same time point as pre-injury for the player. Positive and negative ILA % refer to higher values on uninvolved limb or involved limb, respectively. Variables highlighted here are visualised in figure 3. Ecc, eccentric, Con, concentric; RFD, rate of force development; RTS, return to sport.
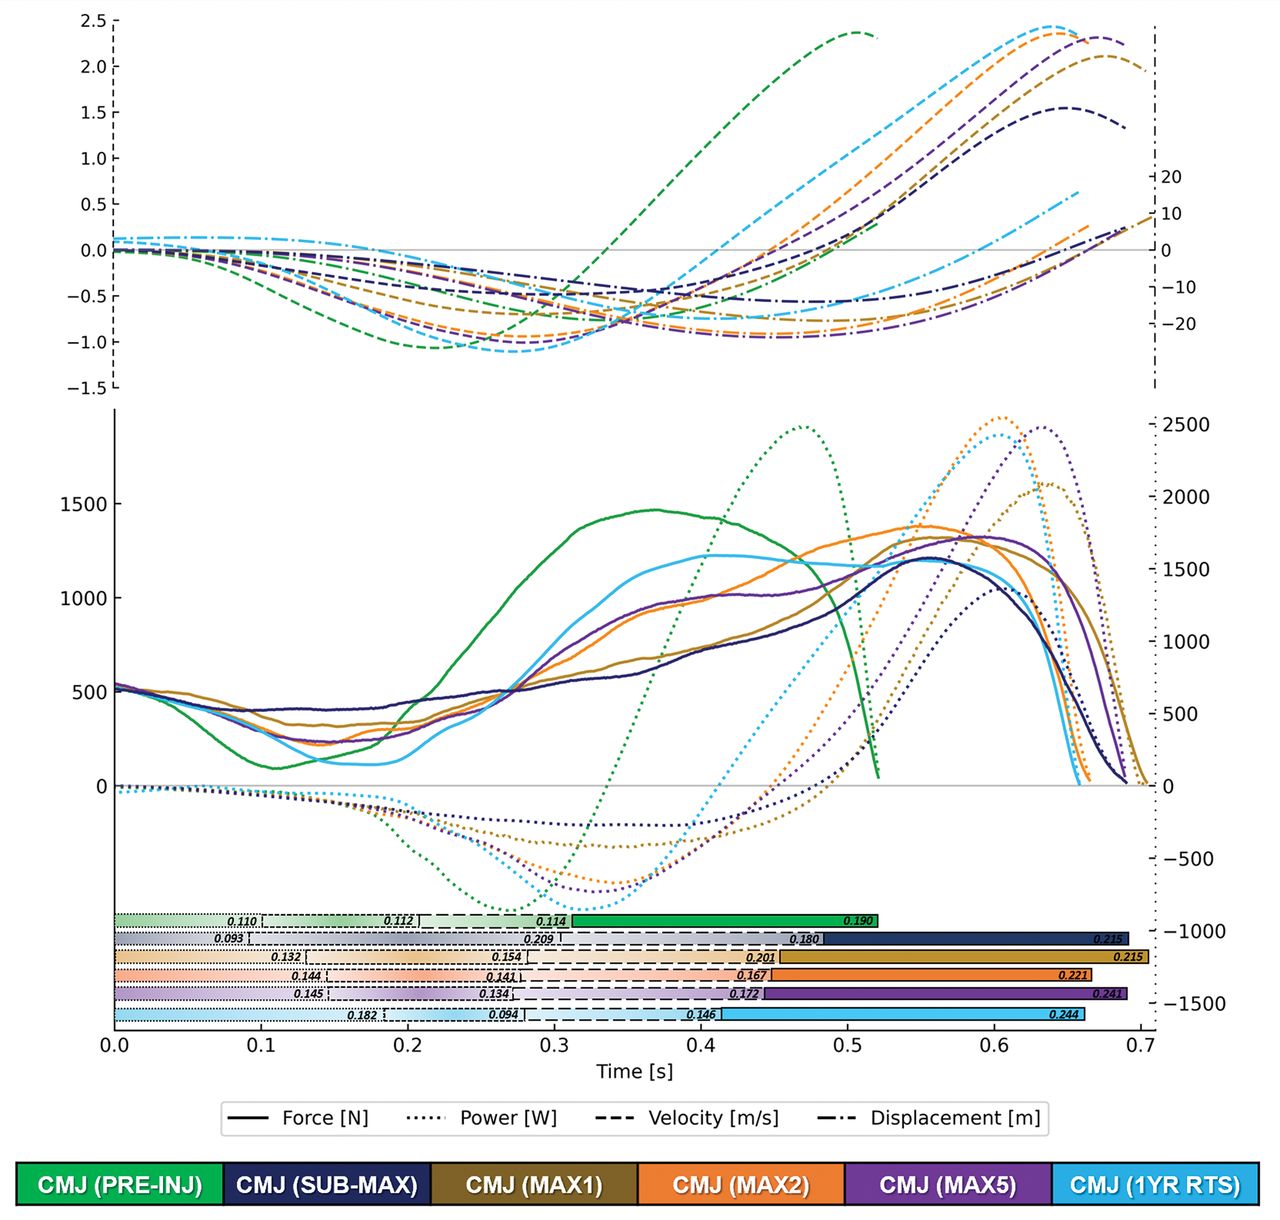
Countermovement jump (CMJ) take-off phase. Force (N)–time, power (W)–time curves (lower panel) and velocity (m/s), centre of mass displacement (cm)–time curves (upper panel) for the at pre-injury, at four time points during rehabilitation and 1- year after RTS (see figure 2 for test timing). Shaded horizontal bars (lower panel) show durations of downward ('eccentric') subphases: unloading (left gradient fill plus small dashed outline)→yielding (centre gradient fill plus medium dashed outline)→ deceleration (right gradient fill plus large dashed outline) and the concentric phase (solid fill plus solid outline). Numbers within the shaded bars are the duration of each phase (ms) at each assessment point. Also see figure 3 for an overview of the phases. The jump with the highest FT:CT is presented, taken from three trials of bilateral CMJ performed on floor-embedded dual-force platforms sampling at 1000 Hz (FD4000, Vald Performance, Brisbane, Australia). FT:CT, flight time:contraction time; RTS, return to sport.
Supplemental material
Baseline bilateral (individual limb outputs) and unilateral strength and power diagnostic test data were available for the player (figures 4 and 5). This is important in reducing dependence on interlimb asymmetry as a core indicator of progress and for RTS decision-making, potentially misleading due to performance decline in both limbs36 and the degree of pre-injury asymmetry in healthy players.22 However, if this data is not available, progress should be quantified not only by changes in % asymmetry but consideration of absolute trends in individual limb performance, in the context of overall (bilateral) outputs and loading demands — particularly in the eccentric (downward) and landing phases. Furthermore, frequent and early testing, more thoroughly quantifying response and progress throughout reconditioning, can provide greater confidence that the loading has stimulated the desired adaptations and driven progress in neuromuscular qualities, particularly in those identified in the literature to be most affected by the injury.
GYM-BASED PHYSICAL PREPARATION
Physical preparation during early rehabilitation (4–6 months; figure 2), return to participation (6–9.5 months; figure 2) and beyond RTS (10–13 months; figure 2) included a combination of strength training, jump-landing activities and blood-flow restriction (BFR) training.37 The conceptual goals of the gym-based programming were to (1) restore muscle mass and (2) develop concentric and eccentric strength qualities across the force–velocity spectrum (figure 6).

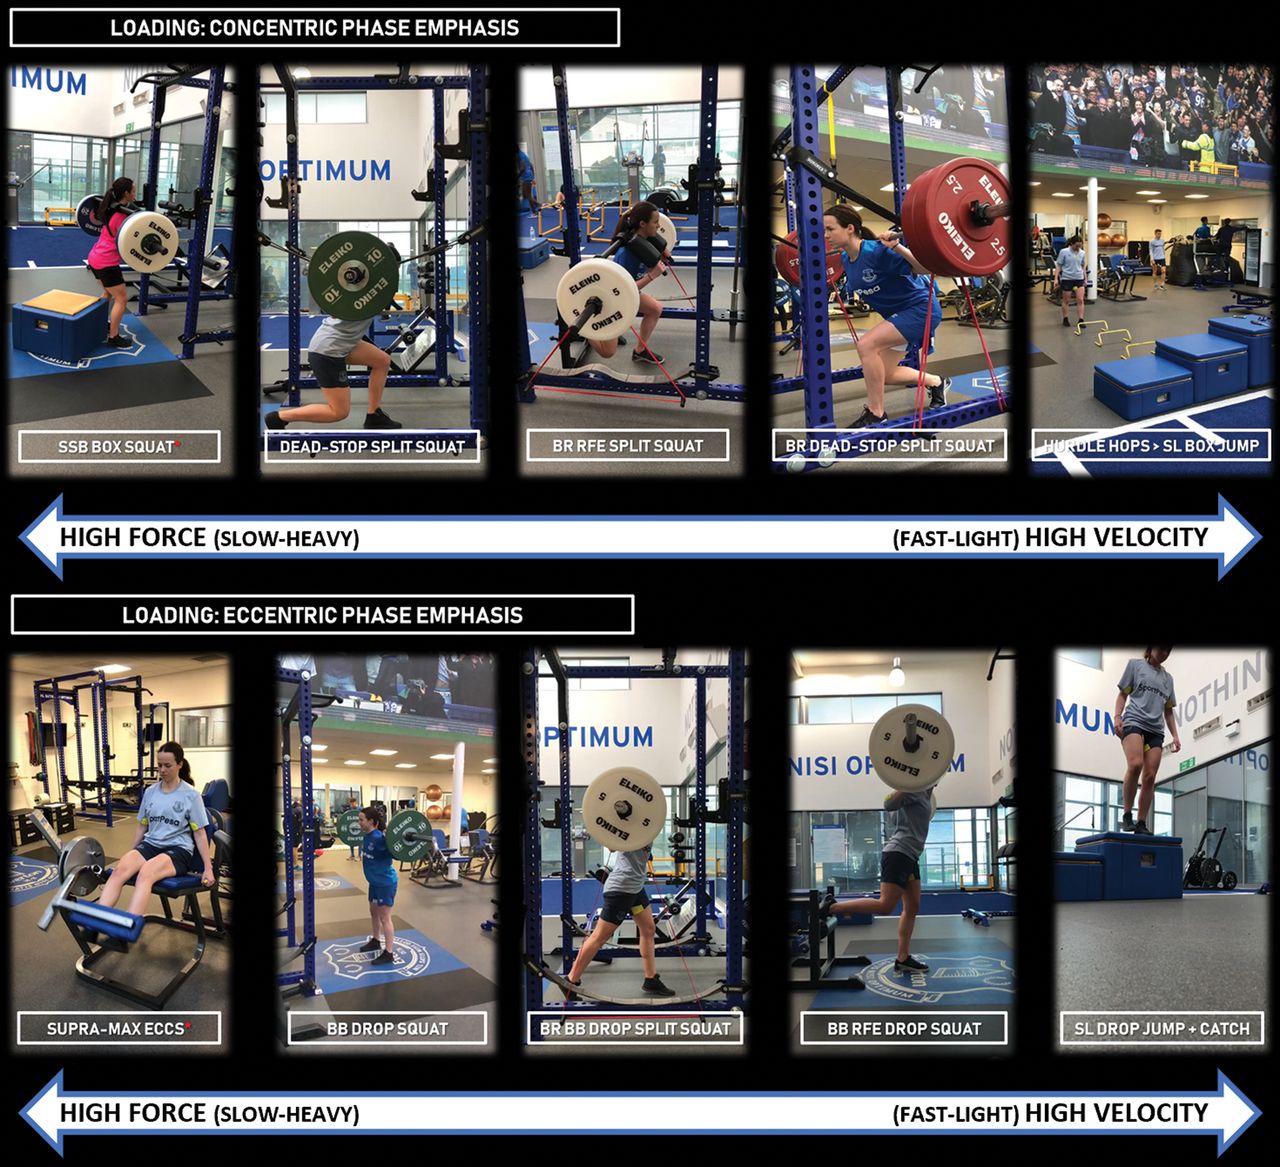
Dynamic strength training and jump-landing preparation approach to restore muscle mass, concentric, eccentric strength and rate of force development across the force–velocity spectrum following ACL reconstruction. BB, barbell; BR, band resisted; eccs, eccentrics; RFE, rear-foot elevated; SSB, safety squat bar; SL, single-leg; supramax, supramaximal.
Prior to beginning the early rehabilitation phase, the player performed a submaximal CMJ, providing early insights on strategy and willingness to load the knee dynamically and as a benchmark to assess the influence of physical preparation during the early rehabilitation phase (table 1; figures 4 and 5). The player also performed an isometric mid-thigh pull (IMTP) test (figure 7B), but with no pre-injury data for her, this assessment was only used to determine trends in the player’s maximal force-generating capacity and the associated interlimb asymmetries.
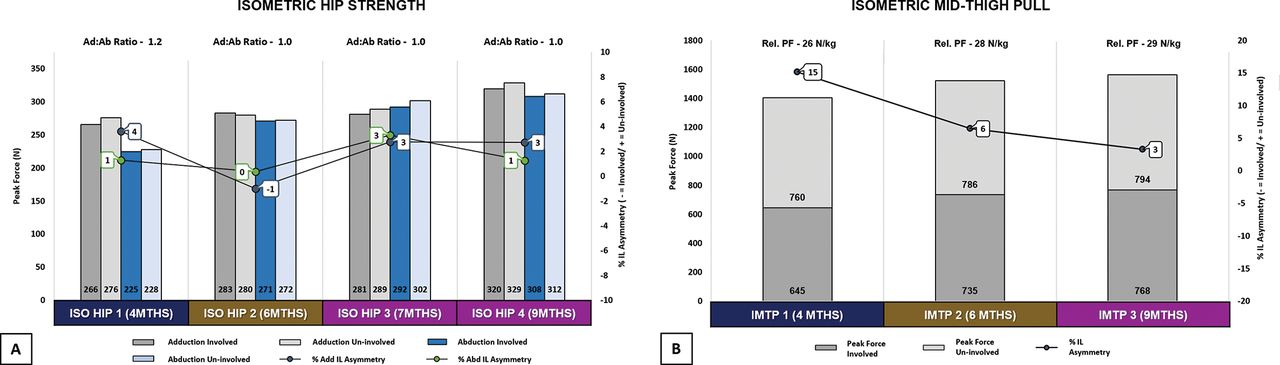
(A) Isometric hip strength (Ad and Ab) measured using the ForceFrame sampling at 50 Hz (Vald Performance, Brisbane, Australia) in a supine position at 45°, recording the maximum value out of 3×3 s maximum efforts (10 s rest between repetitions). Values within bars are peak force (N), % interlimb (IL) asymmetry for Ad:Ab measured at 4, 6, 7 and 9 months post-surgery (PS). (B) isometric mid-thigh pull (IMTP) measured 4, 6 and 9 months post-surgery using floor-embedded dual-force platforms sampling at 1000 Hz (FD4000, Vald Performance, Brisbane, Australia). Values within bars are absolute peak force (N) of the involved and uninvolved limb and relative peak force (Rel. PF, N/kg) is displayed above the bars (summed and expressed relative to body mass). For reference, mean (SD) for the player’s club first team (n=20): IMTP absolute peak force: 1708 N (140 N), Rel. PF: 27 N/kg (2 N/kg), peak force IL asymmetry: 11% (6%). Ad, adduction; Ab, abduction; ISO HIP, isometric hip strength; RTS, return to sport.
Strength training
In the early phase of reconditioning (4–6 months; figure 2), we included a combination of overcoming and yielding isometric exercises to develop strength in specific joint positions — emphasising hip and knee angles associated with the acceleration and stance phases of locomotion (figure 8A). Throughout reconditioning (4–9.5 months; figure 2), we progressively integrated dynamic strength training (figure 9; online supplemental video 1) using predominately closed kinetic chain exercises except for the leg extension — specifically to isolate eccentric knee extension.38 Strength training biased the involved limb, progressively using a higher volume in unilateral strength exercises (ie, 5:2 sets ratio).15
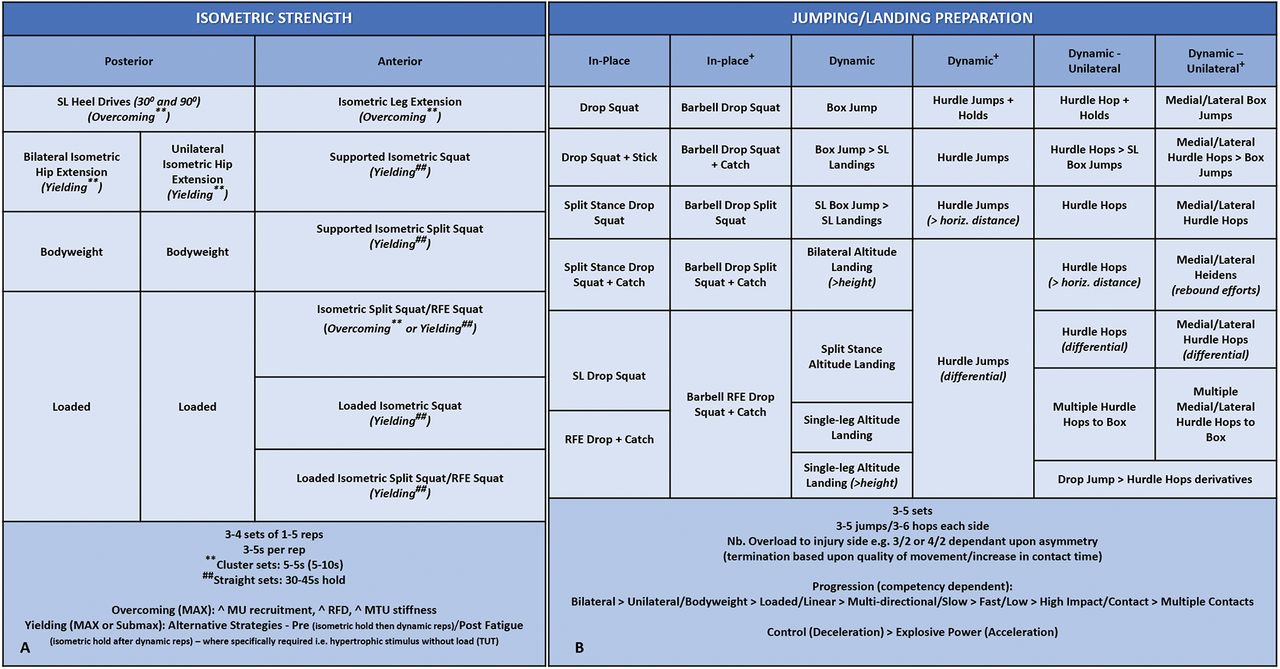
Isometric strength (A) and (B) jump-landing preparation following ACL reconstruction. Exercises become more demanding# as you move downwards through each column. #=Exercise demand related to intensity (intent, movement velocity), complexity, joint stress, contraction mode, stability demand (base of support/instability), position of load — therefore, demand can vary through each category based upon these factors. Overcoming=pushing/pulling against an immovable object, Yielding=holding a weight, and preventing it from moving (fixed position), ie, resistance to deformity.CT, contact time; DL, double-leg, ≥ progression; horiz., horizontal; Iso, isometric; Lat, lateral; MVC, maximal voluntary contraction; Med, medial; MTU, muscle-tendon unit; MU, motor-unit; RFD, rate of force development; RFE, rear-foot elevated; reps, repetitions; SL, single-leg; TUT, time under tension.

Dynamic strength, blood-flow restriction and accessory strength exercise selection following ACL reconstruction. Exercises become more demanding# as you move downwards through each column. #=Exercise demand related to intensity (%RM, movement velocity), joint stress, contraction mode, stability demand (base of support/instability), position of load — therefore, demand can vary through each category based upon these factors. BFR-RE, blood-flow restriction resistance exercise; BB, barbell; Con, concentric; CSA, cross-sectional area; DB, dumbbell; DL, double-leg; Ecc, eccentric, Early, early rehabilitation phase; End, end rehabilitation phase; Hip Dom, hip dominant; KB, kettlebell; Knee Dom, knee dominant; MB, medicine ball; PR, passive recovery; RDL, Romanian deadlift; reps, repetitions; RFD, rate of force development; RM, repetition maximum; SL, single-leg; STR, strength; W:R, work:rest ratio.
Supplemental material
As neuromuscular performance deficits at joints other than the knee are associated with ACL injury risk,39 40 we programmed accessory strength exercises (figure 9), and monitored isometric hip strength (figure 7A). ‘Imperfect training’ was also integrated into the player's programming to challenge joint centralisation and improve neuromuscular control (online supplemental video 1).
Jump-landing preparation
Significant CMJ eccentric deceleration phase and landing force asymmetries are observed following ACL and other lower limb injuries in professional players.22 23 31 41 Furthermore, in female athletes, higher peak landing forces in the drop jump, an indicator of a stiffer (lower flexion) landing, is a potential risk factor for secondary ACL injury.33 In addition, competitive elite football demands repeated high-intensity decelerations.42 Due to these injury-, sex- and sport-specific considerations, and the substantial variability in the progress of eccentric qualities and asymmetries described in professional male players between 6 months and 8 months post ACLR,31 we particularly emphasised training to promote recovery of deceleration and load acceptance qualities, using jump-landing activities and dynamic strength training (4–9.5 months; figures 2 and 8B; online supplemental videos 2 and 3). We considered it key to determine if this loading combination (figures 8 and 9) was effective in promoting these adaptations. CMJ trends between Submax and CMJ Max1 indicated a positive response to loading and improved deceleration qualities (table 1; figures 4 and 5) providing confidence in introducing exercises with higher deceleration demands and increasing load on the ACL aimed at developing explosive power.43 These included a combination of stretch-shortening cycle (SSC) exercises, beginning with ‘slow’ SSC (>250 ms ground contact, eg, single-leg box jumps), progressing to more demanding ‘fast’ SSC derivatives (<250 ms ground contact, eg, single-leg hurdle hops).
Supplemental material
Supplemental material
BFR training
We implemented BFR aerobic exercise during early rehabilitation (4–6 months; figure 2) and BFR resistance training progressively throughout reconditioning (4–9.5 months; figure 2) using a PTS ii portable tourniquet system with Easi-Fit cuff (Delfi Medical Innovations, Vancouver, BC, Canada). BFR promotes muscular hypertrophy and strength increases at a lower % of 1RM, a more tolerable format than heavy-load training in early phases of reconditioning44 also accelerating aerobic improvements.45 BFR resistance training was implemented in closed kinetic chain exercises, initially with support, which was then removed and external load progressively added (figure 9; online supplemental video 4). BFR aerobic exercise was integrated using static cycling with the involved limb occluded using 40% arterial occlusion pressure for three to four sets lasting 3–4 min <65% MaxHR (online supplemental video 4).44 45
Supplemental material
PROGRESSION TO ON-PITCH REHABILITATION USING THE CONTROL–CHAOS CONTINUUM
At 5.5 months post-surgery, alongside improvements in CMJ deceleration qualities and performance variables (table 1), the player had achieved one of our criteria for initiating anti-gravity treadmill running (Alter-G, Fremont, CA, USA) — an interlimb peak force asymmetry of <10% in isometric posterior chain (figure 10A) and IMTP tests(figures 7B and 10B).30 Running began at 60% body weight at 13 km/hour (3.6 ms-1), with intervals of three sets of 6 min (2 min active recovery), covering a distance of 3.5 km, progressing up to 90% body weight, at 15 km/hour (4.2 ms-1) (table 2). Large improvements in CMJ variables including eccentric deceleration rate of force development between Max1 and Max2 suggested positive adaptations to progressions in anti-gravity treadmill running, dynamic strength training and the load/velocity of deceleration and plyometric loading activities (table 1; figures 4 and 5).29
Typical weekly training structure prior to a return to on-pitch running

Isometric posterior chain test (A) measured using a portable force platform sampling at 1000 Hz (PS-2141, Pasco, Roseville, CA, USA) in a supine position at 90° hip and knee flexion and isometric mid-thigh pull test (B) measured using permanently installed force platforms sampling at 1000 Hz (FD4000, Vald Performance, Brisbane, Australia) with ideal angles of 175° at the hip — (replicating a 5° forward lean) and 145° at the knee (measured from head of fibula to lateral malleolus — greater trochanter).
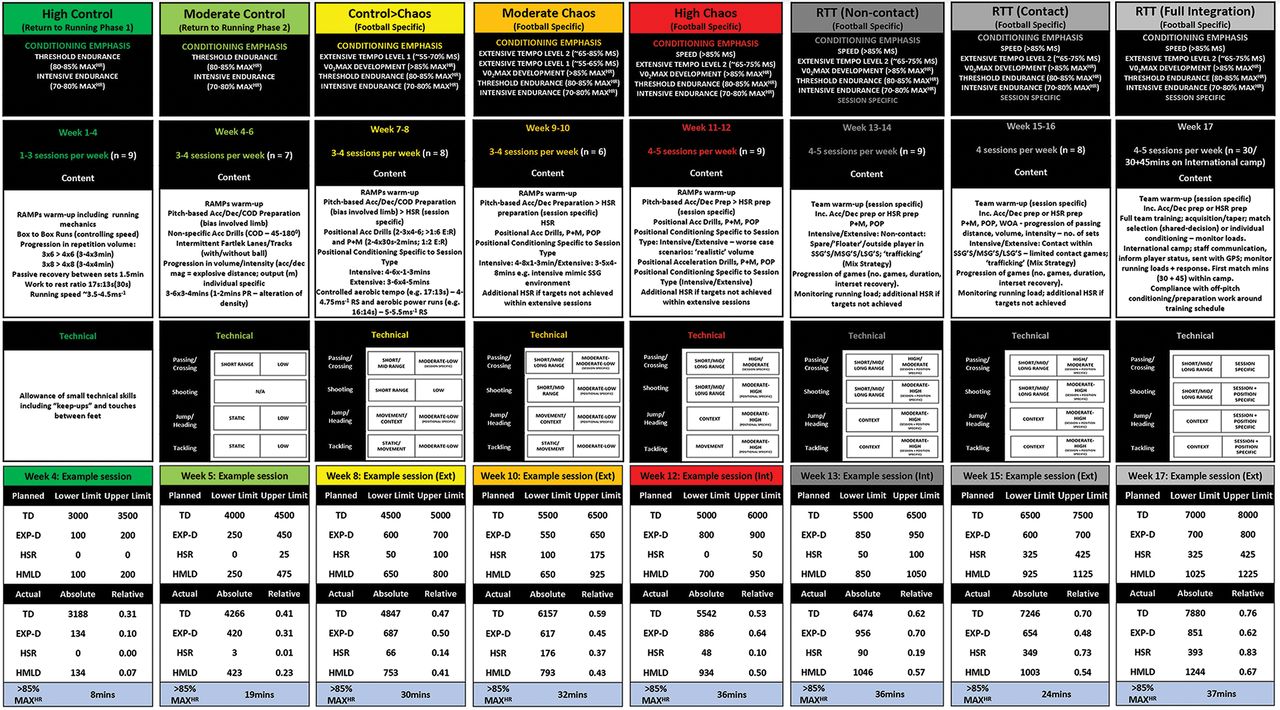
The plan for on-pitch rehabilitation adapted the five phases of the ‘control–chaos continuum’ (figure 11) to pre-injury GPS data, ACL rehabilitation–specific load considerations and ecological validity in relation to the team training environment (figure 10).11

Control–chaos continuum and return to training phase progression content including conditioning emphasis, no. of sessions, technical qualities and actual session running load targets (upper, lower and actual values).Acc, accelerations; COD, change of direction; dec, decelerations, magnitude (acc/dec)= intensity of the acceleration/deceleration effort; E:R, exercise:rest ratio; EXP-D, explosive distance (distance accumulated accelerating/decelerating, ie, from 2 to 4 ms-1 <1 s); Ext, extensive football session=training session that reflects typical match demands, using larger areas to produce higher speed and distances; **=gameload adjustable dependent upon injury specificity/severity; HSR, high-speed running (>5.5 ms-1; dwell time 0.5s); HMLD, high metabolic load distance (distance above 25 W•kg-1; sum of HSR and EXP-D); Int, intensive football session=training session that overloads the musculoskeletal system and specific energy systems through acceleration, deceleration and COD components in restricted areas; LSG, large-sided games; MS, maximal speed; MAXHR, maximal heart-rate; >85% MaxHR, minutes spent above 85% of maximal heart-rate; MSG, medium-sided games; POP, pattern of play; P+M, pass and move; PR, passive recovery; ‘realistic’, real-life representation of the volumes (distances/durations) the player is exposed to during training/match play; RAMPs, raise=elevate heart-rate, activate=activate key muscle groups involved in activity, mobilise=mobilise key joints involved during activity, potentiate; Specific=relevance of other acronyms in relation to the players actual sport/specific training session type; RS, running speed; SSG, small-sided games; TD, total distance; WOA, wave of attack. GPS, Global Positioning Systems (augmented 10 Hz Apex, StatSports, Belfast, UK).
High control
At 6 months post-surgery, on-pitch running began, under conditions of high control (weeks 1–4 on-pitch; figure 2). The phase aims are to establish a foundation for gradual increases in running volume (total distance) while minimising explosive distance (distance accelerating/decelerating, ie, from 2 to 4 ms-1 <1 s) and to assess the ability to cope with the running load.
Running speeds were arbitrarily limited to <60–65% of the players pre-injury maximal speed (pre-injury maximal speed; 7.59 ms-1, 60-65%=4.5–4.9 ms-1), limiting musculoskeletal and mechanical demands, and mitigating elevated soft tissue injury risk following prolonged absence. Sessions comprised of box-to-box runs (17 s) with walking periods to the edge of the 6-yd box and back as active recovery (13 s). Volume progressively increased from 3×6 repetitions (three sets of 3 min duration) to 4×8 repetitions (four sets of 4 min duration) with 1.5 min passive interset recovery, building progression into the moderate control phase (figure 11).
Between Max2 and Max3, CMJ bilateral variable trends (table 1; figures 4 and 5, Max3 data shown in the online supplemental appendix) suggested neuromuscular fatigue, but no pain or joint effusion was evident. Therefore, our clinical risk assessment was that the player was coping, and these CMJ trends did not warrant delayed transition to the next phase. The sensitivity of CMJ variables to neuromuscular fatigue means that performing an assessment up to 72 hours after intense loading can still result in the underestimation of the chronic improvements due to superimposed residual fatigue, potentially leading to a ‘false-negative’ interpretation of progress. However, an assessment may be deliberately timed to capture this residual fatigue response in terms of bilateral and individual limb (asymmetrical fatigue) to novel loading type, or increments, thereby providing valuable indirect information on the ‘cost’ of a session or series of sessions (this approach is described further and illustrated by data from Max3 and Max4 assessment data in the online supplemental appendix).
Player perspective: “It feels amazing” [to be back on the pitch] “It definitely gives you that lift to keep on going. Every injury is obviously hard on the person going through it and for the most part I have handled that aspect of it quite well”. “But I’ve had a big smile on my face being out on the pitch again, and I can’t wait to be enjoying my football again.”46
Moderate control
At 7 months post-surgery (weeks 5–6 on-pitch; figure 2), with the foundation laid for running volume progression, and no pain or swelling, we progressively introduced change of direction activities and running with the ball to increase movement variability. Within conditioning blocks to develop aerobic qualities, we targeted lower threshold high-speed running (HSR) exposure (5.5–6.9 ms-1), with session-to-session increments in volume (figure 11) involving embedded linear running with and without the ball in intermittent dribbling lanes. Low-level technical actions were also incorporated in drill content.11 Warm-ups integrated running mechanics, acceleration/deceleration and change of direction drills (online supplemental video 5).
Player perspective: The knee has showed really positive signs, no swelling, and has shown it is able to handle running.46
Supplemental material
Control to chaos
At 8 months post-surgery (weeks 7–8 on-pitch; figure 2), we introduced the football-specific weekly training structure with the intention of overloading game-specific demands.11 We continued the development of acceleration and deceleration qualities, programming higher-speed change of direction drills in warm-ups (online supplemental video 5). Within intensive sessions, we integrated position-specific acceleration/deceleration activities to replicate the explosive movement demands of match play and ‘pass and move’ drills to develop technical actions, progressively including more reactive passing and movement within drills (figure 11). Within extensive sessions, we progressively incorporated HSR, manipulating exercise:rest ratios to target the required energy systems (figure 11).11
Player perspective: (With regards to the importance of support staff in the RTS process) the biggest thing that an injury teaches you is who the good people are around you and who is with you. Those people are huge and will help you get through the injury. In recovery, you don’t always show your true emotions but having the right people around you help carry you through it. 46
Moderate chaos
At 8.5 months post-surgery (weeks 9–10 on-pitch; figure 2), the player entered the moderate chaos phase. Max5 CMJ data suggested continued improvement in the player’s willingness/ability to rapidly load and decelerate (table 1; figures 4 and 5), trends indicating a positive response to football-specific movements introduced in the previous phase. This gave us confidence in clearing her for an increased volume of spontaneous football-specific movements and the associated high-velocity deceleration/eccentric loading demands. Inclement weather meant only two pitch-based sessions were completed in the phase’s first week. We therefore adjusted the plan, implementing two non-weight-bearing cardiovascular conditioning sessions before reverting back to the planned running load progression in the subsquent week. We progressively increased both controlled and chaotic HSR volume, with increments determined by a combination of current rehabilitation running loads, chronic rehabilitation targets and the players’ gameload (figure 11).11 25 30
We introduced increasing position-specific 'pass and move' and 'pattern of play' drills, progressing the volume and intensity of technical actions and integrated support staff to challenge visual perception and spatial awareness (figure 11).11 Reactive elements were also introduced into positional speed drills’ increasing movement variability and exposure to higher risk conditions. We continued to place emphasis on the development of aerobic qualities, eliciting >85% MaxHR for 25–40 min per session, and chronic running loads were now above pre-injury training outputs(figure 11). Pretraining preparation and gym-based conditioning continued alongside progression of on-pitch rehabilitation within the players’ weekly training structure (table 3).
Typical weekly training structure during the on-pitch rehabilitation phase — ‘control–chaos continuum’: moderate chaos phase
Player perspective: First and foremost, of course, I want to get back playing for [club team]. But there is a big hope and dream that I can play in France come June. That keeps me going when I have those tough days. For me personally, this injury is a step back, but it is not the end of the world. There are plenty of people out there who deal with career ending injuries or illnesses so that realisation has made it easier to deal with.46
High chaos
At 9 months post-surgery (weeks 11–12 on-pitch; figure 2) and in the final phase of rehabilitation, we emphasised position-specific conditioning and progressive increments in running loads beyond pre-injury weekly training load outputs (figure 11).11 Conditioning emphasised position-specific speed/speed–endurance drills, with movement speed dictated by the speed/direction of passing and technical actions integrated into position-specific contexts, such as attacking and defending in one-on-one situations. Training durations were above both her pre-injury and the new coaching team’s typical levels, with finishing practice added at the end of sessions ensuring training of high-intensity technical actions.
RTS DECISION-MAKING
The player was involved in RTS decision-making discussions, ensuring she remained central to the process. Several criteria informed RTS and the return to team training decision (9.5 months; figure 2):
Absence of pain/swelling.
Having ‘trained enough’ (completed sufficient on-pitch rehabilitation to be prepared for team training) and achieving higher training loads than pre-injury (figure 12).
Integration of the required level of technical actions (aligned to the current coaching team’s training components).
Global consideration of strength and power diagnostic test data, including (1) achieving proposed thresholds of asymmetry for isometric strength and performance outputs; (2) consideration of trends in these asymmetries; (3) CMJ-ALT values in relation to player benchmarks and/or (if benchmark not available) trends in these variables; (4) phase-specific asymmetries — in the context of players pre-injury values, and sports-specific profiles post-ACLR and in healthy players15 19 20; (5) bilateral CMJ-ALT and individual limb force and impulse fatigue-recovery response following increments in sports-specific loading (see online supplemental appendix).
Achieving <5% asymmetry in lower limb muscle mass, and
Surgeon discharge.
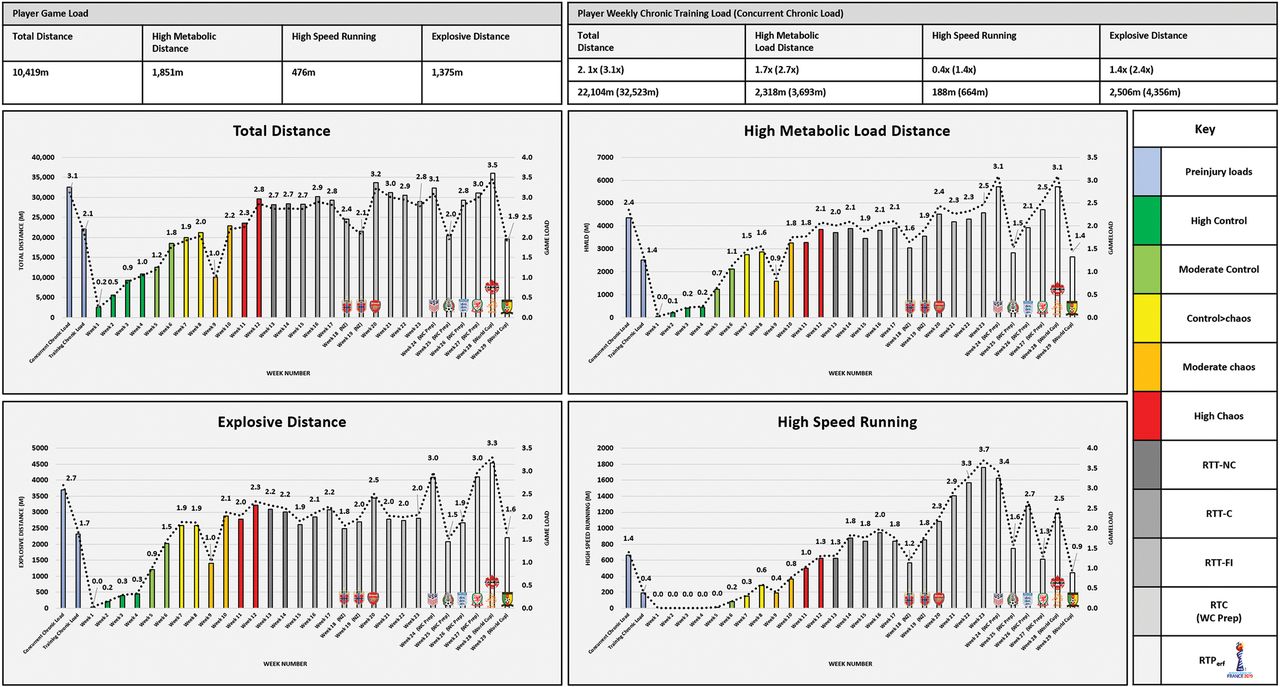
Player return to chronic running loads following ACL reconstruction using the control–chaos continuum and return to performance (RTPerf) pathway. Data representative of physical demands of game (mean) and respective training and concurrent (training + match) absolute and relative load (gameload, ie, 2×=2 games). EXP-D, explosive distance (distance accelerating/decelerating, ie, 2 to 4 ms-1 <1 s); HSR, high-speed running (>5.5 ms-1; dwell time 0.5s); HMLD, high metabolic load distance (distance above 25 W•kg-1; sum of HSR and EXP-D); TD, total distance. Green=high control (low intensity) moving towards red=high chaos (high intensity). Grey shades=RTPerf pathway; darkest grey=return to training: non-contact (RTT-NC), dark grey=return to training: contact (RTT-C), mid-grey=return to training: full integration (RTT-FI), light grey=return to competition (RTC) World Cup preparation (match exposure) — the phase leading into a return to performance (FIFA Women’s World Cup), badges indicate competitive opposition within each week. Global Positioning Systems (augmented 10 Hz Apex, StatSports, Belfast, UK).
The player reported minimal pain (<2/10 on the numerical scale), and no signs of joint effusion. Involved limb muscle mass (dual-energy X-ray absorptiometry) was above pre-injury with an interlimb asymmetry of 3%(table 4). Isokinetic concentric knee extension (@ 600/s) limb symmetry index was <12%, below the criterion <15%.47 Isometric hip strength showed small improvements compared to 5 months post-surgery in global adduction/abduction strength (3% and 2% limb symmetry index respectively; figure 7A) but larger relative improvement in hip abduction (adduction: abduction ratio — 5 months post-surgery: 1.2, RTS: 1.0), a desirable outcome for athletes returning after ACLR.39
Anthropometric and dual-energy X-ray absorptiometry information pre-injury, post-surgery, pre-return to sport (RTS), return to training full integration (RTT-FI) and prior to World Cup preparation (pre-WCP)
Table 1, figures 4 and 5 outline key CMJ data informing RTS decisions. Theoretically, reconditioning should recover both CMJ-TYP and ALT variables, with the latter recovering more slowly.22 30 However, the player’s countermovement depth was substantially greater than pre-injury, indicative of reduced stiffness and potentially representing a positive outcome from a re-rupture risk perspective,33 but also limiting the improvement in eccentric phase kinetic variables indicative of neuromuscular efficiency/SSC performance including: eccentric duration, eccentric deceleration rate of force development, eccentric peak power and flight time:contraction time (see online supplemental appendix for further explanation). It is important to note that in the context of load-response monitoring in healthy athletes, trends such as these, and specifically decreased flight time:contraction time has been associated with reduced HSR performance.48 However, these decrements were attributable to residual neuromuscular fatigue as opposed to a chronic alteration in jump strategy, which appears to be the case in the present player. Potentially, this apparent reduction in neuromuscular efficiency/SSC was compensated for by greater strength capacity, as at RTS the player had achieved a new maximal speed (8.2 ms-1; week 11 on-pitch; high chaos — session data quality: HDOP 0.4/no. of satellites 20), indicating that this CMJ strategy change did not negatively affect her high-velocity running performance — a priority of rehabilitation and marker of RTS success. The CMJ is used to unmask and quantify avoidance strategies and assess responses to loading throughout rehabilitation, while pre-injury CMJ kinetic ‘benchmarks’ should be considered alongside potential strategy changes and on-pitch performance, rather than an independent goal of rehabilitation.31
SETTING A PATHWAY TOWARDS RTPERF
At 9.5 months post-surgery, using the ‘RTPerf pathway’ to guide a phased approach to full-team integration,13 the player returned to team training. Players often experience a ‘trafficking’ effect upon reintegration; a sensation of high cognitive load with little space and time to manoeuvre following a long period without intense interaction with other players.13 49 A period of neurocognitive re-adaptation is required to re-accustom the player to these situations (figure 11).13
Player perspective: It has been a hard journey, but the last 3 months have been really good, and now I’m actually back with the team.46
RETURN TO TRAINING
Non-contact
Following discussion with the coaching staff, we integrated the player back into modified training (weeks 13–14 on-pitch; figure 2) emphasising contact avoidance and modified training to ensure progressive player interaction (figure 11).13 Modifications included being a link-player on the periphery of the small-, medium- and large-sided games, progressing to a ‘floater’ (spare player) to increase interaction with other players. This 2-week phase involved stable overall running load and a small increment in HSR volume (figures 11 and 12). As we anticipated, the players’ internal response (>85% MaxHR) during the first week of her return to training was greater than the final phase of rehabilitation (151 min compared to 117 min) despite a higher running load in week 12 on-pitch. The increasing level of player traffic and associated cognitive load possibly increased sympathetic drive, resulting in an increased heart-rate response.50 51 However, in the second week of the player’s return, the increased internal response attenuated (103 min), suggesting possible adaptation to the increased cognitive stimulus.
Player perspective: Now I’m actually back with the team, so I think that’s the best part about it, you get sick of being by yourself and sick of playing against your coach, I’m a bit bored of that now, I’m ready to have the team involved and to get back playing.52
Contact
During this phase, we introduced, and progressively increased, exposure to contact (weeks 15–16 on-pitch; figure 2) with subtle training restrictions, for example switching between a 'floater' and full-integration options to deliver gradual, controlled full training exposures within game-based elements (figure 11; online supplemental video 6).13 Frequent communication with the coaching staff also ensured that required technical skills were refined such as ‘pass and move’ and ‘pattern of play’ drills with increasing passing distance and touch number restrictions. If not feasible, additional fine-tuning of these skills was done with the assistant coach, developing the player–coach interaction.53
Player perspective: Following the draw for the Women’s World Cup, the player national team was drawn in the same group with some of her team-mates at a club level, this gave her greater incentive to achieve her goal “We drew the Dutch so there was a buzz with the likes of [Player 1, Player 2, and Player 3],” “So there is a big incentive for me to work hard and return to playing in time for the tournament”46
Supplemental material
RETURN TO TRAINING: FULL-INTEGRATION
At 10 months post-surgery (weeks 17–23 on-pitch; figure 2) and 13 weeks from her nation’s first World Cup match, she resumed unrestricted full training (online supplemental video 6). We continued to advise coaching staff on session parameter manipulation including pitch dimensions, interval/repetition/set prescription alongside inter-set recovery periods to maximise energy system conditioning and the development of physical qualities in combination with their technical and tactical requirements (figure 11).13 We continued to monitor GPS running loads in real-time and post-session, aimed at targeting session-specific loads, for example within an intensive session, the explosive distance component of high-metabolic load distance (distance above 25 W•kg-1; sum of HSR and explosive distance) (figure 11).
The player was selected for an international camp including two competitive fixtures. We communicated recommendations regarding training and progression of match minutes to the sports science/medical staff at her national team and provided the player with the same GPS unit used during club training to ensure consistency in measurements.54 She played 30 min in the first fixture and 2 min as a second-half substitute in the second.
In week 20 of on-pitch training, the player made her competitive club comeback, playing 2 min as a substitute in a Women’s Super League match. In the weeks following the players’ return from international camp, we implemented some additional aerobic power interval conditioning within the team training schedule, with the intention to limit decrements in aerobic fitness during her modified return to competition.55 We progressively increased ‘controlled’ HSR volume (figures 11 and 12), providing an increased stimulus to develop the player's work capacity in preparation for the pre World Cup camp.
Coach perspective: “It is great to have [the player] fully-fit and available for selection”, “it’s our first opportunity to see her and we know she has worked very hard in her rehab since her ACL operation”56
RETURN TO COMPETITION: PROGRESSIVE MATCH EXPOSURE
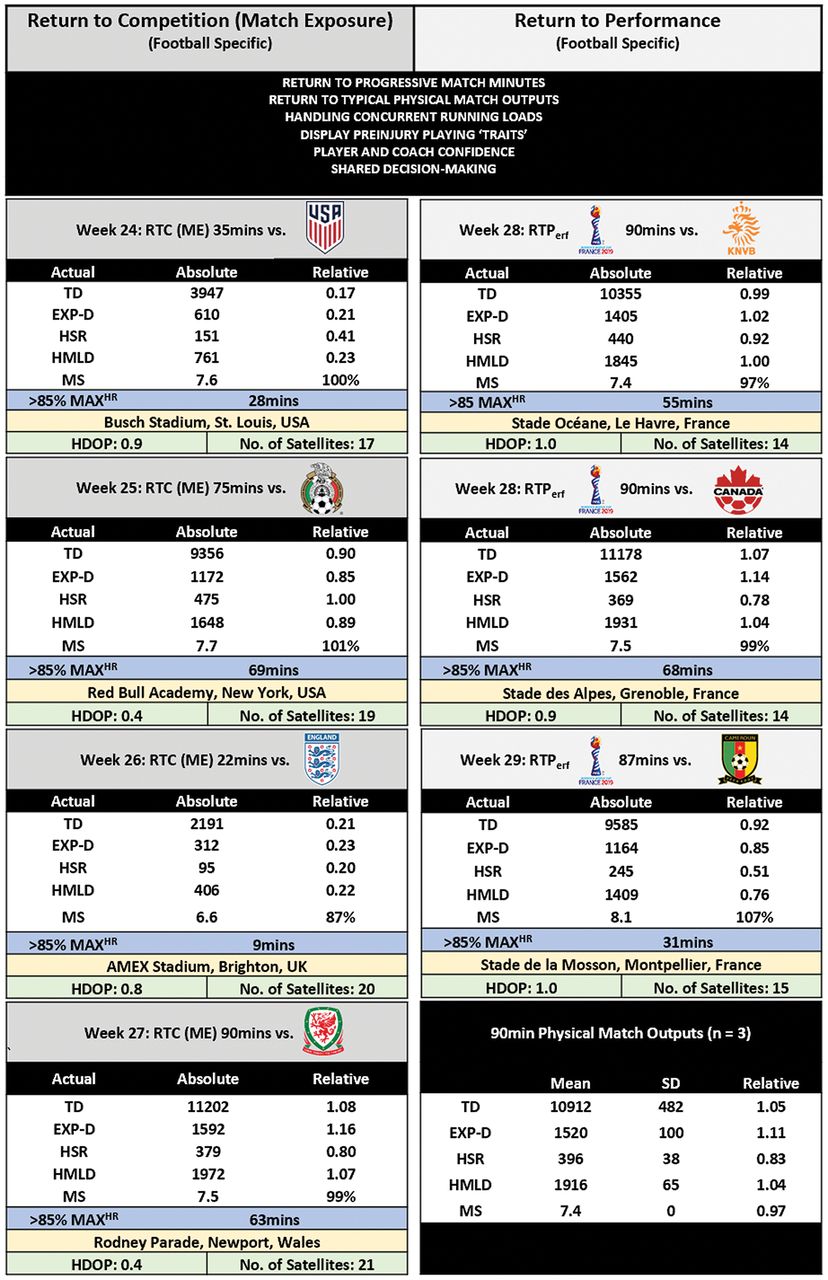
At 12 months post-surgery (weeks 24-27 on-pitch; figure 2) and following the end of the club season, the player joined her national team in preparation for the World Cup. Her two substitute appearances at club-level did not represent a ‘true’ return to competition due to a lack of competitive match minutes. Therefore, we communicated a plan to progressively increase match minutes in the build-up to the World Cup with the sports science/medical staff from her national team. In week 24 (on-pitch training), she achieved her pre-injury peak maximal speed during a friendly match (figure 13; online supplemental video 7). During the pre-tournament camp, the frequency and density of training sessions increased and the player completed the largest volume of explosive distance since returning to on-pitch activities.

Final phase of the return to performance (RTPerf) pathway — progression in return to competition match minutes and RTPerf at the FIFA World Cup (match physical outputs). Data representative of actual match data expressed in both absolute and relative (comparison to pre-injury typical match output). EXP-D, explosive distance (distance accelerating/decelerating, ie, from 2 to 4 ms-1 <1 s); HSR, high-speed running (>5.5 ms-1; dwell time 0.5s); HMLD, high metabolic load distance (distance above 25 W•kg-1; sum of HSR and EXP-D); MS, maximal speed; >85% MAXHR, time above 85% maximal heart-rate; Mean, average; ME, match exposure; RTC, return to competition; RTPerf, return to performance; HDOP, horizontal dilution of precision; TD, total distance; No. of, number of Global Positioning Systems (augmented 10 Hz Apex, StatSports, Belfast, UK).
Supplemental material
The player was coping well with the increasing training load and building a chronic loading capacity in preparation for the expected concurrent load demands of the first competitive week of the World Cup. In the second friendly match, she played 75 min at a match intensity above pre-injury outputs, her largest exposure to competitive match minutes since returning to sport. The lack of negative response (pain/joint effusion) also suggested she was coping with match demands. Following this match, the players were given 4 days leave from camp during which she performed some 'controlled' interval running as a cardiovascular stimulus and to prevent a large fluctuation in week-to-week running load volume.
After 12.5 months post-surgery (week 27 on-pitch), during another friendly match, she played only 22 min due to tactical decisions. To compensate for the lack of match exposure, post-match along with the rest of substitutes, the player completed some interval running to top-up HSR volume. In the penultimate week before the tournament, the player played her first full competitive match in just over a year. Total distance and explosive distance match outputs were higher than pre-injury (figure 13), representative of her ability to perform game-based pressing actions. Furthermore, concurrent (training plus match) explosive distance exceeded pre-injury output, while total distance and HSR were on par with concurrent pre-injury, indicating the player could produce typical concurrent load outputs(figure 12). She also displayed elements of her pre-injury playing traits and no apprehension towards contact in competition (online supplemental video 7).
RTPERF: THE FIFA WOMEN’S WORLD CUP
At 13 months post-surgery (weeks 28–29 on-pitch; figure 2), the player realised her long-term ambition playing 90 min in the first World Cup game, again displaying typical pre-injury playing traits such as driving runs with the ball into the final third of the pitch (online supplemental video 7). Based on this performance, she was selected to start the second game, again playing 90 min. In a high-pressing game (involving the movement of a team in unison to gain ball possession — limiting space, time on ball and passing options), the team worked hard to regain ball possession for long periods of the game, creating intensive physical game demands (figure 13). These demands meant HSR was below typical output, however explosive distance was above her pre-injury gameload, indicating she could handle game-specific demands. In the final group game, she played 87 min, but the team failed to qualify beyond the group stages.
Player perspectives: Following elimination from the tournament, the player gave a reflection of her journey ‘Football gives you it all! The highs of playing at my first World Cup and the feeling of walking out of the tunnel for the first match are moments I won’t forget. Then the lows of not achieving our goal [the team] and leaving this World Cup empty handed.’57
“For me, it was always about getting back from injury, then trying to work my way back into the team and make it hard for [the manager] to not put me in the starting eleven”.58
SUMMARY
Rehabilitation following ACLR is complex and like any successful RTS process is most effectively facilitated when objective pre-injury data, informed clinical reasoning and shared decision-making are combined. With the initial goal of facilitating a return to on-pitch running, progressive optimal loading targeted recognised post-ACLR neuromuscular deficits and avoidance strategies, particularly in deceleration and load absorption qualities. The ‘control–chaos continuum’11 and its adjunct, the ‘RTPerf pathway’13 guided progressive on-pitch/sports-specific rehabilitation, a return to team training, competitive match play and the ultimate goal — a RTPerf.
EPILOGUE
After the FIFA Women’s World Cup, the player transferred to another English Women’s Super League club playing 18 matches across League, domestic cup competitions (13×90 min appearances) and 3 international friendly matches prior to COVID-19 curtailing the 2019–2020 Women’s professional season. We obtained a snapshot of match physical outputs 1-year post RTS, highlighting contextual differences related to her position for club compared to her country. In her club role, she was operating as holding central midfielder, with lower physical demands than her wide midfielder role for the national team — tournament data highlighting greater HSR and maximal speed demands (figure 14). We also obtained data from a CMJ assessment at her club 1-year RTS (figures 4 and 5) allowing us to further describe her RTPerf journey. This revealed diverse trends in different CMJ variables, with positive adaptations likely stimulated by match exposure — for the elite footballer competitive match play has been highlighted as the most powerful stimulus for development of neuromuscular characteristics .59 Also, notable was the stability of the increased countermovement depth (a proxy indicator of deeper knee flexion) gained during rehabilitation suggests it has become an embedded strategy. However, her SSC function within her new range continued to improve, indicated by the large improvements in CMJ variables such as eccentric peak power, eccentric deceleration RFD and flight time:contraction time. Also, presumably driven by her on-pitch loading demands, the 1-year post test revealed a return to her previous pattern of kinetic asymmetries, albeit with a reduced magnitude of peak landing force and eccentric deceleration RFD asymmetry. These data highlight the importance of ongoing neuromuscular monitoring in the period of 12–24 months post-surgery not only to quantify progress in the involved limb but also to monitor for detrimental changes in the uninvolved limb,10 now at elevated risk of ACL rupture.5 At 18 months post-surgery, an MRI (figure 1E) showed a fully intact graft with evidence of ligamentisation.

One-year post return to sport match physical outputs for both domestic club (2×90 min) and national team (64 and 75 min). Data representative of actual match-data expressed in both absolute and relative (comparison to pre-injury typical match output). EXP-D, explosive distance (distance accelerating/decelerating, ie, from 2 to 4 ms-1 <1 s); HSR, high-speed running (>5.5 ms-1; dwell time 0.5s); HMLD, high metabolic load distance (distance above 25 W•kg-1; sum of HSR and EXP-D); HDOP, horizontal dilution of precision; MS, maximal speed; RTPerf, return to performance; TD, total distance; No. of, number of. Global Positioning Systems (augmented 10 Hz Apex, StatSports, Belfast, UK).
Key points
Beginning early in the process, strength and power diagnostic tests implemented throughout rehabilitation can quantify the (1) willingness to load the involved joint, (2) effectiveness of progressive ‘optimal loading’ targeting individual limb and bilateral performance deficits and interlimb asymmetries/avoidance strategies, and (3) status of asymmetries and deficits relative to pre-injury data where available, or sports-/phase-specific reference data.
The ‘control–chaos continuum’ provides a framework to plan progressive sports-specific conditioning, technical skill integration, and return to the required chronic running load demands, while considering the qualitative nature of movement in competition.
The ‘RTPerf’ pathway provides a conceptual model that helps guide planning and decision-making around player re-integration to the team training environment, progressive exposure to competitive match minutes and subsequent RTPerf.
RTPerf follows RTS and is characterised by multiple indicators — a combination of quantitative; match compared to pre-injury outputs, the ability to produce, and cope with concurrent running loads and qualitative information; video demonstrating pre-injury playing traits and coaching perspective including frequent selection for competition. The player’s performances and higher physical outputs in the World Cup and during competition 1-year post RTS suggest that in the current case, the player’s expectation to return to previous performance had indeed been achieved.
REFERENCES
Footnotes
Twitter Matt Taberner @MattTaberner, Nicol van Dyk @NicolvanDyk, Tom Allen @tallen_5, Neil Jain @neiljainortho, Chris Richter @ChrisRichterPhD, Barry Drust @BARRYD22 and Daniel D Cohen @daniecohen1971.
Acknowledgements The authors thank Lloyd Parker (Everton FC Sports Nutritionist) for providing DEXA scan information and nutritional support to the player, Luke Benstead (Royal Belgian Football Association Performance Analyst) for providing training and competition video editing using Coach Paint (Chyronhego, New York, USA), and Chris Difford (Bristol City Women’s FC Physical Performance Coach) for conducting 1-year post RTS CMJ testing.
Contributors NJ surgically operated on the player and assisted with writing the manuscript in relation to the injury pathology and surgical procedure. MT led physical preparation and RTS, communicated with the New Zealand Women's national team sports science/medical staff, planned and wrote the manuscript. DC, NvD, TA, and BD provided guidance and assisted in the writing of the manuscript. EB and CR provided analysis of strength and power diagnostic testing alongside DC and MT.
Funding This research received no specific grant from any funding agency in the public, commercial or not-for-profit sectors.
Competing interests None declared.
Patient consent for publication Obtained (BMJ consent form).
Ethics approval Not required — letter provided by the Universidad de Santander (UDES) ethical committee (data collection as part of employment).
Provenance and peer review Not commissioned; externally peer reviewed.
Data availability statement All data relevant to the study are included in the article or uploaded as supplemental information.
Supplemental material This content has been supplied by the author(s). It has not been vetted by BMJ Publishing Group Limited (BMJ) and may not have been peer-reviewed. Any opinions or recommendations discussed are solely those of the author(s) and are not endorsed by BMJ. BMJ disclaims all liability and responsibility arising from any reliance placed on the content. Where the content includes any translated material, BMJ does not warrant the accuracy and reliability of the translations (including but not limited to local regulations, clinical guidelines, terminology, drug names and drug dosages), and is not responsible for any error and/or omissions arising from translation and adaptation or otherwise.