Article Text

Statistics from Altmetric.com
Non-communicable diseases (NCDs) account for 68% of all deaths worldwide. In the UK, NCDs are responsible for 80% of all deaths.1 Physical inactivity is one of the four key behavioural risk factors for NCDs. Across the four countries of the UK, at least one-third of adults are insufficiently active, which is higher than the global average, the majority of our European neighbours and the USA.2
The 2011 physical activity recommendations, published by the four UK Chief Medical Officers (CMOs), emphasised the goal of achieving an active lifestyle across the life course. The challenge of increasing and sustaining the physical activity levels of the UK's child and adult populations has been central to national policies and plans since the mid-1990s. A consistent feature of these plans has been the role of the healthcare setting in the promotion of physical activity for the prevention and treatment of disease. Reports by the Royal Colleges,3 ,4 House of Commons Health Committee,5 Public Health England (PHE)6 and the National Institute of Health and Care Excellence (NICE)7 all call on health professionals to promote physical activity to their patient populations. However, basic knowledge of the physical activity recommendations, and their components, has remained consistently low across health professionals and the public with as few as 11–15% correctly recalling the current guidelines.8
The translation of complex epidemiological evidence into effective public health practise is challenging. There is an important difference between messages (in this case, the recommendations) and messaging (the effective delivery of these messages to the target audience). In January 2015, Professor Dame Sally Davies, CMO for England, asked an Expert Committee to create evidence-informed messages using rapid reviews of the evidence and expert testimony to make the physical activity recommendations simpler, for health professionals to use and for the public to understand.
In consultation with the CMO office, the Expert Committee decided that the primary output should be three infographics, representing the different guidelines throughout the life course (Adult and Older adult, Children and Young People, Under 5s). A set of key criteria and a design brief were agreed for the resources, and PHE commissioned a design company to develop the infographics. The infographics were developed sequentially, by committee members specialising in physical activity within each population group.
The development of each infographic followed a similar format:
Review of the current messaging strategies relevant to each population group, in the UK and abroad;
Development of a design brief commissioning the production of three different designs;
Discussion, analysis and review of initial designs by the Expert Committee, followed by selection and modification of a single design;
Online consultation of the chosen infographic using a short, online evaluation tool to collate feedback. Evaluations were collected from a broad range of health and physical activity professionals using the networks of group members and pre-identified stakeholders (∼100 responses per infographic);
Thematic analysis of feedback from the consultation;
Review of the feedback by the Expert Committee and production of a revised design brief;
Review and editing of the subsequent design by the Expert Committee;
Presentation to the four UK CMOs for their feedback and suggested amendments;
Final edits and CMO signoff;
Infographic launch and dissemination by the respective CMOs in England, Scotland, Wales and Northern Ireland.
Common challenges included avoiding ‘text heavy’ messages while maintaining message clarity, and finding a layout that drew attention to key messages and helped ‘guide’ readers through the information. The consultation phase was instrumental in helping prioritise and order information, while advice on marketing and infographic development was of great benefit to the Expert Committee.
The Adult and Older Adult infographic (figure 1) and Children and Young People infographic (figure 2) were launched independently in the four home countries and distributed as card pull-outs in the British Medical Journal. With the support of professional bodies, the infographics have also been disseminated in electronic format to health professionals via email and the internet. The Under 5s infographic is currently in the late stages of development.
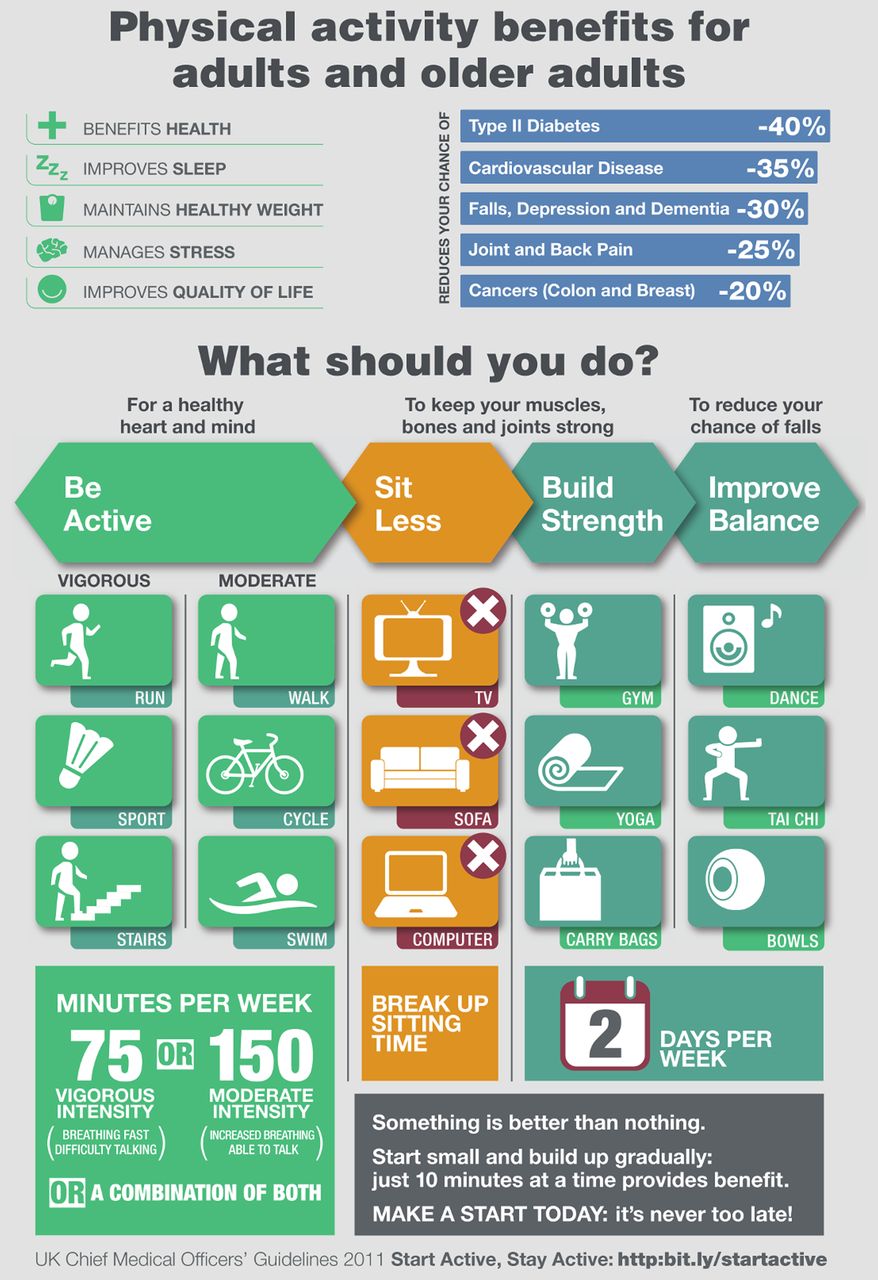
Physical activity benefits for adults and older adults.

Physical activity for children and young people.
We welcome this first step in translating public health recommendations to healthcare professionals, but there are some remaining implementation questions. For example, is an infographic effective as a means of information dissemination in healthcare? how do we best optimise the infographic's uptake and distribution? what is the ultimate impact of this infographic on clinical outcomes and physical activity behaviour? how do we best capture its clinical impact?
We appeal to all health professionals to share the infographics widely, display and use the resources to educate patients and encourage them to achieve the physical activity recommendations. Furthermore, we call for further implementation and evaluation research to inform the best use of these and other infographics in physical activity and healthcare in general.
Footnotes
Twitter Follow Hamish Reid at @habreid
Collaborators On behalf of the UK CMOs' Expert Committee for Physical Activity.
Contributors All authors contributed to drafting, developing and writing this editorial, which was led by HR.
Competing interests None.
Provenance and peer review Not commissioned; externally peer reviewed.