Article Text

Abstract
Background Although there is a growing understanding of the consequences of concussions in hockey, very little is known about the precipitating factors associated with this type of injury.
Aim To describe player characteristics and situational factors associated with concussions in the National Hockey League (NHL).
Methods Case series of medically diagnosed concussions for regular season games over a 3.5-year period during the 2006–2010 seasons using an inclusive cohort of professional hockey players. Digital video records were coded and analysed using the Heads Up Checklist.
Results Of 197 medically diagnosed concussions, 88% involved contact with an opponent. Forwards accounted for more concussions than expected compared with on-ice proportional representation (95% CI 60 to 73; p=0.04). Significantly more concussions occurred in the first period (47%) compared with the second and third periods (p=0.047), with the majority of concussions occurring in the defensive zone (45%). Approximately 47% of the concussions occurred in open ice, 53% occurred in the perimeter. Finally, 37% of the concussions involved injured players’ heads contacting the boards or glass.
Conclusions This study describes several specific factors associated with concussions in the NHL, including period of the game, player position, body size, and specific locations on the ice and particular situations based on a player's position.
- Concussion
- Contact sports
- Ice hockey
- Injury Prevention
Statistics from Altmetric.com
Introduction
Professional hockey is a highly complex game involving a combination of physical strength, speed, agility, diverse physiological demands and technical mastery. In addition to these attributes, players must execute the sport within an enclosed area containing hard surfaces and obstacles, such as the surrounding boards and perimeter glass, the ice surface, goal nets, stationary and moving officials and perhaps, most importantly, their opponents. With all of these interacting factors, the risk for injury is significant. Of particular concern among the medical and public communities is one of the most common injuries in hockey, namely, concussion.1–7
Although there is a growing understanding of the consequences of concussions in sport,8–18 very little is known about the precipitating mechanisms associated with this type of injury in hockey. Although some risk factors for concussion have been reported, for example, the increased susceptibility for players in the forward position,3 a thorough description of intrinsic and extrinsic risk factors for concussion has not been completed at the National Hockey League (NHL) level.
The analysis of injury mechanisms using video records appears to be a promising approach to objectively identify, quantify, reduce and ultimately prevent injuries from occurring.19–22 The exceptional quality and quantity of video records of NHL games is a valuable and rich source of data, allowing for the examination of situational factors and injury mechanisms among professional hockey players. This paper represents a first effort to systematically analyse video recordings of NHL concussions over 3.5 regular seasons (ie, 2006/2007—2009/2010) with a specific focus on describing players’ characteristics and situational factors.
Methods
NHL players suspected of having a concussion were initially identified by team athletic trainers or therapists and then evaluated by team physicians who diagnosed concussion according to the Zurich (2008) Concussion in Sport definition.18 Digital video records of the diagnosed concussions from the NHL injury surveillance system were provided to the researchers by NHL Operations for regular season games occurring from 4 October 2006 through to 31 December 2009. Itemised descriptions, including demographic information (ie, height, weight and position), were also obtained from League sources.23 The study was approved by the Ethics Review Board of the Office of Research Services at the University of Toronto (protocol reference #23882).
Heads Up Checklist
The Heads Up Checklist (HUC) is a standardised framework for coding mechanisms of concussions in hockey using digital video images.24 The HUC contains 17 specific factors that are organised into three broad sections: (1) Event, (2) Game Situation and (3) Equipment (see table 1). Additionally, the HUC includes a schematic of the ice surface and space available for qualitative viewer commentary. A previous study examining the reliability of the HUC between two independent raters reported percentage agreement values of >0.80 and κ coefficients of >0.65.24
Heads Up Checklist factors
Procedure
Two raters independently viewed the digital records of events leading to concussion for 3.5-NHL seasons from 4 October 2006 to 31 December 2009. Raters viewed each event using Quicktime Player Pro V.7.6.6 software on an Apple MacBook Pro 4.1 (operating software Mac OS X V.10.5.8).25 Each factor of the HUC was completed for each concussion event. Raters were allowed to view the event as many times as required, in any playback speed deemed necessary to complete all categories, for each factor on the HUC. If there was initial disagreement, raters viewed and discussed video records of events in an effort to reach consensus. In cases where consensus was not reached, a third rater was consulted who made the determination.
Outcome measures
Digital video records of concussions were coded using the HUC. The following factors from the HUC were analysed: scenario (eg, opponent, team-mate, fall, other); visor use; zone (eg, offensive, defensive or neutral), physical location (eg, open ice, corner, side boards, etc); game situation (eg, breakout, forecheck, on the rush, etc) and period of the game. We also assessed position, age and anthropometric characteristics of players with concussion.
Statistical analyses
Descriptive statistics of the outcome measures of interest were limited to coded events leading to concussion (n=197). To compare proportional differences for visor use, player position and period of the game, Pearson χ2 tests were used. For events that involved contact with another player, height and weight characteristics were compared between the players delivering the contact leading to concussion and the injured players using paired t tests. All analyses were performed using Statistical Analysis Software, V.9.2 and used two-sided tests for significance at the 0.05 level, with 95% CIs.
Results
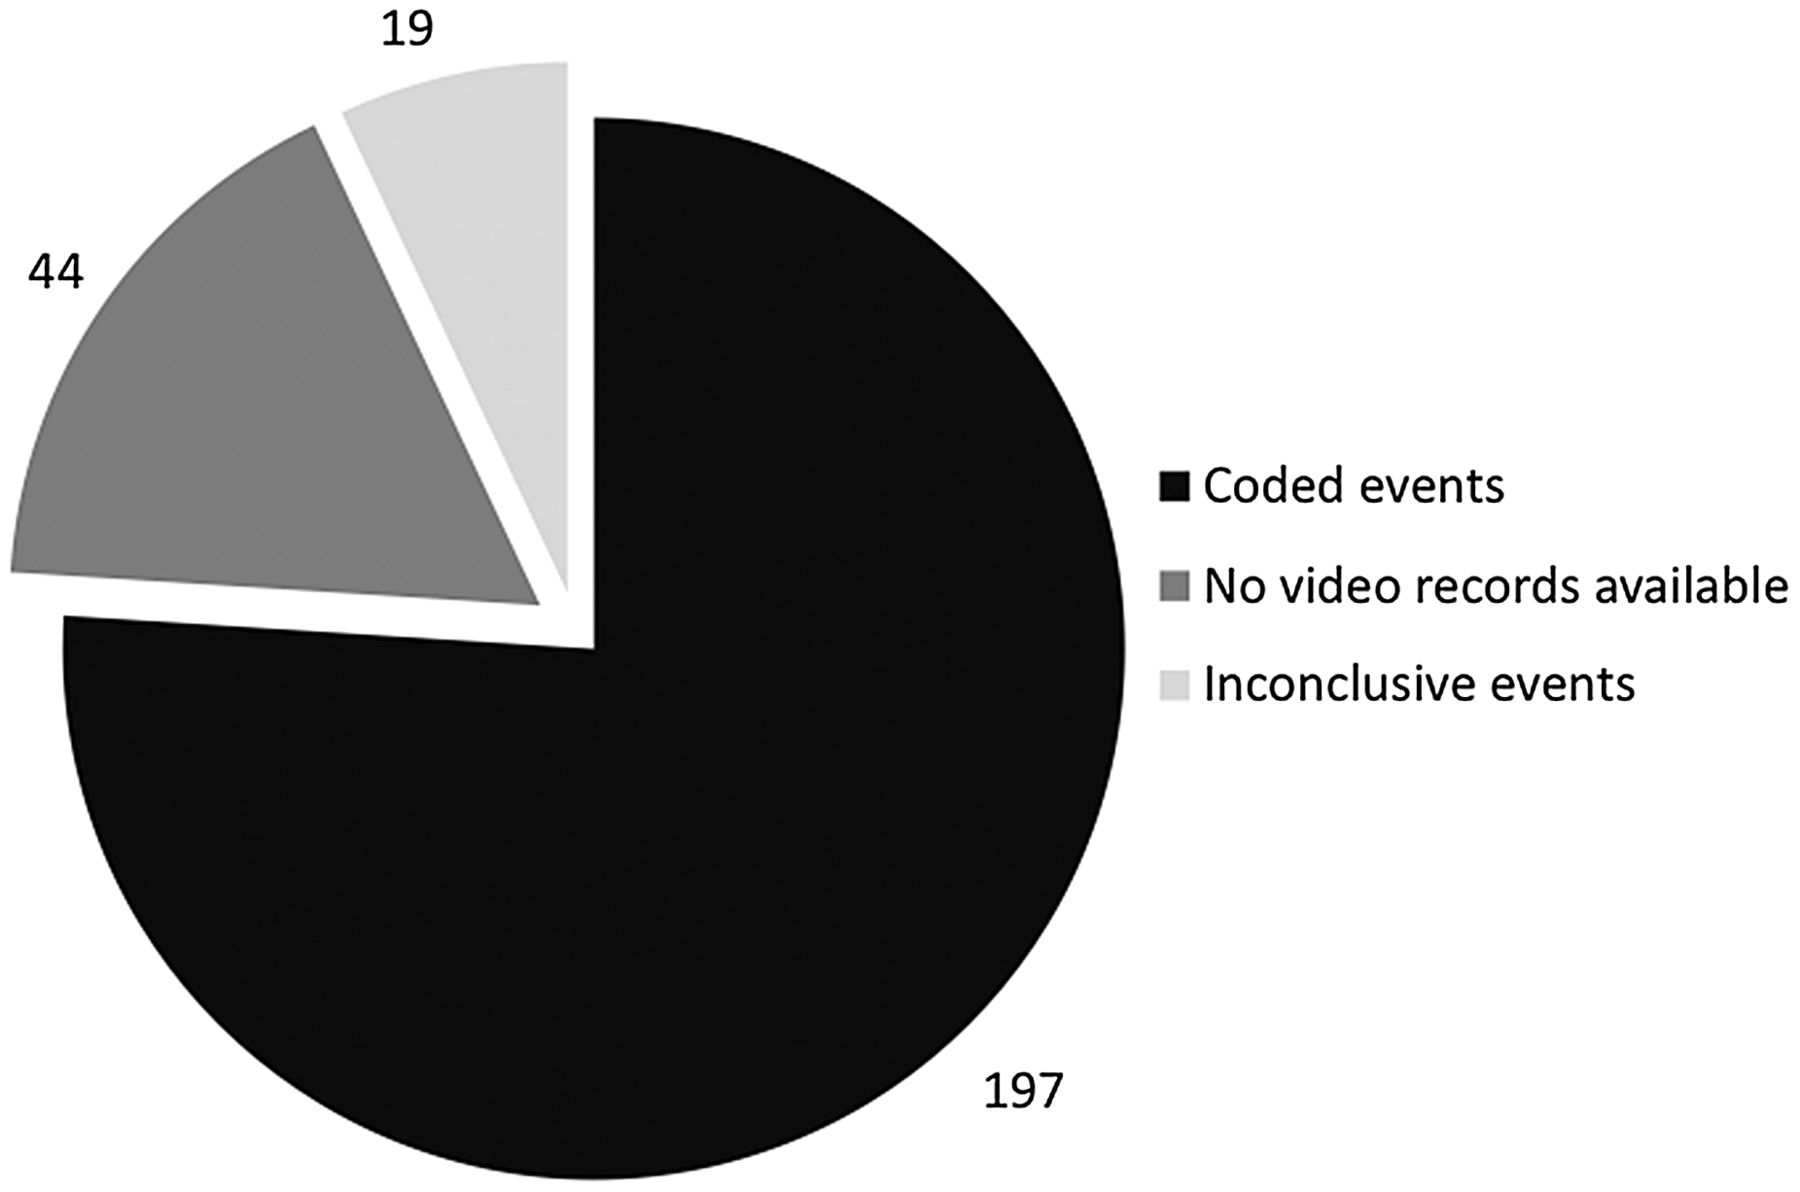
A total of 260 regular season concussions were reported to have occurred during the data collection period from the beginning of the 2006/2007 season to the end of December 2009, or 6.05 injuries/100 games. Video records were not provided for 44 cases because the injury incident could not be identified or located. Video recordings for 216 events that resulted in concussion were received for analysis from NHL Operations. Nineteen events were deemed inconclusive by the raters and were therefore not coded (ie, because of degraded video quality or lack of appropriate camera angles). Therefore, a total of 197 were coded for the present study. Figure 1 presents the breakdown of concussions during the study period.

Regular season concussions in the National Hockey League (n=260).
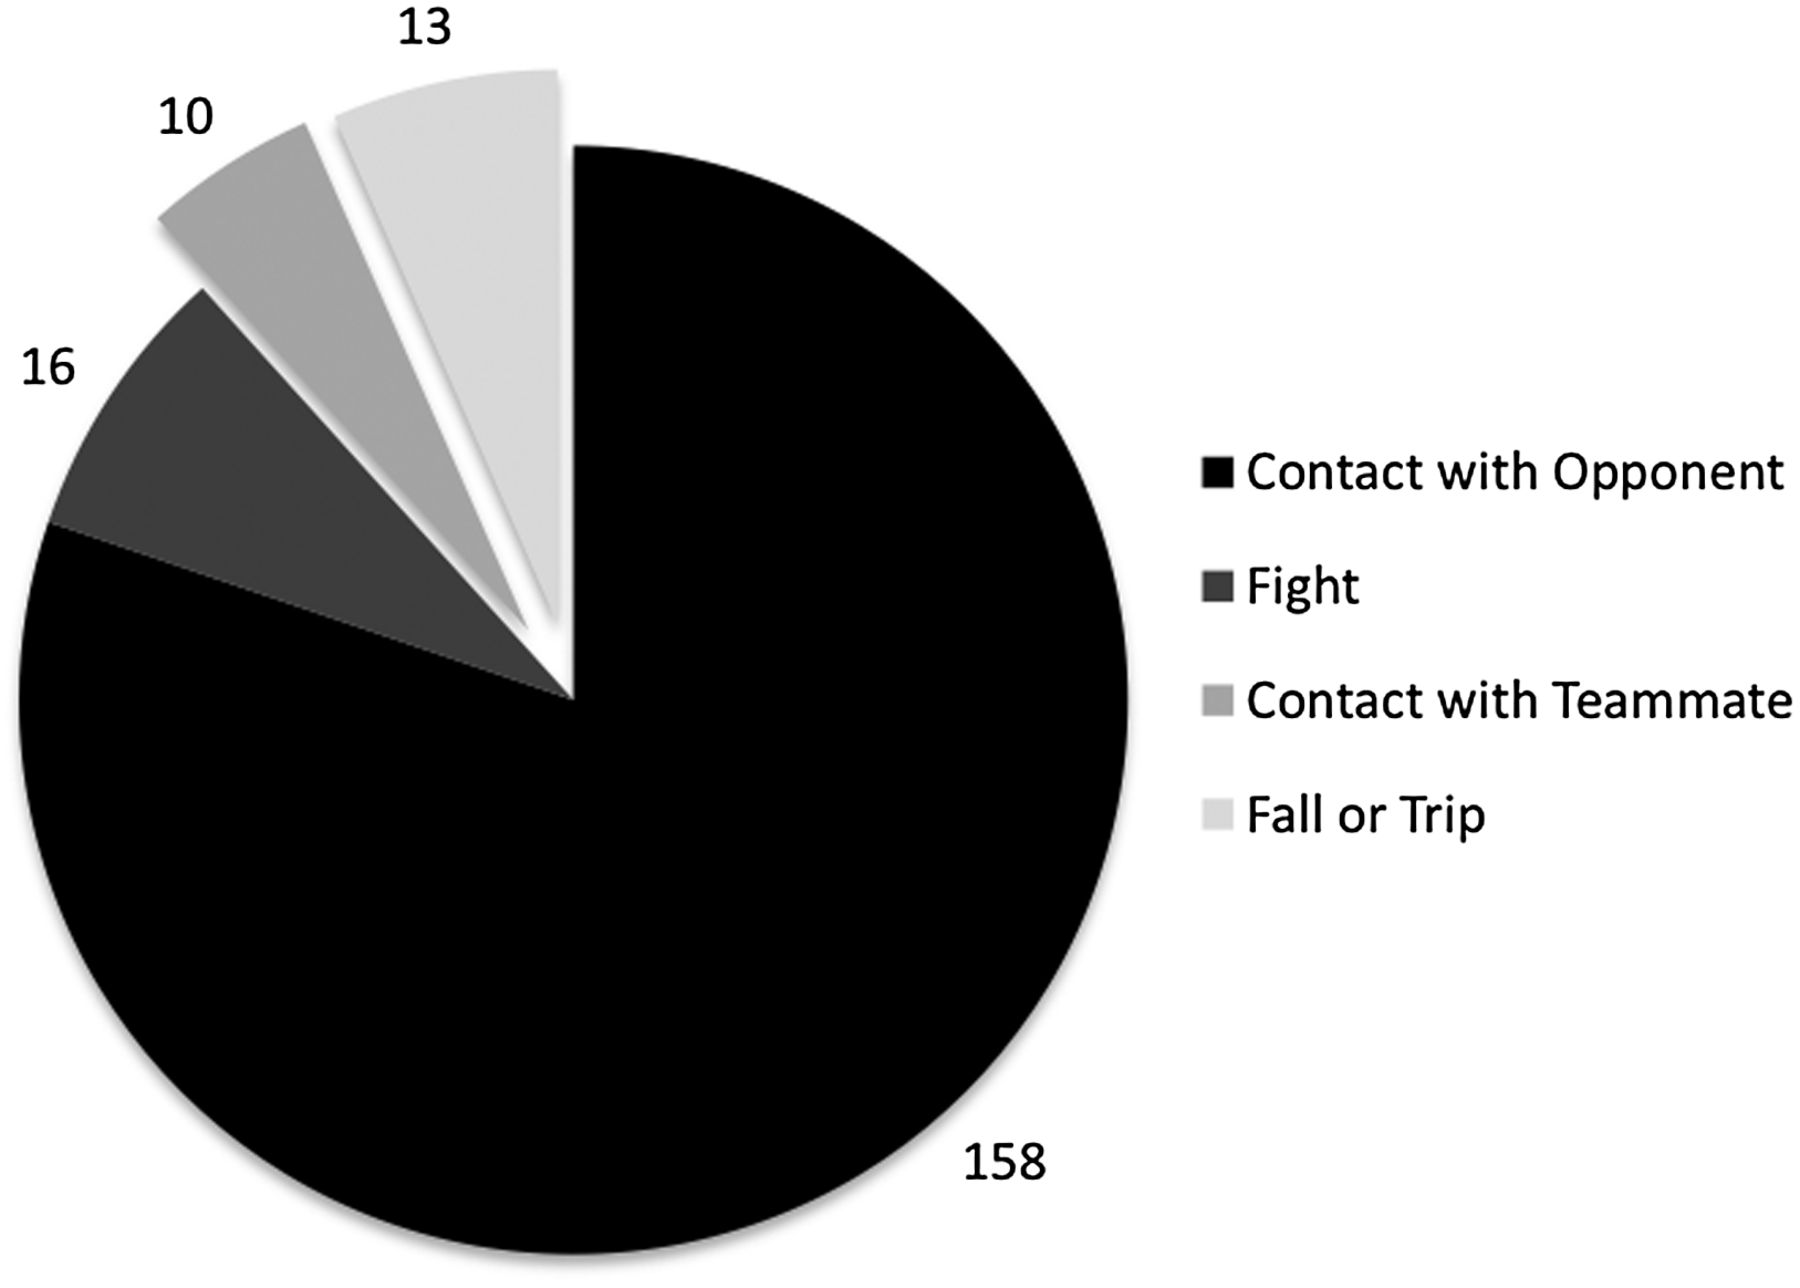
See figure 2 for the breakdown of coded events. The most common situation leading to concussion was contact with an opponent (88%, n=174/197), which includes 16 events that were classified as occurring because of a fight. The remaining events were due to a fall or trip (7%, n=13/197); and 5% (n=10/197) involved contact with a team-mate.

Breakdown of coded events (n=197).
Who gets a concussion?
Age and anthropometric characteristics
The average age of players with concussion was 28.0 years (n=196; SD=4.73, range 19–40). On average, injured players were 185.73 cm tall (SD=5.01, range 175–203) and weighed 92.78 kg (SD=6.73, range 75–117). For the events that involved direct contact with another player (ie, not due to a fall or trip), the player delivering the contact leading to concussion was classified as the ‘hitter’. On average, the hitters were 186.87 cm tall (n=173; SD=5.59, range 173–206) and weighed 96.32 kg (n=173; SD=7.78, range 81–117). Hitters were significantly taller (1.26 cm; 95% CI 0.23 to 2.29; p=0.017) and 3.58 kg heavier (95% CI 2.19 to 4.98; p<0.001) than those who were concussed. In addition to group averages, case-by-case analyses were conducted, which examined the differences for height and weight between the injured players and hitters. These analyses indicated that the hitter was taller than the injured player in 52% of events, with the hitter being heavier than the injured player in 65% of the cases.
Visor usage
In the events analysed, 49% (n=98) of the players were wearing a visor at the time of concussion. Over the data collection period, the percentage of players wearing a visor at the time of injury increased from 38% in 2006–2007 to 59% in 2008–2009. Overall, 56% of NHL players wore a visor during the 2008–2009 season (Meeuwisse W, Concussion Working Group Meeting. Phoenix, 2009); therefore, there was no significant association between odds of suffering a concussion and wearing a visor (OR=1.34; 95% CI 0.72 to 2.48).
Player position
The expected distribution of concussions by position based on the proportional representation of players on the ice would be 50% for forwards, 33% for defencemen and 17% for goalies. In the present study, 65% (n=129/197) of the events analysed involved concussions sustained by forwards, 32% (n=63/197) of concussions occurred among defencemen and 3% (n=5/197) for goalies. Goalies accounted for fewer than expected concussions when considering their on-ice proportional representation. The observed number of concussions for forwards was significantly higher than expected compared with on-ice proportional representation (95% CI 60 to 73; p=0.04).
A total of 158 events were identified as involving direct contact with an opponent and not classified as a ‘fight’. Of these, the hitter was a forward in 65% of the cases. Overall, the findings indicate that forwards—both those who were injured and those causing a concussion—are over-represented given their expected rates based on on-ice representation.
When do concussions occur?
The majority of the concussions (47.0%; n=86) occurred in the first period of play, with a relatively equal distribution of concussions occurring between the second and third periods, accounting for 27.9% (n=51) and 25.1% (n=46), respectively (χ2(9, N=183)=8.64, p=0.047). Concussions that occurred in overtime were attributed to the third period. Of note, the period in which the player was injured could not be determined for 14 events due to insufficient information visible on the video records.
Where and under what circumstances do concussions occur on the ice?
Where
Zone
There are three ‘zones’ in ice hockey: the offensive zone, the neutral zone and the defensive zone. In total, 45% (n=89/197) of concussions occurred when the injured player was in the defensive zone, whereas 34% (n=67/197) occurred when the injured player was in the offensive zone. Twenty-one per cent (n=41/197) of concussions occurred in the neutral zone and the remaining event was classified as inconclusive. See table 2 for the breakdown of player position by zone.
Breakdown of concussions by player position and zone, % (n)
The majority of defencemen were injured in their defensive zone when ‘retrieving the puck’ or during team ‘breakouts’ (see table 3). In contrast to defencemen, the distribution of on-ice location was relatively equal for forwards across zones, with slightly more forwards suffering a concussion in the offensive zone. Forwards incurred more concussions when ‘on the rush’, ‘forechecking’, or ‘breaking out’ (see table 3).
Game situations by position, % (n)
Location
The ice rink can be divided conceptually into two general areas, namely perimeter and open ice. The perimeter is comprised of the side boards, corners, end boards, and side of net. Side boards refer to the boards and glass as well as 3 feet of the ice surface from the boards towards the middle of the rink, spanning all three zones. Corners refer to the rounded portion of the boards and glass connecting the side boards and end boards, including 3 feet towards the middle of the rink. The open ice is the interior portion of the ice not accounted for by the perimeter. Forty-seven per cent (n=92/197) of the events analysed were classified as open ice events. Fifty-three per cent (n=105/197) of the events were classified as perimeter. Of these, 16% (n=31/197) occurred in the corners, 24% (n=48/197) at the side boards and 13% (n=26/197) at the end boards and the side of net. Of the 197 events, 37% (n=73/197) involved injured players’ head contacting the boards or glass (see table 4 for percentage of events that involved head contact with boards or glass).
Events that involved head contact with boards or glass (n=73)
Discussion
This paper summarises several descriptive characteristics of NHL players medically diagnosed with concussion over 3.5 regular seasons of play. It also provides a breakdown of the antecedent events and contextual factors associated with concussions in the NHL. In a sport where body contact is regarded as a skill, it is not surprising that body contact involving an opponent is most frequently a component of the chain of events leading to concussion.
For the events analysed, more than 85% of concussions occurred as a result of player-to-player collisions (ie, either player-to-opponent or player-to-team-mate). Previous research at the collegiate and high school levels reported that player-to-player collisions accounted for 45–60% of concussions1 ,7; but, the research applied a different classification system for coding injuries, contributing to the lower values compared with the present study. In the present study, fight-related concussions accounted for 8% of the total number of concussions analysed.
The present analyses indicate that players initiating contact that resulted in concussion were taller and heavier on average than players who sustained concussions. This is in keeping with Newton's third law (the Law of Reaction), where acceleration is the result of (net) applied force. In any two-body collision, each player has a force of equal magnitude applied to it, and the resulting acceleration (or deceleration) is therefore greater for the less massive player, by Newton's second law (the Law of Acceleration; F=ma).
The use of full or partial facial protection has been shown to significantly reduce a player's risk of severe facial injuries.26–30 According to NHL Health Management Panel data, the percentage of players wearing a visor increased from 34% in the 2003 season to 56% in 2008 (Meeuwisse W, Concussion Working Group Meeting. Phoenix, 2009). The proportion of players wearing a visor at the time of concussion in the present study was similar to the proportion of players wearing visors across the NHL. Consequently, despite the overall increase in visor use during the study period, these data did not identify a difference between the occurrence of concussions in players who wear helmets with a visor and those without a visor.
In an attempt to identify specific locations where the majority of concussions occurred, our results indicate a relatively even distribution of perimeter and open ice events leading to concussion. It should be noted that 37% (ie, approximately 1 in 3) of the events involved direct head contact with the boards or glass. These findings are slightly higher than the numbers previously reported for hockey.1 Since one in three concussions involved direct head contact with boards or glass, this suggests that evaluation and/or changes in material or installation methods need to be investigated. There are various rink designs (ie, installation of boards and corresponding rigidity) and several types of glass types installed in ice rinks; however, a comparison of these various designs was not the focus of this project. Future research examining the specific infrastructure standards and designs to dissipate or absorb the energy of these contacts would be worthwhile and could potentially lead to the reduction of concussions. Of note, since the study was conducted, the NHL has enacted changes to remove seamless glass (considered more rigid) from the ends (and corners) of all NHL game venues.
In the present study, approximately one half of the concussions occurred during the first period, presumably a time when players are maximally energised with strategies to initiate body contact such as ‘establishing a forecheck’ and ‘setting the tone’ in the early stages of the game. However, the present findings are contrary to the general trend of other (ie, musculoskeletal) injuries in hockey, in which the first period accounted for approximately 25% of total injuries.1 The present findings also run contrary to the view that concussions in hockey often occur when players may be more fatigued31 ,32 or at points later in the game when emotions may run high and the game gets ‘out of hand’.
The present results indicate that forwards sustain more concussions than defencemen or goalies. A possible reason for this finding may be that forwards spend a greater amount of time with the puck and are often moving on the ice at full speed. Of greater importance was player position by zone, which identified specific risks for forwards and defencemen. For example, defencemen sustained 32% of all concussions; yet, when considering the on-ice location of the event, most of these (22%) occurred in the defensive zone, while only 4% and 6% occurred in the neutral and offensive zones, respectively. More specifically, defencemen appear to sustain concussions when retrieving the puck or behind the net, while forwards were more often injured when they were ‘on the rush’.
Limitations
There are limitations associated with a project of this nature. First, not all diagnosed concussions could be evaluated via video analysis; in a minority of cases, raters were not able to identify the exact concussion event, the concussion occurred outside of the field of view of the cameras or the description of the concussion did not ‘match’ the video being reviewed. Nevertheless, we were able to analyse more than 75% of concussions during the data collection period. Therefore, the results of the present study are probably representative of the typical events leading to concussion in the NHL. Second, we analysed medically diagnosed concussions in one particular league with its own set of rules and standards (eg, optional use of face shields, touch icing, etc). The extent to which these findings can be generalised to other leagues with different sets of rules and regulations is uncertain. Nonetheless, several important issues highlighted in this paper are applicable to the hockey community at large.
Conclusion
The objective of this research was to identify various factors associated with concussions in the NHL, which could inform the development of concussion-prevention strategies. The data revealed several specific factors associated with concussion in NHL players, including period of the game, body size, specific locations on the ice and particular situations based on a player’s position. The next step is to develop and implement prevention measures and strategies to reduce or minimise the risk of injury.
What are the new findings?
The study provides a novel method to code and analyse the antecedent events and contextual factors associated with concussions in the National Hockey League (NHL). The study revealed several specific factors associated with concussion in NHL players, including:
• The majority of the concussions occurred in the first period.
• The observed number of concussions for forwards was significantly higher than expected compared with on-ice proportional representation.
• Players delivering the body contacts (‘hitters’) were significantly taller and heavier than those who sustained the concussion.
• Defencemen accounted for 32% of concussions; however, the overwhelming majority of these concussions occurred in the defensive zone when ‘retrieving the puck’ or during team ‘breakouts’.
How might it impact clinical practice in the near future?
Identification of the factors associated with concussions in hockey will help inform the development of effective education, evaluation and prevention strategies.
Health professionals that evaluate and manage professional hockey players should be cognisant of the factors associated with concussion in sport and manage and counsel athletes and other stakeholders appropriately.
Acknowledgments
The authors are grateful to the members of the NHL/NHLPA Concussion Working Group: Dr Mark Aubry, Mr Bill Daly, Ms Maria Dennis, Ms Julie Grand, Dr John Rizos, Mr Rob Zamuner and also Mr Jim Ramsay, for their insight throughout the research study. We would also like to thank Ms Cynthia Lichter of NHL Operations for her ongoing assistance with the videos. PC and MH would like to thank Dr Angela Colantonio and Dr Doug Richards of the University of Toronto for their ongoing advice and support through the development of the manuscript.
References
Footnotes
Contributors MH and PC had full access to all the data in the study and take responsibility for the integrity of the data and the accuracy of the data analyses. WHM and RJE were also main contributors to the content of this manuscript and were involved in the study's design. MH mainly contributed to the statistical analysis. All authors interpreted the results, drafted the manuscript, decided to submit the manuscript and involved in the critical revision of the manuscript.
Funding This study received funding by Ontario Neurotrauma Foundation (ONF) and The Pashby Sports Safety Fund. The organisations that contributed funds to the research had no role in the design of the study, the collection, analysis and interpretation of the data.
Competing interests All authors have completed the ICMJE Form for Disclosure of Potential Conflicts of Interest. PC is a member of the Concussion Working Group and a clinical neuropsychologist consultant with the NHLPA, for which he receives remuneration, but he did not receive any funding from the NHL or the NHLPA to conduct the present research. WM is a member of the Concussion Working Group and medical consultant to the NHL, for which he receives remuneration, but did not receive any funding from the NHL or NHLPA to conduct the present research. RJE is a consultant to the NHL, MLS and US Soccer Federation for which he receives financial remuneration. No financial remuneration was received for activities specifically related to this research. MH received graduate training funding from Ontario Neurotrauma Foundation and The Pashby Sports Safety Fund.
Ethics approval Ethics Review Board of the Office of Research Services at the University of Toronto.
Provenance and peer review Not commissioned; externally peer reviewed.