Article Text

Abstract
Background: Research on injuries in racing drivers is limited.
Objective: To gain more information about such injuries.
Methods: Injuries recorded during and after races between 1996 and 2000 were investigated using the medical charts from the circuit medical centre at Fuji Speedway, which is one of the biggest circuits in Japan. Races were in either single seat/formula cars or saloon cars.
Results: Data were obtained from 39 races in single seat cars (1030 participating cars) and 42 races in saloon cars (1577 cars). Fifty injuries were recorded during the single seat car races, and 62 during the saloon car races (injury rate 1.2 per 1000 competitors per race and 0.9 per 1000 competitors per race respectively). Thirteen injuries were recorded after the race, 12 of them in saloon car racing. Bruises were the major injury in single seat car racing (58%). Lower limb bruising was more common than upper limb bruising. Most of the injuries in saloon car racing (53.2%) were neck sprains. The incidence of concussion was high in both groups compared with other high risk sports.
Conclusions: There were some differences in injuries between the two types of car. No serious injuries occurred except for one death. However, the driver’s body is subjected to large forces in a crash, hence the high incidence of concussion. The injuries recorded after the race emphasise that motor racing is a demanding sport.
- injuries
- motor car racing
- concussion
Statistics from Altmetric.com
The injuries and physical problems of motor sport are not well known. There are some reports on the physical performance of racing drivers,1 and a few papers on injuries in motor sport2–4 and disorders in Formula 15–7 and rally drivers.8,9 However, these injuries have not been widely researched. Therefore the specific injuries of this sport are not fully understood. Consequently, guidelines for the initial treatment of such injuries cannot be standardised.
Racing drivers are exposed to high risk situations such as car crashes. However, it is not clear exactly how much G force is loaded on the driver’s body in such situations. Because the driver’s muscles resist the G force in an actual crash, the G force loaded on the body may be smaller than that recorded by the car telemeters. Forces that cause severe injuries, such as concussions and fractures, are around 5–10 G, which are produced by acute deceleration of about 150–200 km/h.
Moreover, racing requires extraordinary physical performance in extreme conditions such as the high G forces caused by breaking and cornering, heavy steering, and high temperature. In addition, it is said that the heart rate increases up to 170–180 beats/min during cornering.1
Thus motor sport is highly risky and demanding, and injuries are recorded both during and after races. The purpose of this research was to draw attention to motor sport by investigating injuries of racing drivers and to present a profile of those injuries.
METHODS
Injuries recorded during and after races held at Fuji Speedway, which is one of the biggest circuits in Japan, between 1996 and 2000 were investigated retrospectively by using medical charts from the circuit medical centre. All drivers involved in crashes during the race were sent to the medical centre to be checked by a doctor, even if they did not complain of any symptoms; therefore no in-race injuries were overlooked. Some drivers may have gone directly to hospital, so some post-race injuries may have been missed.
The diagnoses of injured drivers who needed further examination at a hospital were recorded at the medical centre. Therefore, all injuries that were checked were recorded.
Neck pain resulting only from injured soft tissue was recorded as a neck sprain. Drivers who experienced either confusion or amnesia after the crash were diagnosed as having concussion. No driver lost consciousness as the result of a crash.
Two types of race were investigated, single seat/formula cars and saloon cars, as it was hypothesised that the difference in car design would result in different injuries. Only the main races involving professional drivers were selected for research, because the accident rate may be different between novice and professional drivers. During the five year study period, there were few changes in regulations on racing cars. This means that the type and incidence of injuries did not differ very much during these five years.
RESULTS
Table 1 shows the injuries in single seat and saloon car racing. Neck sprains and bruises were the most common in both types of car. All injuries to the neck were sprains. Therefore, in the analysis of injury type, neck sprains were not included in the sprains category, but were treated as a separate injury.
Numbers of injuries in single seat car and saloon car racing
Single seat car racing
The number of participating cars was 1030, in 39 races. Fifty injuries (including one death) were recorded during the races and one afterwards. The in-race injury rate was approximately 1.2 per 1000 competitors per race.
Bruises made up 58% (n = 29) of the injuries, and neck sprains accounted for 34% (n = 17). The other four injuries were: ankle sprain, abrasion, concussion, and death (fig 1A). The death occurred when the car hit the sign board, which stands at the start line, after being sent airborne when its tyre hit that of another car in the straight section of the circuit. The cause of death was recorded as cerebral contusion. The car may have hit the finishing gate directly at more than 200 km/h because the gravel prevented effective deceleration, so the death may have been instantaneous. Therefore, the death was considered an isolated injury and was not included in the analysis of site of injury. One driver with concussion was sent to hospital, but there were no significant findings on computed tomography scan.
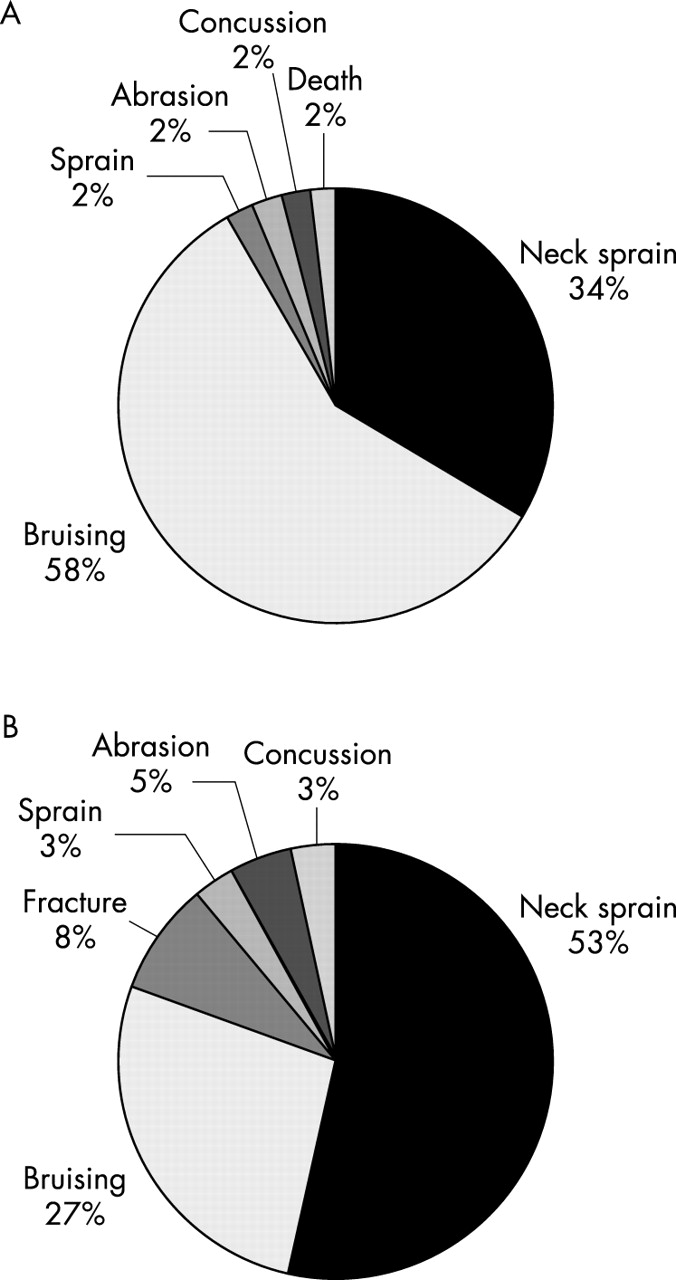
Types of injury acquired during single seat car (A) and saloon car (B) racing.
Analysis of the injured body sites showed that most injuries were to the neck (34%; n = 17; fig 2A). The next most injured body sites were the lower limbs (24%; n = 12); 11 of these 12 injuries were bruises and the other was an ankle sprain. The number of injuries to the upper limbs was smaller (14%; n = 7). Six of these seven injuries were also bruises, and the other one was an abrasion. Head/face injuries accounted for 10% (n = 5); four of these injuries were bruises to the head, and one was a concussion. This shows that the head was prone to hard impacts even though helmets were worn.

Distribution of injuries acquired during single seat car (A) and saloon car (B) racing by body site.
One driver seen at the medical centre after the race complained of pain in both forearms. This was thought to be compartment syndrome, but he had no nervous symptoms.
Saloon car racing
The number of participating cars was 1577, in 42 races. There were 62 injuries recorded during the race and 12 afterwards. The in-race injury rate accounted for approximately 0.9 per 1000 competitors per race.
Most of the in-race injuries were neck sprains (53%; n = 33; fig 1B). Bruises accounted for 27% (n = 17); this was much less than in single seat car racing. There were five fractures; these were diagnosed at the hospital. Three were tibial, one was an L1 burst fracture, and another was a Bennett fracture. The rest of the injuries were concussion, sprain, and abrasion. Two drivers who had concussion were also sent to the hospital; there were no significant findings on computed tomography scan.
The neck was the most commonly injured body site (53%; n = 33; fig 2B). The next most common site of injury was the upper limbs (21%; n = 13), more than lower limb injuries, which accounted for 16% (n = 10). Head/face injuries accounted for 5% (n = 3); two of these were concussions and one was a face abrasion. The abrasion may have occurred because the helmet rubbed against the face when it shifted during impact.
More injuries were recorded after the race than for single seat cars. Four of the 12 “injuries” were dehydration. One driver had a stomach ache, and the other seven cases were orthopaedic problems. Two of the latter were right shoulder pain, and the drivers could not lift their arms.
DISCUSSION
There are some difficulties in analysing the incidence of injuries among racing drivers, because the conditions of each race are not always the same. The number of participating cars can vary from race to race. As the number of cars increases, more accidents are likely to occur. Also, the speed is different in each category—accidents with faster cars may be more common and severe than with slower cars. Therefore the injury incidence can differ from race to race. These factors which are specific to motor sport make analysis difficult.
We selected races involving professional drivers only because there may be a difference between incidents involving novice drivers and those involving professional drivers. Furthermore, the racing cars used in professional categories are faster. In addition, we investigated two different types of car, saloon and single seat, hypothesising that the difference in car design would affect the injury profile. The main differences are: (a) the saloon car has a roof—that is, the cockpit is an enclosed space—but the single seat car is open; (b) the cockpit of the single seat car is cramped, especially with regard to leg room. In contrast, the cockpit of the saloon car is relatively spacious.
Bruises accounted for 27% of the injuries in saloon car racing, whereas bruises accounted for 58% of the injuries in single seat car racing. Analysis of the body sites where bruises occurred in the two groups showed that lower limb injuries were more common in single seat car racing, and upper limb injuries were more common in saloon car racing. This can be explained by the lack of leg room in single seat cars.
The National Highway Traffic Safety Administration of the United States investigates traffic accidents, using the National Accident Sampling System Crashworthiness Data System (CDS). Their data for car accidents between 1988 and 1989 show that injuries to the arms are more common than to the legs.10 This is the same as our data on saloon cars, the design of which is based on ordinary cars. In our research, neck injuries accounted for 53% and head/face injuries 5% of the total in saloon cars. In single seat cars, the corresponding percentages were 34% and 10%. The distance to the steering wheel is short in single seat cars compared with saloon cars, so drivers are susceptible to hitting their head/face on the steering wheel when they crash. This may explain the higher head/face injury rate. The chances of hitting the steering wheel may be low in saloon car racing, but tension forces on the neck may be higher when the head has to stop without hitting something. Therefore the neck injury rate in saloon car racing is high. The head/face injury rate was not high in either group compared with CDS data (39%), and all injuries were classified as abbreviated injury scale (AIS) 1, which is produced by the Association for the Advancement of Automotive Medicine (table 2).11 This is because racing drivers are restrained by six point seatbelts, and helmets protect their heads.
Abbreviated injury scale (AIS) injury levels
The percentage of neck injuries was high in both groups, but there were no serious injuries such as fractures or dislocations, and all neck injuries were sprains classified as AIS 1. This may be because the driver’s neck does not encounter excessive pure tensile, tension-extension, and lateral bending loading. It has been suggested that pure tensile loading on the neck without any other force must exceed 100 G to produce severe neck injuries.12 Such a G force is not likely to occur in most crashes. Furthermore, even though the driver hits his head somewhere in the cockpit, the neck may not encounter traumatic tension-extension and lateral bending loading. This is because the six point seatbelt restrains the body from moving too much when the car crashes, and thus the head does not strike the front with excessive force, which may produce tension-extension injury. Moreover, the headrest of the bucket seat used in the saloon car and the design of the single seat car, which protects the sides and back of the head, also prevent tension-extension and lateral bending loading.
Two out of three head/face injuries in saloon cars and one out of six head/face injuries in single seat cars were concussions. The three patients with concussions had amnesia or confusion, but no loss of consciousness. This incidence of concussion is approximately 1.3 per 1000 drivers in saloon car racing (which is a rate of about 4.8% per race) and approximately 1.0 per 1000 drivers in single seat car racing (which is a rate of about 2.6% per race). In soccer, which has a comparably high incidence of concussion to American football, the rate of concussion is 0.15–0.34 per 1000 athlete exposures (estimated rates are about 1–2% per season for a typical female or male collegiate soccer player).13 This shows that motor racing has a high rate of concussion compared with other high risk sports, even though drivers are protected by seatbelts and helmets.
What is already known
Racing drivers are known to suffer various disorders; low back pain is typical. Injuries are known to occur in motor sport, but there are few data on the injuries specific to this sport.
What this study adds
Injuries to racing drivers during and after the race were investigated. A difference was found between injuries in single seat and saloon car racing. Neck injuries were not severe, but the concussion rate was higher than in other sports.
There is now a device to prevent head and neck injuries called the head and neck support (HANS) (fig 3A). This is designed to reduce movement of the driver’s head in a crash and thereby the force on the neck. In our research, there were no fatal neck injuries, but many neck sprains. This device may prevent such neck injuries and may also decrease head injuries. It is not certain how concussions occur when racing cars crash. It may be the result of hitting the head against something in the cockpit or the result of the sudden acceleration of the head. HANS restricts head movement through tethers attached to the driver’s helmet (fig 3B), therefore it may cause the head to stop suddenly during a crash. We are concerned that such an abrupt deceleration may result in traumatic force on the brain.

The head and neck support (HANS) in the normal position (A) and in a crash (B).
Twelve injuries were recorded after saloon car races. Four involved dehydration, and occurred after Grand Touring (GT) races, which were held in the summer. A driver is sometimes required to drive for more than an hour in hot conditions. The temperature in closed cockpits, which is very different from single seat cars, can rise to about 70°C in hot conditions.14 This explains the occurrence of dehydration in such races. The one case of stomach ache may have resulted from stress under such extreme conditions.
An interesting post-race symptom, which occurred in two drivers, was an inability to raise their arms. This was probably due to exhaustion of the deltoid muscles. Drivers control the heavy steering wheel by stretching their arms forward, and, during a long race, this may contribute to these symptoms. There were four other symptoms and injuries to the upper limbs (forearm compartment syndrome, wrist pain, de Quervain’s disease, palm abrasion). This also reflects the tension on the upper limbs during a race.