Article Text

Abstract
Objective: To examine the course of pain, physical function, and other health dimensions after a comprehensive inpatient rehabilitation intervention in patients with osteoarthritis (OA) of the hip or knee.
Methods: An observational, prospective cohort study with assessments at baseline (entry into clinic), 1 (discharge from inpatient rehabilitation), 3, 6, 9, 12, and 24 months after baseline. Consecutively referred patients to an inpatient rehabilitation centre fulfilling the inclusion criteria were studied. 3–4 week comprehensive rehabilitation intervention, including strengthening exercise, flexibility training, endurance training, relaxation strategies, and consultations for preventive measures, was carried out. Individual home rehabilitation programmes were taught. Generic health status was measured using the SF-36, condition specific health was measured with the WOMAC questionnaire. Effects were analysed with sensitivity statistics (effect size, ES) and non-parametric tests.
Results: Data from 128 patients with complete follow up data were analysed. Both pain and physical function improved moderately (WOMAC pain: ES = 0.56, WOMAC function ES = 0.44) until discharge. Although the effect in pain reduction remained significant by month 24 (WOMAC: ES = 0.26), physical function deteriorated close to baseline values after 12 months.
Conclusions: Comprehensive inpatient rehabilitation of patients with OA of the hip or knee may improve pain and physical function in the mid-term, and pain in the long term.
- follow up study
- osteoarthritis
- rehabilitation
- SF-36
- WOMAC
- DALYs, disability adjusted life years
- ES, effect size
- MCID, minimal clinically important difference
- NSAIDs, non-steroidal anti-inflammatory drugs
- OA, osteoarthritis
- SDD, smallest detectable difference
- SF-36, Short Form-36, WOMAC, Western Ontario and McMaster Universities Osteoarthritis Index
Statistics from Altmetric.com
- DALYs, disability adjusted life years
- ES, effect size
- MCID, minimal clinically important difference
- NSAIDs, non-steroidal anti-inflammatory drugs
- OA, osteoarthritis
- SDD, smallest detectable difference
- SF-36, Short Form-36, WOMAC, Western Ontario and McMaster Universities Osteoarthritis Index
Osteoarthritis (OA) is among the five most disabling diseases, having a remarkable public health impact of 4.7×10⁶ disability adjusted life years (DALYs) in the developed countries in 1990.1 The prevalence of OA has been assessed at 12% in the American population.2 Because of its high prevalence in the increasing population of elderly people an increase of 0.9×10⁶ DALYs (19%) up to 5.6×10⁶ DALYs is estimated under the present conditions for 2020.3 Direct and indirect costs for OA of the knee and hip in America in 1994 were $12.9 billion.4
Treatment options for OA are pain relief with analgesics (paracetamol, opioids) and non-steroidal anti-inflammatory drugs (NSAIDs),5,6 exercise,7–10 patient education,11 and finally, joint arthroplasty.12,13 The recommendations of the European League against Rheumatism14 and the guidelines of the American College of Rheumatology include all these treatment options.15,16 Both sets of recommendations emphasise that the treatment should be individually tailored to the patient.
Comprehensive treatment programmes combine some of these treatment options. To the best of our knowledge, no study has analysed the effect size of a comprehensive rehabilitation intervention on patients with OA of the hip or knee in the long term.
This study examined the course of pain and physical function as measured by the condition-specific patient questionnaire, the Western Ontario and McMaster Universities Osteoarthritis Index (WOMAC),17–21 and the generic health status measure, Short Form-36 (SF-36),22–26 in patients with OA of the hip or knee before a comprehensive rehabilitation intervention and for a 24 month follow up period. We suggested that a comprehensive rehabilitation programme reduces pain and improves function for a period of up to at least 1 year.
METHODS
Design
An observational, prospective 24 month cohort study was conducted of patients with OA of the hip or knee who had completed an inpatient rehabilitation intervention.
Setting
Patients were recruited from the Zurzach Rheumatology and Rehabilitation Clinic, Switzerland. They were referred by their family physician or rheumatologist with the diagnosis of hip or knee OA to a comprehensive inpatient rehabilitation intervention. According to the regulations of the Swiss health insurance companies, payment for the inpatient rehabilitation was only granted to patients who still had OA symptoms after completion of four series of nine treatments of outpatient physiotherapy and required further treatment.
Patients
Consecutive patients with hip or knee OA were invited to participate in the study. Patients were included if they (a) agreed to participate in the study by written, informed consent and (b) fulfilled the American College of Rheumatology criteria for OA (see below). Patients were excluded if they (a) had a history of drug abuse or non-compliance; (b) had not sufficient German language skills to complete the assessment tools; (c) had a severe illness; or (d) did not want to participate in the study. During follow up, patients were excluded if they (a) underwent a joint arthroplasty; (b) had the following illnesses: terminal cancer, chronic heart failure NYHA IV, asthma requiring continuous oxygen treatment, moderate or severe dementia; (c) died; (d) refused further participation; (e) did not return questionnaires; or (f) if their questionnaires were incomplete according to the missing rules of SF-36 or WOMAC as described below.
Intervention
The intervention was a comprehensive rehabilitation intervention of, usually, 3–4 weeks. Its components consisted of individualised physiotherapy, a group exercise programme, group hydrotherapy, swimming, thermal therapy, patient education, massage, and electrotherapy. Table 1 gives details of the interventions. NSAIDs and analgesics were minimised as far as possible. The programme was individually tailored to each patient. Finally, each patient was trained to continue an individual home rehabilitation programme after discharge.
Treatment programme
Measures
The diagnosis of OA was based on the American College of Rheumatology criteria for OA of the hip or knee.27,28 Inclusion criteria for knee OA were (a) knee pain for more than 25 of the past 30 days; (b) morning stiffness of less than 30 minutes; and (c) crepitation in the knee or (a) knee pain for more than 25 of the past 30 days and (b) osteophytes on x ray examination of the knees. Patients with hip OA were included when there was (a) hip pain for more than 25 of the past 30 days and (b) at least two of the following three criteria: (i) erythrocyte sedimentation rate <20 mm/1st h; (ii) osteophytes on x ray examination; or (iii) obliteration of joint space.
Pain and function were measured with the WOMAC17 and the SF-36.22 Primary outcome measures were the WOMAC scales for function and pain, and the SF-36 scales for bodily pain and physical functioning. A set of questionnaires including these two instruments was sent or given to the patients at the day of entry (baseline examination), at the day of discharge (about 1 month follow up), and 3, 6, 9, 12, 24 months after baseline.
The WOMAC is an OA-specific multidimensional measure of pain (5 items), stiffness (2 items), and physical functional ability (17 items).17–20 All 24 WOMAC items are rated on a numerical rating scale ranging from 0 (“no symptoms/no limitation”) to 10 (“maximal symptoms/maximal limitation”), which is the format used in the German validation study.21 Similar to the visual analogue scale, this rating provides interval-type data. The mean of the corresponding unweighted item scores results in the score of each scale and, thus also ranges between 0 (no symptoms) and 10 (maximal symptoms). The global WOMAC score was calculated as the unweighted mean of all 24 items.
The SF-36 includes 8 multi-item scales containing 2 to 10 items each plus a single item to assess health transition.22–24 The scales cover the dimensions of physical functioning (unweighted mean of 10 items), role physical (4 items), bodily pain (2 items), general health (5 items), vitality (4 items), social functioning (2 items), role emotional (3 items), and mental health (5 items), ranging from 0 (“maximal symptoms/maximal limitations/poor health”) to 100 (“no symptoms/no limitations/excellent health”). We used the validated German version.25,26 Studies showed excellent psychometric properties and there seems to be a good responsiveness to change in patients with rheumatic conditions, compared with some longer instruments.29 The SF-36 allows scoring of the eight above mentioned scales and the construction of two summary scales—namely, the physical component summary and the mental component summary scale.
Intake of pain medication was recorded at baseline (entry into the clinic) and at each follow up.
Data collection procedures
At entry into the rehabilitation clinic, a trained clinician examined the patient and completed the inclusion and exclusion criteria form. A patient who was included was supplied with and instructed in the completion of self administered questionnaires (WOMAC, SF-36). On the day of discharge, the patients were requested to complete a second set of questionnaires. At 3, 6, 9, 12, and 24 months further questionnaires were sent to the patients for completion.
Analyses
Questionnaires were scored in accordance with the missing rules of the WOMAC user’s guide, which specifies completion of at least 4 of the 5 pain items, 1 of the 2 stiffness items, and 14 of the 17 function items.19 Further, in concordance with the SF-36 Health Survey Manual and Interpretation Guide,23 each scale of the SF-36 must have at least 50% of the corresponding items answered to be calculable. Patients with incalculable questionnaires either at baseline or at month 24 were excluded.
The responsiveness was assessed by the effect size (ES)30,31 at all follow up times. The ES equals the mean change in score divided by the standard deviation of the baseline score. ES thus relates to the change of the mean and to the initial variation in score. An ES of 0.2 is considered a small (beneficial) effect, 0.5 a moderate effect, and 0.8 a large effect of treatment.30,32 Standard error (SE) and 95% confidence intervals (CIs) for the ES were computed by the SE of “Glass’s delta” as described by Rosenthal:33

where n = the number of patients. For calculating the CI the following equation was used:

To examine the statistical significance of change in scores, we tested the data for normality and performed paired t tests if the data were normally distributed, otherwise, we used the Wilcoxon signed ranks test. The null hypothesis was that there was no change. The type I error α was set at 0.05 and the power at 0.8. All data analysis was performed with SPSS for windows, version 10.0. Follow up scores were illustrated by simple follow up graphs. A SF-36 “spider figure” demonstrated the comprehensive assessment of the health status between two times.34
A sensitivity analysis was performed to examine whether the results obtained after 24 months showed any selection bias as a result of drop outs. In studies of older patients with OA and employing a long follow up period, a high drop out rate is to be expected—for example, due to surgery (joint replacement) becoming necessary, change of address, patient death, etc. It is also possible that the patients who drop out of the study have different baseline characteristics from those who remain in the study and complete the follow up. The first step in the sensitivity analysis was a logistic regression analysis to determine which independent variables significantly predicted completion/non-completion of the study with 24 months’ follow up ( = the dependent variable). For the selection of variables a backward selection was used. The ES was then calculated for given levels (strata) of these predictor variables, using the data available from those who completed the study. Finally, the ES was multiplied by attrition weights, which correct for a change in the distribution of the significant independent variables from baseline to follow up, and which depend on the odds ratios for completion/non-completion.
RESULTS
Patients
Three hundred and fifty eight patients were consecutively referred to the rehabilitation clinic between September 1997 and December 1999 with the diagnosis of OA. One hundred and fifty patients did not fulfil the inclusion criteria. From the remaining 208 patients, 80 (38%) had dropped out by month 24 for the following reasons: 11 refused to participate by month 24, 11 did not return the questionnaires or could not be contacted, 48 underwent joint arthroplasty, 6 had a severe illness, 1 died, and 3 could not be analysed owing to missing values, according to the “missing data” rules of the WOMAC and the SF-36. This resulted in 128 patients with complete data.
Patient characteristics
Table 2 lists the baseline characteristics of all patients
Baseline characteristics of patients with hip or knee OA (n = 358)
The patients with complete follow up data had a mean age of 63.9 years. Of these patients, 85/128 (66.4%) were female and 84/128 (65.6%) had knee OA. An intake of NSAIDs, analgesics, or both, was reported by 66.4%.
The patients who did not fulfil the inclusion criteria had a mean age 4.9 years greater than that of the patients included (t test: NS). The patients who underwent a joint arthroplasty during follow up were more often female (79.2% v 66.4%) and took more NSAIDs, analgesics, or both (75.1% v 66.4%), than the patients included. A comparison of the WOMAC pain and function scales (significant group differences only in function, t test, p<0.05) in the subjects included and excluded showed slightly worse mean scores in those excluded.
The costs of rehabilitation were covered by private health insurance in 15%, by national health insurance in 55%, and by a combination of private and national health insurance in the remaining 30% of cases.
Responsiveness statistics
Tables 3 and 4 summarise the responsiveness of the rehabilitation at the end of rehabilitation and at 6, 12, and 24 months in comparison with baseline. Testing for normality did not allow performing t tests for all scales and so we used the Wilcoxon signed ranks test for significance.
Outcome of patients with hip or knee OA from baseline to the 6 months’ follow up (n = 128)
Outcome of patients with hip or knee OA from 12 months’ to 24 months’ follow up (n = 128)
The patients showed moderately beneficial effects—that is, ES around 0.5,33 in the primary outcome variable pain and small to moderate effects in the primary outcome variable physical functioning at the end of rehabilitation. This was measured with the condition-specific WOMAC questionnaire and the generic instrument SF-36 (ES in the WOMAC pain scale was 0.56 and in the SF-36 bodily pain scale 0.52; ES in the WOMAC function scale was 0.44 and in the SF-36 physical functioning scale 0.30).
As opposed to the moderately beneficial effect in pain, there were only small to moderate effects for stiffness (WOMAC stiffness scale ES = 0.38) and small effects in the SF-36 role physical scale (ES = 0.25). The general health scale of the SF-36 showed almost no effect (ES = 0.11).
According to the effects in the subscales, moderate effects at the end of the intervention were also seen in the global WOMAC score (ES = 0.49), which is composed of pain, function, and stiffness, and in the physical component summary of the SF-36 (ES = 0.37), which integrates physical functioning, role physical, bodily pain, and general health.
Still significant, but relatively minor, effects were seen in three of the four SF-36 scales measuring domains of the mental health (vitality ES = 0.25, social functioning ES = 0.23, and mental health ES = 0.19). The SF-36 role emotional scale showed no effect (ES = 0.07).
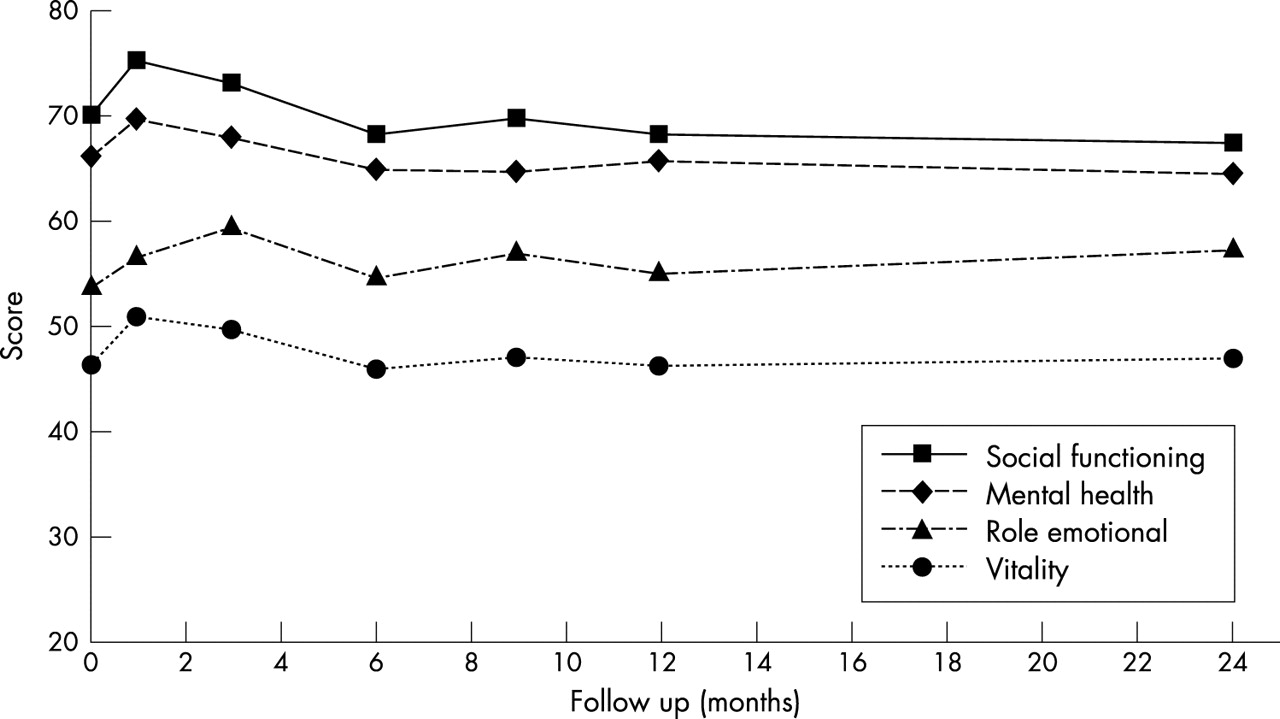
Figure 1 shows the change of the SF-36 scales between baseline (entry into the clinic) and discharge graphically. Figures 2, 3, and 4 show the course as measured with the WOMAC and SF-36 over 2 years. While the effect in pain reduction remained until month 24 (WOMAC: ES = 0.26; SF-36: ES = 0.49), physical function deteriorated close to the baseline values after 12 months (WOMAC function scale ES = 0.07; SF-36 physical functioning scale ES = 0.07). The already small effects at the end of rehabilitation in the SF-36 scales for vitality, social functioning, and mental health disappeared at the 3 month follow up: vitality ES = 0.19, social functioning ES = 0.13, and mental health ES = 0.11.

Global health status of patients with hip and knee OA by the SF-36 scales at baseline and at discharge (n = 128). Baseline = entry into the clinic. Discharge of the clinic = about 1 month after baseline. A larger “spider” figure represents a better health status. 0 = worst health; 100 = best health.
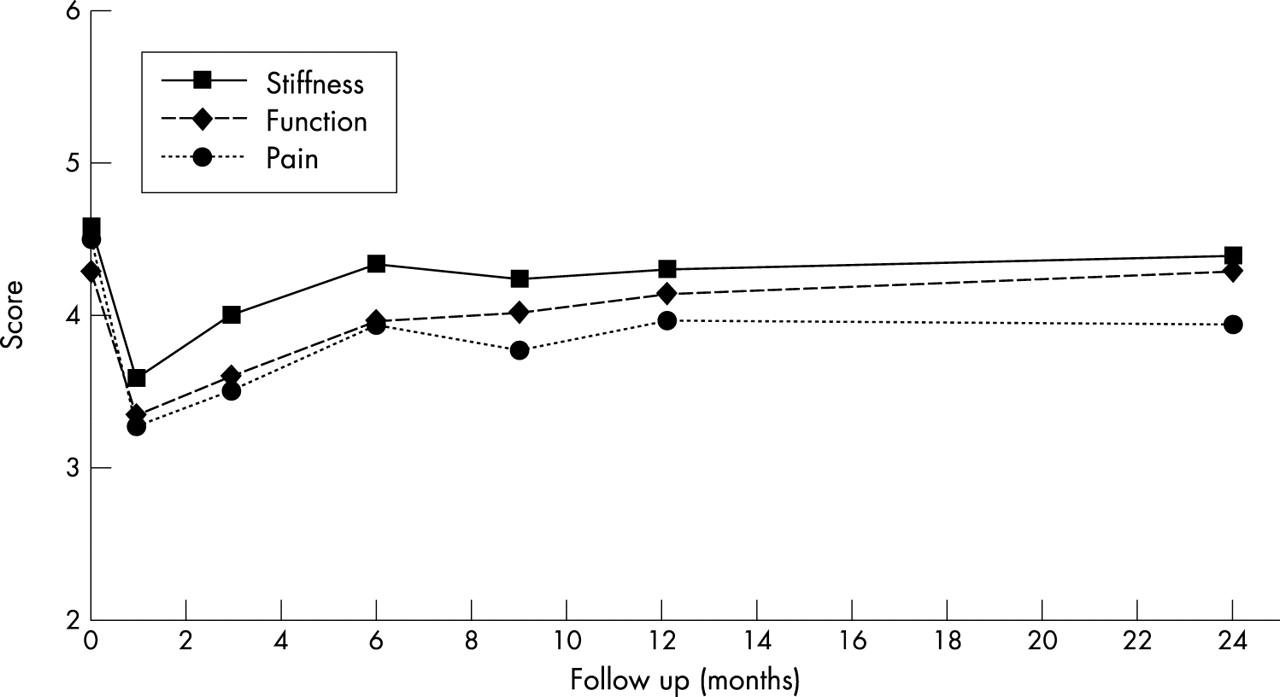
A 2 year follow up of patients with hip and knee OA by WOMAC scales (n = 128). Patients were assessed with the WOMAC at baseline ( = entry into the clinic), at discharge (1 ?month after baseline), and at months 3, 6, 9, 12, and 24. 0 = no symptoms; 10 = maximal symptoms.

A 2 year follow up of patients with hip and knee OA by the SF-36 scales for physical health (n = 128). The times of assessment are listed in the legend to fig 2. 0 = worst health; 100 = best health.
A 2 year follow up of patients with hip and knee OA by the SF-36 scales for mental health (n = 128). The times of assessment are listed in the legend to fig 2. 0 = worst health; 100 = best health. The intake of NSAIDs or analgesics or both declined from 66.4% at baseline to 11.0% at the end of rehabilitation. Until month 12 the level of the intake of drugs climbed to the baseline values (67.2%) and did not change significantly until month 24 (63.3%).
Sensitivity analysis
Logistic regression showed that the following variables significantly predicted completion/non-completion of the study: the affected joint (hip/knee), the baseline scores of WOMAC pain and WOMAC physical functioning, and the SF-36 summary score. Because the WOMAC and the SF-36 both measure health similarly (but the WOMAC does it more responsively) and the two are highly correlated, only the WOMAC scores, in addition to the affected joint, were examined in further detail. For the WOMAC scores ES were then determined for every 10th centile of the baseline scores, to examine where significant changes (“break points”) of the ES occurred. This was the 30th centile for WOMAC pain, and the 50th centile (median) for WOMAC function (data not shown in detail). It was also exactly at these break points that the ES changed in sign—that is, the health status of the “good” patients worsened, and that of the “poor” patients improved. ES above and below these break points were calculated. Table 5 compares the observed ES and the ES that would be expected if the drop out rates in the different strata of WOMAC scores and affected joints were equal. None of the differences between the expected and the observed ES were significant (t test, p<0.05).
Sensitivity analysis
DISCUSSION
In this observational follow up study of patients with hip or knee OA undergoing a comprehensive rehabilitation intervention, we found a moderate and long term improvement of pain and a moderate but mid-term improvement of physical function.
A sensitivity analysis was performed to account for attrition during the follow up. Baseline pain status, physical function status, and the OA joint were found to have the highest impact on the probability of successfully completing the study. Stratified determination of the effects showed large differences in the ES. For example, the patients who felt little pain (0–30th centile: the “good”) worsened by −0.46 in WOMAC pain, whereas those who reported more pain (31th–100th centile: the “poor”) improved by 0.75. Between baseline and the 24 month follow up, a higher rate of “poor” patients dropped out, so that the expected ES would have been higher (0.38) than the observed ES (0.26) if all patients could have been followed up. That the WOMAC scores of the “poor” are more likely to improve than those of the “good” is well known.35 The effects, therefore, were underestimated. In contrast with this, more (than expected) patients with hip OA—who improved less than the patients with knee OA—dropped out, which led analogously to a slight overestimation (for example, 0.26 v 0.25 in WOMAC pain) of the effect. Our effects, however, would be overestimated, if it were assumed that those patients who showed a negative course—that is, a worsening of health (despite rehabilitation therapy or not), were more likely to undergo joint arthroplasty. In summary, it is difficult to predict what the resulting effects of all the patients would have been if they could all have been followed up; however, this is the situation we meet daily in clinical practice. It is, nevertheless, worth examining the effects in certain subsamples to understand more about the course and the treatment effects.
In this study we applied an observational, naturalistic design within a routine rehabilitation setting with “real” patients. According to the limitations of this design, as described above, the true ES may vary to some extent from the reported treatment effects. On the other hand, this design provides the possibility of obtaining some evidence that exercise therapy improves function and pain not only under the specific conditions of a randomised controlled trial but also in the clinical reality of a common rehabilitation setting.
The ES at the end of rehabilitation were in the same range as in clinical trials with exercise therapy. In a systemic review in 1999 van Baar et al found three OA exercise therapy studies with good validity.36 The first of these studies8 showed an ES of 0.58 for pain measured with a visual analogue scale, and an ES of 0.26 for self reported disability measured with the IRGL questionnaire (Influence of Rheumatic Disease on General Health and Lifestyle) after 12 weeks of treatment. The second and third study,7 which were performed in one setting (FAST—the Fitness Arthritis and Seniors Trial), used the knee pain scale as measure for pain and a specially developed questionnaire for self reported physical disability. After 18 months, the ES of pain were 0.47 and 0.31 and of self reported disability the ES were 0.41 and 0.36. Although the magnitude of the ES was influenced by the responsiveness of the outcome instruments, it seems likely that the 4 week comprehensive inpatient intervention in this study had a comparable effect to these three exercise interventions.
Comprehensive inpatient rehabilitation programmes are usually more expensive than outpatient exercise programmes, which seem to be similarly effective. However, for some patients there may be factors which indicate that inpatient treatment is preferable. For example, comorbidities like coronary heart disease, which often lead to exclusion from outpatient treatment due to the risk of complications. For instance, in the “Fitness Arthritis and Seniors Trial”,7 cardiac ischaemia during an exercise treadmill test was an exclusion criterion. Several other concomitant disorders, especially pulmonary diseases, obesity, or further problems of locomotion besides OA are common in patients with hip and knee OA. Owing to the available medical facilities, these multiply affected patients can be treated more safely in an inpatient clinic. Additionally, for some patients with coronary heart disease or pulmonary diseases, an operation may be a high risk or even impossible. In those patients, all non-operative treatment options should be used to avoid disability, which would be more expensive than inpatient treatment. Therefore, all main European health insurance companies pay for inpatient treatment if it is likely that disability cannot be prevented by other treatments. Another problematic group for outpatient treatment are elderly patients with severe OA, especially those living in rural areas, who are unable to (or only at high expense) attend for outpatient treatment which requires a large number of sessions. Therefore, the decision for inpatient or outpatient treatment should be made individually according to each patient’s situation.
There was no persisting beneficial effect in function measurement in our patients after 1 year, although the patients had been instructed to follow an individual home based exercise programme. This is consistent with the results of a 1 year follow up of patients who participated in a programme of supervised fitness walking and supportive patient education.37 In that study self reported disability measured with the AIMS (Arthritis Impact Measurement scale) improved significantly after an 8 week programme. The patients were encouraged to continue walking. Nevertheless, after 1 year, there was no statistical significant difference in disability between the walking group and the control group. The authors described the long term adherence to the walking as low, but detailed data of the adherence were not published. Low adherence to the instructed home based programme may also be a possible contributor to the disappointing long term outcome in physical functioning in our study.
To maintain longlasting functional benefit, exercises probably need to be continued for life. Exercise behaviour before starting an exercise programme has been described as the strongest predictor for compliance.38 The problem seems to be how to encourage a former sedentary person to do exercises. Short booster sessions, self help groups, or the use of patient diaries have been recommended to increase adherence. However, there is still a lack of controlled clinical trials proving the success of these concepts.
When interpreting the results for physical function, one needs to keep in mind the progressive nature of OA. Therefore, even a stable physical function may represent a treatment success. However, the progression of illness without treatment was not proved by a control group.
The longlasting pain reduction in this study remains in contrast to the mid-term benefit in physical functioning. This result is in line with a recently published 9 months’ follow up exercise therapy study in patients with OA of the hip or knee.39 After 24 weeks (12 weeks after completion of treatment) that report found a decreased, but still significant, pain reduction, whereas the improved observed disability had declined to insignificant values.
During follow up, 48 patients underwent joint replacement. This group of patients was defined as dropouts from the long term follow up, because it was impossible to distinguish the effect of the rehabilitation intervention from the effect of the surgical intervention. However, at the end of rehabilitation these patients showed a beneficial ES of 0.57 (compared with 0.49 in the group with complete follow up) in the WOMAC global score. An improved physical function before joint replacement results in a improved outcome after joint replacement.40 Therefore it can be assumed that this group of patients required less rehabilitation after their joint replacement than they would have needed without the prior rehabilitation intervention.
The patients with hip OA more often underwent joint arthroplasty during follow up than the patients with knee OA (34% v 14%), although the WOMAC global scores at baseline were higher in the patients with knee OA (knee 4.9 v hip 4.5). We suggest that the difference in the rate of joint arthroplasty is because knee arthroplasty has been developed more recently, and the recovery in pain and function is slower in patients receiving knee arthroplasty than in patients with hip arthroplasty.41 Therefore, the patients as well as the orthopaedic surgeons may be more predisposed towards hip arthroplasties.
The patients who underwent total joint arthroplasty in this study were younger (mean age 64.9 v 68.8–71.2 years) and had lower WOMAC global baseline scores (4.36 v 5.61–5.98) than patients in other clinical studies in Europe.42,43 The earlier point in time of operation may be a result of the education of treatment options during the rehabilitation intervention. This may be a benefit because patients operated on earlier in the course of functional decline may have better outcomes.44
Patients referred to the clinic with OA but not included in the study were 4.9 years older than the patients included. This difference may have been caused by exclusion criteria such as “difficulties in completing questionnaires”, “having severe illness”, or “joint arthroplasty planned within the next month”. Accordingly, the health status of the excluded patients might have deteriorated, which could limit the generalisability of this study.
Before implementing a treatment, the clinician wants to know if a statistically significant effect is clinically meaningful. Therefore, the concept of minimal clinically important difference (MCID) can be helpful. The MCID is the minimal effect that patients consider clinically perceptible. For the WOMAC pain scale, an improvement of 18% of the mean baseline value was described as the MCID.35,45 In our study 18% of the mean baseline value was 0.81 points. The minimal clinical important ES in this study can be calculated as follows: ES = 0.81/SD (of mean baseline) = 0.37. Up to the 3 months’ follow up, the ES was greater than 0.37. At the later follow up the effect measured with the WOMAC pain scale remained statistically significant, but the ES was smaller than 0.37 and, therefore, these effects may not be clinically meaningful.
When planning a study it is important to know if an MCID can be detected by the chosen outcome instruments. Therefore the smallest detectable difference (SDD) should be calculated.45 In this study the SDD for improvement of pain measured with the WOMAC was an ES of 0.35 (power = 0.8, type I error = 0.05). The SDD in this study was smaller than the MCID. Thus, the WOMAC pain scale was sensitive enough to detect the MCID in pain.
As before, when we measured 223 patients with OA, including the sample in this study, for 3 months we found that the WOMAC was more responsive than the SF-36 to the improvement in physical function and similarly responsive to pain reduction at the end of rehabilitation.46 At the 12 month and 24 month follow up, the SF-36 was more responsive to pain. These results indicate that the WOMAC seems to be the better instrument for measuring self reported disability after rehabilitation, whereas the SF-36 bodily pain scale more adequately detects a long term pain benefit. This should be considered in the choice of outcome instruments in future clinical trials.
In conclusion, this study suggests that comprehensive inpatient rehabilitation of patients with hip or knee OA can result in a substantial long term reduction of pain, which declines only slightly with time, and in a mid-term benefit in physical function. Future follow up studies should examine the adherence to instructed exercise programmes, and when randomised could answer the question whether comprehensive rehabilitation programmes have a preventive effect by stabilising physical function. The encouraging long term benefit in pain in this study should be considered when discussing the cost effectiveness of comprehensive rehabilitation programmes.
Acknowledgments
This study was supported by the Zurzach Spa Foundation, Switzerland.
We thank Susanne Lehmann for the management of the patients, the questionnaires, and the database, and Isabelle Ginsberg and Assistant Professor Anne F Mannion, for the English editing.