Article Text

Abstract
Objective The aim of the study was to evaluate the reported measurement capabilities and predictive validity of the Functional Movement Screen (FMS) for injury.
Methods This was a prospective observational longitudinal study of 24 male footballers from a single team in England, alongside analysis of an existing database over one season (September 2015–May 2016). A preseason FMS was carried out with scores recorded by an experienced assessor and derived, retrospectively, from the three-dimensional movement data that were simultaneously captured. The assessor scores were compared with the photogrammetric system to determine measurement validity, and predictive validity was quantified by assessing sensitivity and specificity (cut-off score of 14).
Results The real-time assessor score matched the photogrammetric score awarded for one of the participants, was higher than the photogrammetric system for 22 participants and was lower than the photogrammetric system in 1 participant. There was no discernible relationship between FMS scores and the competencies required to be met as per the rules articulated for the allocation of a score. A higher number of total injuries were associated with higher FMS scores, whether determined through real-time assessment or codification of kinematic variables. Additionally, neither method of score determination was able to prospectively identify players at risk of serious injury.
Conclusion The FMS does not demonstrate the properties essential to be considered as a measurement scale and has neither measurement nor predictive validity. A possible reason for these observations could be the complexity in the instructions associated with the scale. Further work on eliminating redundancies and improving the measurement properties is recommended.
- FMS
- functional movement screen
- validation
- football
- injury
- injury prediction
- motion analysis
- exercise
This is an Open Access article distributed in accordance with the Creative Commons Attribution Non Commercial (CC BY-NC 4.0) license, which permits others to distribute, remix, adapt, build upon this work non-commercially, and license their derivative works on different terms, provided the original work is properly cited and the use is non-commercial. See: http://creativecommons.org/licenses/by-nc/4.0/
Statistics from Altmetric.com
What are the new findings?
This is the first study to codify all components of the Functional Movement Screen (FMS) scoring process.
Codification of the FMS scoring process has demonstrated the complexity and redundancies within the system.
The FMS scale and scoring criteria does not demonstrate itself as a scale in any structured order and therefore cannot be considered a measure; therefore, it compromises clinical applicability.
The thresholds used to predict injury may not be valid whether scores are determined by a real-time assessment or an objective assessment of three-dimensional kinematics.
Introduction
Sports and exercise medicine practitioners wish to reduce the risk of injury for individual players and mitigate the impact of overall injury rates on team performance. They therefore need to decide whether a team member’s condition means they are safe to train and play in the squad. Several methods exist to help inform decision-making processes, and within football the Functional Movement Screen (FMS) has been identified as the most commonly used screening test for prospectively identifying injury risk.1 Consequently, several studies have investigated the predictive ability of the FMS composite score (ranging from 0 to 21) within football,1–7 as well as other sporting and occupational disciplines,8–12 although the cut-off score (ranging from 11 to 18) and predictive ability of the FMS remain widely debated.13–16
Alongside the predictive ability of the FMS, it is also reportedly a scale for rating and ranking movement patterns and a method for assessing muscle strength, range of motion, asymmetry, balance and kinaesthetic awareness.17–20 The FMS primarily evaluates an individual’s ability to perform a series of seven independent exercise subtests against set criteria and rules (viz Deep Squat, Hurdle Step, Inline Lunge, Shoulder Mobility, Active Straight-Leg Raise, Trunk Stability Push-Up and Rotary Stability tests). The resulting score is based on how well an individual performs each expected movement explicitly described within these seven tests. A score of 3 is awarded if the movement is performed correctly without compensation, a score of 2 if the movement is completed but performed with compensation(s), a score of 1 if unable to complete the movement or assume a position required to perform movement, and a score of 0 in the presence of pain at any point during testing.18 However, some of the exercise tests (viz Shoulder Mobility, Trunk Stability Push-Up and Rotary Stability) are informed by additional clearing tests, which evaluate the absence or presence of pain (shoulder, spinal flexion and spinal extension clearing tests). Presentation of pain on a clearing test results in the lowest score of 0 being awarded for that subtest, regardless of performance against the movement criteria.17
While the FMS is evidenced as demonstrating suitable reliability,21 22 previous studies have raised concerns about the FMS structure, assumed equal weighting of subscores used in constructing the composite score for injury prediction23 and its ability to identify abnormal movement patterns.15 Despite the FMS being considered a movement score, it relies on the use of a measurement scale during the scoring process. A fundamental premise of the FMS is that it can measure and assign numerical values to movements which will meet the principles of a measurement.24 If the FMS is to be considered as having measurement validity, there should be discernible differences between the objective measures for different FMS scoring categories when comparing scores of the FMS against the objective measures of performance. Additionally, there should be consistent patterns between the objective measures for FMS scores of the same value. For the FMS to be considered a scale, it should demonstrate itself in a structured order when participants are ranked according to subscore, final score, number of injuries or injury severity. Additionally, disparities between assessor and objective-based measures have been identified, although not all components of the FMS were evaluated.16 It has been identified that there is insufficient evidence to conclusively determine the validity of the FMS for measurement of functional limitations and further evaluation of the FMS is required.1 13
The aim of this study was therefore to evaluate the measurement and predictive validity for all components of the FMS. Measurement validity was determined by comparison against a three-dimensional (3D) motion analysis system considered gold standard, and predictive validity was determined by evaluating the predictive power of the FMS.
Methods
A total of 25 male participants from a single football team competing in the British Universities and College Sports (BUCS) league were recruited. The data from one season (September 2015–May 2016) informed this study. One participant was excluded following screening due to an existing injury. Approval was given to (1) access an existing database and extract anonymous data related to injuries, screening, training/match play and demographic data, and (2) use the photogrammetric Vicon motion capture system (Vicon Motion Systems, Oxford, UK) to simultaneously quantify participants’ 3D kinematics during their preseason FMS. Subsequent injury surveillance was conducted by the team physiotherapist throughout the season. Players were contacted on a weekly basis via email regarding their injury status, and all reported injuries were clinically assessed and recorded in the database, which was established in accordance with the consensus statement for data collection and injury reporting.25
Inclusion criteria
Participants were eligible if they were older than 17 years of age, suitable for participation within the BUCS football league and able to provide informed consent.
Exclusion criteria
Participants actively undergoing rehabilitation from surgery or existence of a previously diagnosed injury at time of screening were not eligible for the study and therefore excluded.
Assessing measurement and predictive validity of the FMS
In order to assess the validity of the FMS, the FMS score allocated by an experienced assessor was compared with a referenced approach to calculating the scores based on the analysis of the actual movement. In order to obtain a reference score, a Vicon motion capture system, consisting of eight MX-T20 motion analysis cameras (Vicon Motion Systems), was used to concurrently record 3D kinematic movement patterns of the participant, as the assessor conducted the FMS tests. The Plug-in Gait Full-Body retroreflective marker set was used with additional placement of two pelvic and four thorax markers to compensate for marker occlusion. An additional temporary medial condyle marker was used for calibration of the knee axis during the static trial. Markers were tracked at 100 Hz and a Woltring filter26 was applied, as per the Plug-in Gait model. Data reconstruction and labelling was carried out using Vicon Nexus V.1.8.5. The dynamic Plug-in Gait model was used to determine joint kinematics for the lower limb. For the upper limb, a simple 13 marker set-up was used allowing the estimation of shoulder and elbow angles.
In order to obtain the reference score, the published scoring criteria and rules for each subtest had to be codified into quantifiable criteria and rules that could be applied to the kinematic measurements taken by the motion capture system. In order to quantify the Deep Squat FMS test, 11 rules were required, for the Hurdle Step 12 rules were required, for the Inline Lunge 14 rules were required, for the Shoulder Mobility 3 rules were required, for the Active Straight-Leg Raise 11 rules were required, for the Trunk Stability Push-Up 10 rules were required and for the Rotary Stability 23 rules were required. These rules are listed in online supplementary appendix 1.
online supplementary appendix 1
FMS testing protocol
The FMS was carried out by an experienced and certified assessor who had used the FMS in clinical practice and undergone training and accreditation through Functional Movement Systems. Prior to the marker placement, participants completed a warm-up in which they familiarised themselves with all the FMS exercise tests. These were completed a minimum of two times and up until they felt they had sufficiently practised the tests. The testing protocol and instructions were the same as those stipulated from the FMS handbook except for the following adaptations: participants were required to complete all three attempts for each test and on each side where appropriate. Participants were also required to complete all subtest variations. The left side was tested first for all participants.
Statistical approach to analysing the results
On completing the FMS test an individual was given two scores:
The first was allocated by the assessor applying the criteria and rules to a person carrying out the FMS.
The second was calculated by applying the codified criteria and rules to the 3D kinematic variables in an offline analysis carried out using MATLAB V.2016A (MathWorks, Massachusetts, USA). (NB: The 3D kinematic variables were obtained at the same time at which the expert assessed the FMS.) An illustration of operationalisation of the Deep Squat test is described in table 1. If a person met all of the 11 quantified criteria as operationalised in table 1, then they were awarded a score of 3; if a person could achieve all of the 11 criteria with the adjustment (heel raise), then they were awarded a score of 2; if they could not meet all of the 11 criteria even with the adjustment (heel raise), then they were awarded a 1; and if they had pain, then they received a score of 0. This process was then repeated for the remaining subtests (online supplementary appendix 1).
Illustration of operationalisation of the Deep Squat test
Prior to quantifying validity, the reference scores derived from the photogrammetric system were analysed to confirm that the FMS met the criteria for a measurement scale.24 For this the following were studied in a hierarchical order:
Did the score place participants in mutually exclusive categories?
Was there a systematic order to these categories?
Were there equal intervals to these categories?
Was there a true zero condition?
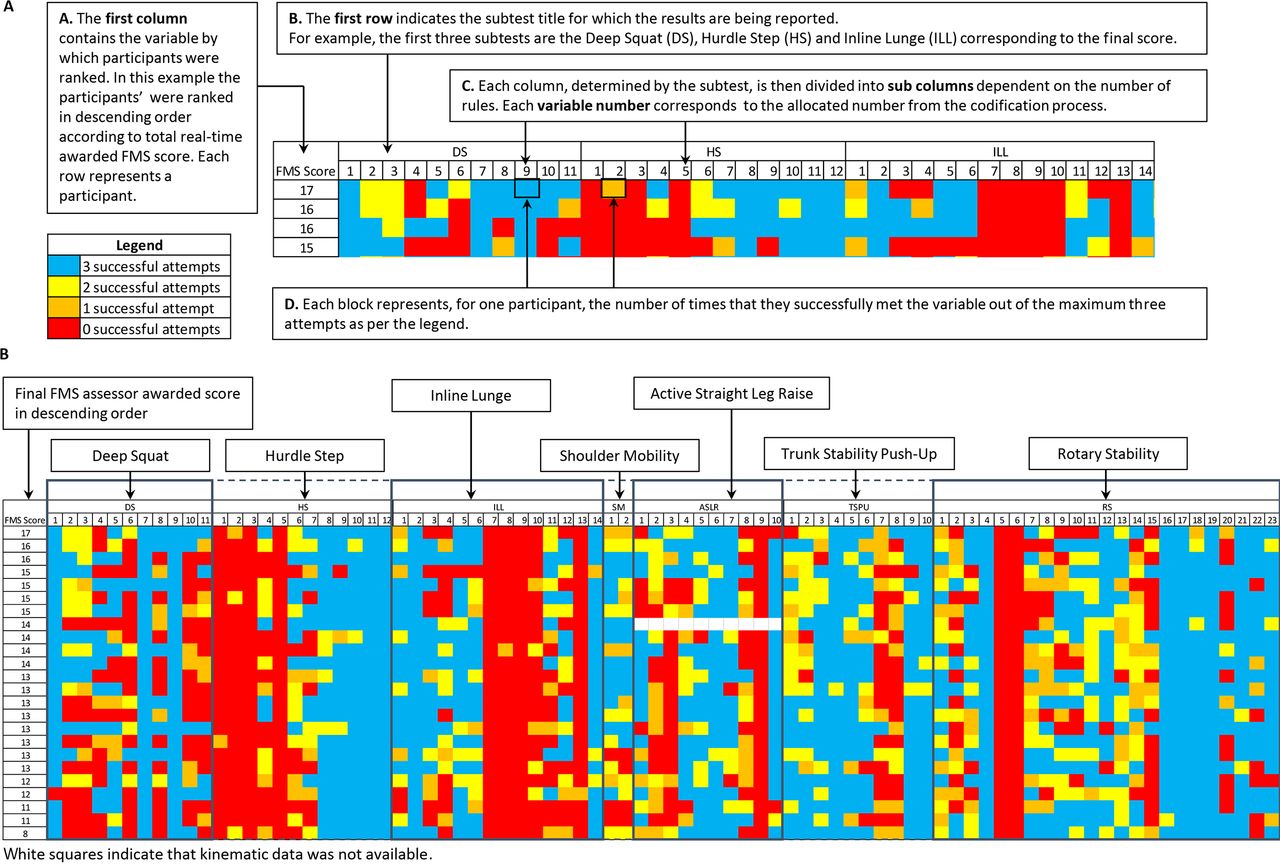
Validity was studied by computing the agreement between the scores given by the assessor and the scores obtained from the offline analysis of the 3D movement analysis data. Predictive validity for both the assessor-based and the codified scores was evaluated by 2×2 contingency tables on Excel V.2016 (Microsoft, Washington, USA) using the cut-off of 14 for identifying any serious injuries (>3 weeks’ abstention).20 The data were visually displayed as heat maps to explore the relationship between FMS score and the number and severity of injuries (figure 2, online supplementary appendix 2). For the FMS to be a measurement scale, when ranking the participants’ objective performance against another measure such as an FMS score or the number of injuries, it would be expected that a higher FMS score or fewer injuries would be reflected by a larger composition of successful attempts, for example, a larger distribution of blue and yellow boxes. Lower scores or more injuries would therefore be represented by more unsuccessful attempts, that is, a larger distribution of orange and red boxes.
Results
Twenty-four participants carried out the FMS and were scored in real time, alongside simultaneous capture of their performance with the photogrammetric system. Participants had a mean age of 19 years (range 19–22) and had been playing football for a mean duration of 12.13 years (SD ±2.1). The mean number of self-reported previous injuries during this time was 1.42 (SD ±1.2). The anthropometric characteristics of the participants were a mean standing height of 1.79 m (SD ±0.06), mean weight of 77.75 kg (SD ±9.7) and a mean skinfold thickness (sum of four sites: biceps, triceps, subscapular and anterior superior iliac spine) of 40.98 mm (SD ±17.0). Twenty-two participants reported their preferred kicking leg (dominant leg) as being their right leg, and the remaining two participants reported their dominant leg as being their left leg. There were 4 attackers, 13 mid-fielders, 4 defenders and 3 goalkeepers. Kinematic data were not available for one participant during the Active Straight-Leg Raise test and they were excluded from that subtest analysis.
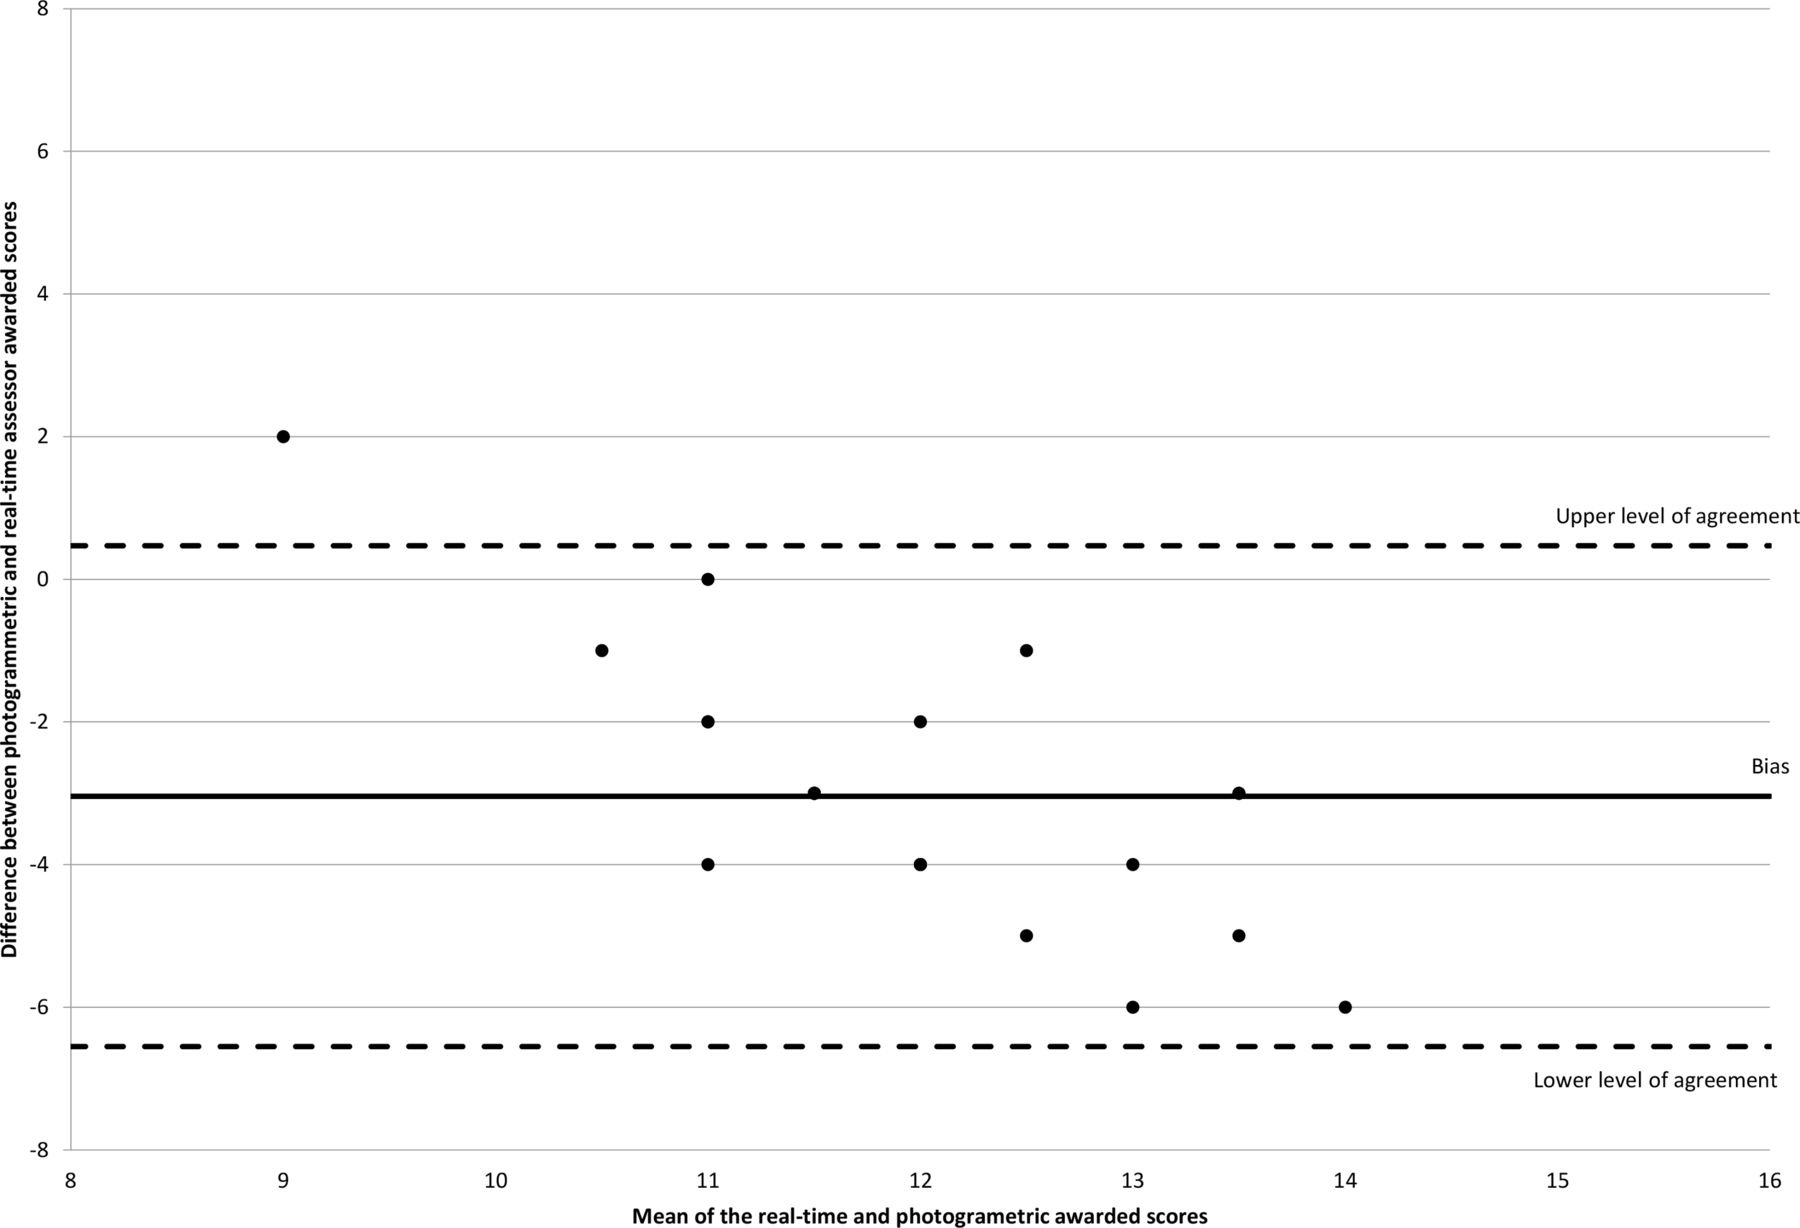
A Bland and Altman plot27 was used for comparison of the real-time assessor score against the scores generated from application of the codes to the kinematic variables recorded from the photogrammetric system outputs (figure 1). The real-time assessor score matched the photogrammetric score awarded for one of the participants, was higher than the photogrammetric system for 22 participants and was lower than the photogrammetric system in 1 participant.

Bland and Altman plot for comparison of the difference between the score based on the kinematic variables recorded from the photogrammetric system outputs and the real-time assessor-awarded score and against the mean of both scores.
For both FMS total scores determined either through real-time assessment or codification of kinematic variables, a higher number of total injuries were associated with higher total FMS scores. Additionally, neither method of score determination was able to prospectively identify players at risk of serious injury, as per table 2.
Contingency tables demonstrating total Functional Movement Screen score above or below the threshold of 14 (determined through real-time assessment (A) or codification of kinematic variables (B)) and the occurrence of serious injuries (>3 weeks’ abstention)
On review of the results, for all subtests, the FMS does not demonstrate itself as a scale in any structured order regardless of whether participants are ranked according to subscore, final score, number of injuries and injury severity, as presented in figure 2 and online supplementary appendix 2.
online supplementary appendix 2

Interpretation of results presented as heat maps and heat map results for the exercise subtests, ranked by the total Functional Movement Screen (FMS) score achieved during the real-time assessment process.
Discussion
Validity of the FMS
The results demonstrate that there is no discernible difference between the objective measures for different FMS scoring categories when comparing scores of the FMS against the objective measures of performance. Additionally, there is no consistent pattern between the objective measures for FMS scores of the same value. If each FMS value is the same, there should not be different objective patterns associated with it. The FMS therefore cannot be considered a measure as the quantified construct is not attributable to a single unit or category only but instead fulfils the attributes of multiple categories.
The codification of the FMS has highlighted the complexity of the assessment process evidenced by some subtests of the FMS, such as the Rotary Stability test, which requires the assessor to consider up to 23 criteria and rules for the assessment process. The results of our study demonstrate poor agreement between the real-time assessor-awarded scores and those awarded after application of the code to the kinematic measures. These results probably indicate that the framework of the FMS in its current state is too complex for a single assessor. Additionally, the real-time assessor-awarded scores appear to overestimate the capacity of the participant being assessed. Furthermore, score allocation error associated with the real-time assessment process may therefore stem from a number of sources: the assessors’ two-dimensional interpretation of complex 3D movement, unrealistic and undefined anatomical or biomechanical thresholds, no standardised operating procedures for the assessment processes, multiple variables required for assessment and an inadequate number of attempts to ensure accurate observations. The presence of universally met or not met rules within the FMS suggests that there may be redundancies within the FMS scoring process. Given the large numbers of variables the assessor needs to consider, the non-discriminatory variables may add unnecessary noise into an already complex scoring procedure. This complexity negatively impacts the validity of the FMS as a clinical screening tool given that it cannot be used as a measurement scale or assessment tool, demonstrated by its inability to accurately reflect the true performance of participants compared with the objective scoring system.
Performance of the FMS scale as a measure
Previous studies have identified thresholds for injury risk by using the FMS and treating the data as interval-level or ratio-level measurement.5–7 20 28 29 Therefore, to assess the level of measurement the FMS can achieve, in this study we assessed the performance characteristics of the scale according to first principle arguments and measurement-level hierarchy, starting with nominal. For a process to be called a measurement, it is necessary that people or events are assigned into mutually exclusive categories.24 The FMS scale does not fulfil this definition, given that a participant may be assigned to multiple categories within the same scale. Additionally, the FMS subscores and final scores are informed by two different scales of different units. This results in instances in which a participant is able to be assigned to multiple categories. For example, in the Shoulder Mobility exercise test (scored from 0 to 3), a participant scoring a 2 for both the left and right sides, who then has pain on the shoulder clearing test, would have a final subscore of 0. The FMS scale also assumes there are distinct mutually exclusive categories in all tests. However, ambiguity in the scoring system, deriving from poor biomechanical definitions and thresholds, results in a significant overlap between categories, which reduces the true number of scoring categories and results in an ability to assign participants to multiple categories.
As the scale was intended to allow for ranking, it is sometimes referred to as an ordinal-level measurement. However, based on our results, the FMS did not demonstrate itself as a scale in any structured order regardless of whether participants were ranked according to subscore, final score, the number of injuries or injury severity. Furthermore, given that the scale does not assign people to mutually exclusive categories or allow for ranking, it is unlikely that the lengths between scores would be equal and that the scale would have a true zero point. These therefore disqualify it from being an interval-level or ratio-level measurement. The other reported capability of the FMS is that it can be used in the assessment of muscle strength, range of motion, asymmetry, balance and kinaesthetic awareness, despite not quantifying any of these parameters in absolute units.18–20 As the FMS does not quantify a single dimension or aspect for all the aforementioned variables, it cannot be considered a measurement or assessment tool for these variables.
Predictive validity of the FMS
Previous studies have investigated performance characteristics and refuted the ability of the FMS to predict injury, despite treating it as ratio-level or interval-level measurement.2 4–7 30 These results are consistent with those observed in our study, as the FMS total score, determined either through real-time assessment or codification of kinematic variables, was unable to prospectively identify players at risk of serious injury. While a sensitivity of 100% was reported for the scores determined with the photogrammetric system, the sensitivity was 0%, and this is reflective of no participants achieving a score greater than 14. Participants who scored above the previously used threshold of 14 sustained a higher number of total and serious injuries within this study. This result contradicts the previously reported inverse relationship between higher FMS scores and serious injuries.20
A limitation of our study is the smaller sample size when compared with other studies which have investigated some performance properties of the FMS.2 6 7 The sample size within our study was reflective of a typical football squad. Within the clinical setting, use of the FMS requires clinically meaningful conclusions to be drawn from teams with sample sizes of a similar number. It has also been identified that multiple versions of the FMS scoring handbook are available; however, the underpinning components of all existing versions of the FMS framework remain the same.
For this study, it is acknowledged that the performance of the participants, used for evaluating the FMS scale, is dependent on the quantified thresholds of the FMS (online supplementary appendix 1). Therefore, the effect of incrementing thresholds on performance was evaluated. Increasing thresholds negatively affected the discriminatory ability of the rules resulting in more criteria being met; however, it did not result in reclassification of participants between scoring categories. Given these observations, it was decided that the originally selected thresholds were appropriate.
Conclusion
The FMS, as it is used in its current form, has moved beyond its original intended purpose. While the FMS is used in injury prediction, for which there is no evidence linking the occurrence of injury to the demands of the test, it is evident that bigger problems exist at the fundamental levels of the scale and scoring process. As a scale, it has been identified that the FMS can neither be considered valid or a measurement as it does not demonstrate itself as a score in any structured order. The clinical application of the FMS in any capacity, rating and ranking movement patterns or injury prediction is therefore questionable.
References
Footnotes
Contributors All authors in this study have been involved in the planning, conduct and reporting of the work described in the article. All authors have seen and approved the final draft of this article.
Funding The authors have not declared a specific grant for this research from any funding agency in the public, commercial or not-for-profit sectors.
Competing interests None declared.
Patient consent Obtained.
Ethics approval Ethical approval for this prospective observational longitudinal study and analysis of an existing database was gained from Keele University Ethical Review Panel, reference number ERP1237.
Provenance and peer review Not commissioned; externally peer reviewed.
Data sharing statement Data and methods for operationalisation of the Functional Movement Screen have been provided in the online supplementary information. Source code for operationalisation of the FMS will be available from the PhD thesis entitled ‘Validating models of injury risk prediction in football players’, which will be made available online from Keele University Library. For motion capture data (c3d) files, these may be available on request from the author.