Article Text

Abstract
Objectives To use a musculoskeletal model of the lower limb to evaluate the effect of a strength training intervention on the muscle and joint contact forces experienced by untrained women during landing.
Methods Sixteen untrained women between 18 and 28 years participated in this cohort study, split equally between intervention and control groups. The intervention group trained for 8 weeks targeting improvements in posterior leg strength. The mechanics of bilateral and unilateral drop landings from a 30 cm platform were recorded preintervention and postintervention, as was the isometric strength of the lower limb during a hip extension test. The internal muscle and joint contact forces were calculated using FreeBody, a musculoskeletal model.
Results The strength of the intervention group increased by an average of 35% (P<0.05; pre: 133±36 n, post: 180±39 n), whereas the control group showed no change (pre: 152±36 n, post: 157±46 n). There were only small changes from pre-test to post-test in the kinematics and ground reaction forces during landing that were not statistically significant. Both groups exhibited a post-test increase in gluteal muscle force during landing and a lateral to medial shift in tibiofemoral joint loading in both landings. However, the magnitude of the increase in gluteal force and lateral to medial shift was significantly greater in the intervention group.
Conclusion Strength training can promote a lateral to medial shift in tibiofemoral force (mediated by an increase in gluteal force) that is consistent with a reduction in valgus loading. This in turn could help prevent injuries that are due to abnormal knee loading such as anterior cruciate ligament ruptures, patellar dislocation and patellofemoral pain.
- ACL
- biomechanics
- female
- knee
- landing impact
This is an Open Access article distributed in accordance with the Creative Commons Attribution Non Commercial (CC BY-NC 4.0) license, which permits others to distribute, remix, adapt, build upon this work non-commercially, and license their derivative works on different terms, provided the original work is properly cited and the use is non-commercial. See: http://creativecommons.org/licenses/by-nc/4.0/
Statistics from Altmetric.com
Key messages
Strength training of the lower limb resulted in a lateral to medial shift of tibiofemoral forces during drop landing.
This appeared to be mediated by an increased force in the gluteal musculature during landing.
Musculoskeletal modelling of the lower limb can demonstrate changes in lower limb mechanics during drop landing that have not been reported using traditional methods.
Introduction
Abnormal knee joint loading has been shown to be a mechanism of injury in a range of complaints including anterior cruciate ligament (ACL) rupture, patellar dislocation and patellofemoral pain.1–4 Consequently, there has been great interest in finding ways to modify internal joint loading in order to prevent these injuries. However, the outcome measures of such studies have generally been the calculation of external kinematics and kinetics or intersegmental mechanics (ie, joint angles, intersegmental forces and moments calculated by inverse dynamics analysis, or ground reaction forces; GRF5–7). Although useful, these calculations do not indicate the actual loading experienced by the internal structures of the knee (ie, the forces experienced by muscle–tendon units, ligaments and bones). For instance, ACL injury prevention programmes have been shown to successfully modify kinematic outcomes towards movement strategies of lower risk,7 8 and there is epidemiological evidence that such interventions effectively reduce the ACL injury rate9–11; however, the effect of such programmes on the actual internal joint loading is largely unknown.
Muscle strength and activation are variables that can be directly changed by training programmes12 and can provide protection against injury in activities like landing from a jump. For instance, previous ACL injury research has described the importance of gluteal and hamstring strength13 14 and increased hamstring activation pre-landing and post-landing15 in reducing injury. Similarly, gluteal activation and strength have been related to a reduction of knee valgus,16 patellofemoral pain17 18 and patellar dislocation19 in various activities. Despite these positive associations, however, the literature relating to the effect of strength training alone on kinematics and GRF during movement is equivocal20 21 and the effect on internal knee joint forces is again unknown. To this end, this study employed a posterior lower limb-focused training intervention, which would be expected to increase the strength of the gluteal and hamstring musculature.
One technique that can be used to estimate internal forces is musculoskeletal modelling, and musculoskeletal modellers envisage a future where their work can inform clinical practice.22 23 For instance, there have been a number of studies that have sought to quantify the forces present in the knee during landing.24–29 However, no study has used musculoskeletal modelling technology to assess the effect of a posterior thigh musculature-focused training intervention on the forces experienced by the internal structures of the knee. The objective of this study was therefore to evaluate the effects of a leg strength training intervention on internal knee forces during landing (tibiofemoral joint reaction forces; TF) using a publicly available musculoskeletal model of the lower limb.30 We hypothesised that the intervention would result in a lateral to medial shift in TF that is consistent with the changes in landing mechanics that have previously been seen after strength training.21 31
Methods
Experimental approach
This study was divided into three phases undertaken at St Mary’s University. First, during the pre-test, the performance of the participants in a landing task was assessed alongside a measure of their posterior lower limb strength. Next, the experimental group took part in an 8-week training intervention designed to increase their posterior lower limb strength whereas the control group kept up with their usual recreational activities. Finally, all participants were retested using the same protocol as in the pre-test. The experimenters were not blinded as to the participant groups.
Participants
Sixteen young, healthy students participated in this study (table 1) and were assigned to either the control group (CG) or intervention group (IG) based on their availability to take part in the intervention training programme. The recruitment criteria stipulated that the participants were women, between 18 and 28 years of age, free from musculoskeletal injuries over the preceding 6 months, right foot dominant and only took part in recreational physical activity (ie, no heavy resistance or injury prevention training for at least 6 months prior to the study, and that they participated in mainly leisure sports at most four times per week). All participants provided informed written consent prior to the experiment, and the ethics subcommittee of St Mary’s University approved the study.
Participant characteristics (mean±SD)
Instrumentation
Evaluation of drop-landing performance
The kinematics describing the time history of the position of 18 reflective markers (14 mm) placed on key anatomical landmarks of the right leg and pelvis30 according to the guidelines of Van Sint Jan32 33 was obtained using a Vicon 3D motion analysis system (Vicon MX System; Vicon Motion Systems, UK) incorporating 11 cameras. The GRFs during landing were measured with a force plate (Kistler 9287BA Plate; Kistler Instruments, UK) synchronised with the Vicon system. All data were collected at 200 Hz.
Lower limb strength testing
The strength of the posterior aspect of the lower limb was tested in a closed kinetic chain task as described below using the same Kistler force plate as for the evaluation of the drop landings.
Procedures
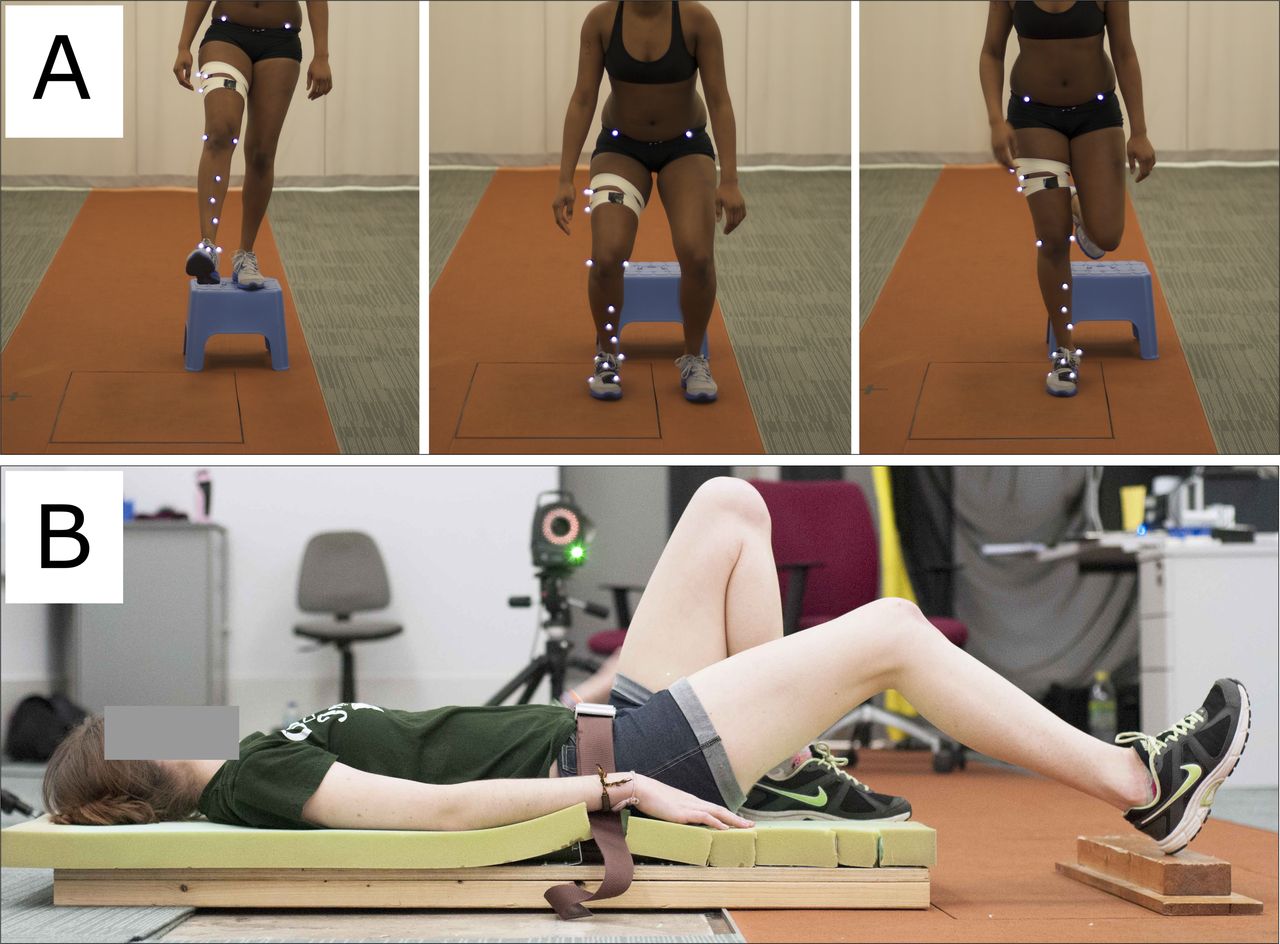
After performing a 10 min supervised, dynamic warm-up including running, high knees, buttock kicks, lunges, squats, straight leg walks and hop and stick, the participants practised the drop landings for up to five attempts both bilaterally and unilaterally. A 3 to 5 min rest followed, in which the reflective markers were placed on the anatomical landmarks with double-sided adhesive tape. Drop-landing data were collected during controlled falls from a 30 cm platform placed 0.5 cm in front of the force plate. Participants first completed five bilateral landings (BLs) and then five unilateral landings (ULs) having been instructed to step forward from the platform with their dominant right foot (and not to jump forwards or step down), land naturally with only their dominant foot touching the force plate and stay in this landing position for at least 2 s. During BLs, the participants were asked to land with both feet at the same time (figure 1A—note the position of the feet with just the dominant foot on the force plate). Incorrect landings contrary to the description above were repeated. The rest periods between the five drop landings for each condition were at least 60 s long, and at least 2 min rest was taken between the BLs and ULs.

Experimental arrangements: (A) bilateral and unilateral drop landing tasks; (B) assessment of posterior thigh strength using a hip extension test.
After a 3 to 5 min rest period, the strength of the right posterior thigh was assessed in a hip extension test. The hip was positioned at a flexion angle of 30° (note in this article we use the convention that when the subject is stood in the anatomical position, their ankle, knee and hip joint angles are 0°, and that flexion of the joint is represented by a positive angle). The ankle was positioned neutrally (ie, at a flexion angle of 0°) with the heel at the centre of a wooden block that was on top of the force plate (figure 1B). The participants were then encouraged to push the heel downwards with maximum force for a period of at least 6 s and the peak force was recorded. A 2 min rest period was taken between the three trials. This hip extension test was chosen as it has previously been shown to be reliable34 and tests the strength of the limb in a closed kinetic chain task at similar joint angles to those found at initial contact during BL in women.35 36
Exercise intervention
Eight participants performed an 8-week posterior leg strength programme (table 2), attending 3 hourly sessions per week that were supervised by a UK Strength and Conditioning Association qualified coach. Loading was progressed weekly by increasing the load lifted based on individual responses to training (strength, experience and motivation), but sets, reps, rest and perceived exertion were similar within the group.
Strength training programme followed by participants in the intervention group
Data analysis
Musculoskeletal model
In order to compare predicted muscle and joint reaction forces preintervention and postintervention, the data collected were analysed using a publicly available musculoskeletal model of the lower limb30 37–40 (FreeBody; www.msksoftware.org.uk). The validation and verification of FreeBody has been described previously,41–44 with a focus on the accuracy of the TF predictions41 and the sensitivity of the model to the input kinematic data and its muscle force upper bounds.43
FreeBody represents the lower limb as a linked chain of five rigid segments. The position and orientation of the pelvis, thigh, calf and foot segments at each moment in time are determined from the marker data (the position of each segment has 3 df and its orientation has a further 3 df). The position and orientation of the patella segment is determined based on the knee flexion angle,30 using relationships developed from previous literature.45 46 The anthropometry of each segment is determined from the work of de Leva.47 Given the time history of the position and orientation of each segment and its anthropometry, the kinematics of each segment is calculated using the method of Dumas and colleagues.48 Next, the data of Klein Horsman and colleagues49 are used to determine the origins, insertions and lines of actions of 163 muscle elements and 14 ligaments.
Following the above steps, the equations of motion governing the movement of the segments can be determined (online supplementary equation 1). However, there are more unknown forces (193) than there are in the online supplementary equation 2, and thus this is an indeterminate problem with many possible solutions. The next step is therefore to pick the most physiologically likely solution. First, the potential solution set is narrowed by imposing physiologically based constraints then the most physiologically likely solution is determined by using an optimisation procedure developed37 from the work of Crowninshield and Brand50 and Raikova51 that is implemented using MATLAB (R2013a; Mathworks, Natick, MA, USA). The optimisation is predicated on finding the solution that minimises a cost function based on maximising muscular endurance (online supplementary equation 2).
Supplementary file 1
Data processing
For each subject, each landing (BL, UL) and both pre-tests and post-tests, the trial that resulted in the lowest peak GRF was selected for analysis (as this was taken to be the most successful landing). A fourth-order dual low-pass Butterworth filter with a cut-off frequency of 6 Hz was used to filter the kinematic and kinetic data. The filtered data were then processed through FreeBody. The strength capabilities of FreeBody (as represented by the maximum force that each muscle and ligament was permitted to experience) were scaled to reflect the participants’ strength testing results. Following the example of our previous work, if the optimisation routine employed by FreeBody (fmincon routine in MATLAB) could not find a feasible solution for a particular frame, then we raised the strength upper bound for the frame until a solution could be found. This was only necessary for a limited number of frames.

Strength testing results (error bars indicate the SD). †indicates a significant difference between the pre-test and post-test scores of the intervention group (P=0.001).
Statistical analysis
Statistical analysis was performed using IBM SPSS Statistics (V.22; International Business Machines, Armonk, NY, USA) and MATLAB (R2013a; Mathworks). ANOVA was used to check for differences in age or anthropometry between the groups at pre-test. An ANCOVA was used to evaluate the change in strength of the right posterior thigh musculature where baseline strength was included as a covariate. The alpha level was set at P<0.05 a priori and normality was confirmed by Shapiro-Wilk tests.
The output data from the musculoskeletal model were first normalised with regards to time. A cubic spline was then fitted to each data series and used to interpolate the normalised curves to obtain values at regular intervals. The mean and the 95% CI at each time point was then calculated for each data series. A significant difference between curves was determined when there was no overlap between the CIs.
Results
During the intervention, the strength of the IG increased by 35% (figure 2; P=0.001; pre: 133±36 n, post: 180±39 n). There was no change in the strength of the CG (pre: 152±36 n, post: 157±46 n). The participants attended 94% of the planned sessions.
Both CG and IG exhibited an increased use of the gluteal musculature from pre-test to post-test (figure 3). However, the magnitude of the increase was greater for the IG in both BLs and ULs, and there was also little overlap of CIs (whereas for the CG it was considerable). There were no other strong trends in terms of changes in muscle forces from pre-test to post-test (online supplementary material).
Supplementary file 2

Force in the gluteal musculature during bilateral and unilateral landings. The vertical error bars represent the 95% CI for the pre-test, whereas the light dotted lines represent the 95% CI for the post-test. BW, body weight.
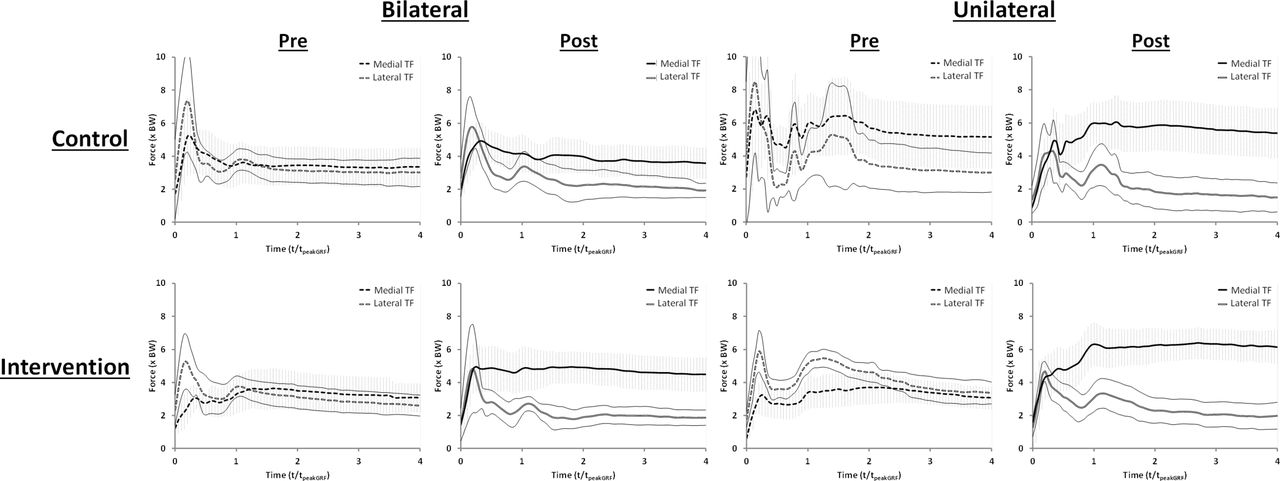
During the pre-test, the peak lateral tibiofemoral joint contact force (lateral TF) was greater than the peak medial tibiofemoral joint contact force (medial TF) for all groups (figure 4). For the CG, the lateral TF then dropped below the medial TF after the first local peak in GRF during both landings. For the IG BL, the lateral TF dropped below the medial TF after the second local peak in GRF, whereas for the IG UL, the lateral TF was greater than the medial TF throughout the analysed time period. During the post-test, the lateral TF fell relative to the medial TF for all groups; however, the magnitude of this change was greater for the IG than the CG, and greater for the UL than the BL. For the IG, the lateral TF was equal to or lower than the medial TF throughout the time period for both landings.
Lateral and medial tibiofemoral joint reaction forces (TF) during bilateral and unilateral landings. The vertical error bars represent the 95% CI for the medial tibiofemoral force, whereas the light dotted lines represent the 95% CI for the lateral tibiofemoral force.
There were only minor differences between the preintervention and postintervention GRFs for both landing styles and groups (online supplementary material). There was a trend towards slightly higher peak GRFs postintervention during the BLs for both groups (approximately 0.3–0.4× body weight; BW). In addition, the GRF for the CG UL was marginally lower during the post-test (around 0.2–0.3× BW for most of the time during the landing period). This study was largely unable to demonstrate changes in kinematics between the pre-test and post-test, although both groups showed a trend towards lower hip and knee flexion during BL (online supplementary material).
Discussion
This study supports the hypothesis that TF patterns would be altered following a strength intervention and that these changes would be consistent with the kinetic and kinematic changes that have been previously found to occur after strength training. In particular, we found changes in gluteal muscle forces and a lateral to medial shift in TF. In contrast, there were only small changes in GRF and the kinematics of landing.
Lateral to medial shift in tibiofemoral joint loading
The most novel result in this study is the change in the pattern of TF after the intervention. Both groups experienced a reduced lateral TF during the post-test; however, the decrease was greater in the IG than in the CG. In addition, the IG experienced an increase in the medial TF at post-test, whereas the medial TF remained similar for the CG. Taken together, these data indicate a lateral to medial shift in knee loading, which was of significantly greater magnitude in the IG. Such a shift is consistent with a reduction in knee valgus, although we were unable to detect differences in kinematics. Both groups also experienced an increase in gluteal force postintervention, and it has been suggested that increased gluteal force can reduce valgus loading of the knee. The changes in both groups may be explained by a learning effect of the tasks in the post-test; however, the fact that the IG experienced greater changes in gluteal force and lateral to medial shift suggests that there was an effect of the intervention. The results of the present work tend to support the link between gluteal force and the medial/lateral loading distribution of the tibiofemoral joint. In addition, these results suggest that strength training can facilitate women in using the gluteal musculature during landing in a way that possibly exhibits a lower risk of knee joint injuries such as ACL rupture, patellar dislocation and patellofemoral pain.
The fact that a lateral to medial shift in knee loading was found when there was an increased gluteal force (in both groups) is remarkably consistent with contemporary thinking. For instance, studies have identified relationships between increased hip strength/activation and improved neuromuscular alignment and control of the legs17 and increased gluteus medius activation and decreased TF.52 These studies in combination with our results suggest that a stronger posterior hip musculature can result in greater gluteal force expression, altered lateral to medial TF distribution and potentially affect valgus loading.
Effect of strength training on landing kinematics and GRF
There were only small differences in landing kinematics preintervention to postintervention in both groups (frontal, sagittal and transverse plane), which is similar to another study that could not demonstrate knee valgus/varus and knee/hip extension/flexion changes following a strength training programme.20 In contrast, one other study did show kinematic alterations of increased hip flexion at initial contact, and peak hip and knee flexion after a basic strength training programme21 (it should be noted that the programme employed in that study also included flexibility and balance training). The majority of prevention studies that found consistent alterations in kinematics included neuromuscular and feedback training, which were not employed in our study.7 53 54 The lack of kinematic differences in this study, despite the changes of internal kinetics, are important and suggest that either strength training in isolation does not affect kinematics, that kinematics are less sensitive to strength changes than internal kinetics or that musculoskeletal models of the type employed here are more sensitive to changes in internal kinetics than kinematics.
As described above, the inability of this study to demonstrate statistically significant differences in knee varus/valgus is consistent with previous studies that have looked at the effect of strength training.20 21 One reason for this may be the fact that optical motion capture methodologies are less able to discriminate between differences in internal/external rotation and abduction/adduction than between differences in joint flexion and extension due to the measurement error associated with soft-tissue artefact.55 In contrast, we have previously shown that the forces predicted by the model employed here are sensitive to small changes in kinematics (in particular, that they are sensitive to small changes in the internal/external rotation of the tibia43). It is thus entirely credible to suggest that musculoskeletal models may be more sensitive to changes in internal kinetics than more traditional approaches are to changes in kinematics. This may have important consequences for future assessment methods, particularly if ACL and knee injury risks are only assessed through a consideration of kinematic factors, in particular suggesting that clinical assessment methods should also incorporate the prediction of internal joint kinetics. The greater sensitivity could be used as an early indicator to prevent knee injuries and may detect smaller changes following intervention programmes. Consequently, this new perspective on joint conditions may offer greater detail in clinical diagnoses.
We were also unable to identify changes in GRF patterns preintervention and postintervention—this is in agreement with results of other studies that studied limb strengthening interventions,20 21 although contrary to a study that also focused on posterior thigh musculature.56 Our findings suggest that either the change in force distribution between the joints altered due to internal modifications as GRF patterns stayed relatively constant or that the internal forces are particularly sensitive to small changes in GRF. Studies that found changes in GRF mostly included feedback or plyometric training, which probably included landing feedback training.53 54 57 This might suggest the necessity to incorporate direct feedback of landing technique if substantive changes in ground force application are a goal for the patient or athlete.
Role of musculoskeletal modelling in clinical research
As far as we are aware, this is the first study that has used musculoskeletal modelling technology to assess the results of an exercise intervention. The unique finding of this study is the change in lateral to medial loading of the tibiofemoral joint following strength training. This is an observation that is previously unreported, probably due to the fact that other similar studies have relied on kinematic measurements. Similarly, we have recently successfully employed the same musculoskeletal model as in this study to report the effects of an acute intervention on muscular forces during explosive activity.58 Taken together, these studies therefore demonstrate the unique sensitivity and potential for musculoskeletal models to improve the understanding of problems with clinical relevance. However, to date, we have only used this model to study differences at the cohort level. The employed model incorporates limited subject-specific detail and thus is currently unable to be used at a subject-specific level. Future work should establish the detail that is necessary to produce such specified results.
Conclusions
In summary, this study demonstrates that a training intervention with a focus on posterior thigh strength resulted in a greater estimated use of the gluteal musculature during drop landings. This was commensurate with an altered pattern of joint loading; in particular, there was a change in force distribution at the tibiofemoral joint with a shift from lateral TF to medial TF, a change that is consistent with a reduced valgus and an increased hip joint loading. Potentially, this could reduce abnormal knee loading injuries that are related to valgus/varus forces such as ligament injuries (ie, ACL), kneecap dislocation, menisci and cartilage damage. To our knowledge, this is the first time a change in the medial/lateral loading of the knee has been observed following a period of strength training. It is noteworthy that the changes in the internal force loading of the lower limbs were found despite there being only small concurrent changes in GRF and kinematics. This suggests that the joint loading may be more sensitive to changes in strength than kinematic measures, and that clinicians should be mindful when relying solely on kinematic measures.
References
Footnotes
Contributors MBC, JEG and DJC conceived of and designed the study. JEG and AMJB created and validated the strength test used in the study. DJC and AMJB created and tested the musculoskeletal model used in the study. MBC collected the data and supervised the intervention. MBC and DJC analysed the data and wrote the first draft of the paper. All authors were involved in the interpretation of the data, in redrafting the manuscript and in approving the final version.
Competing interests None declared.
Ethics approval Ethical approval for this study was gained from St Mary’s University Ethics Committee.
Provenance and peer review Not commissioned; externally peer reviewed.
Data sharing statement No unpublished additional data are available from this study.