Article Text

Abstract
Background The aim of this study was to determine whether toe sliding is more likely to cause knee injuries than flatfoot sliding in curling.
Methods Twelve curlers participated in the study, each delivering 12 stones. Six stones per volunteer were delivered using a flatfoot slide and six were delivered using a toe slide. The Pedar-X in-shoe pressure system recorded the plantar pressure during each of the slides, while a sagittal plane digital video recorded the body position of the curler. Measurements were taken from the video recordings using a software overlay program (MB Ruler), and this, combined with the Pedar-X data, gave the overall joint force in the tuck knee.
Results The knee joint force for toe sliding was more than double that of flatfoot sliding (p<0.05). There was a strong correlation between the increase in knee joint force and the increase in the moment arm of the ground reaction force. Images produced using the three-dimensional Vicon system confirm that toe sliding produces a larger moment arm than flatfoot sliding.
Conclusion Injuries are more likely to occur in toe sliding, compared with flatfoot sliding, due to the increase in force and moment, pushing the weight of the curler forward over the knee, which could make the adopted position less stable. Curlers might consider avoiding toe sliding to reduce the risk of knee injuries if the two types of delivery could be performed equally well.
- curling
- biomechanics
- knee injuries
- toe sliding
- flatfoot sliding
This is an Open Access article distributed in accordance with the Creative Commons Attribution Non Commercial (CC BY-NC 4.0) license, which permits others to distribute, remix, adapt, build upon this work non-commercially, and license their derivative works on different terms, provided the original work is properly cited and the use is non-commercial. See: http://creativecommons.org/licenses/by-nc/4.0/
Statistics from Altmetric.com
What are the new findings?
Toe sliding causes higher joint forces in the tuck knee than flatfoot sliding.
The greater the extent of the toe slide, the greater the knee joint force.
Increased moment arm in the toe slide makes the curler's position less stable and so more prone to injury.
Introduction
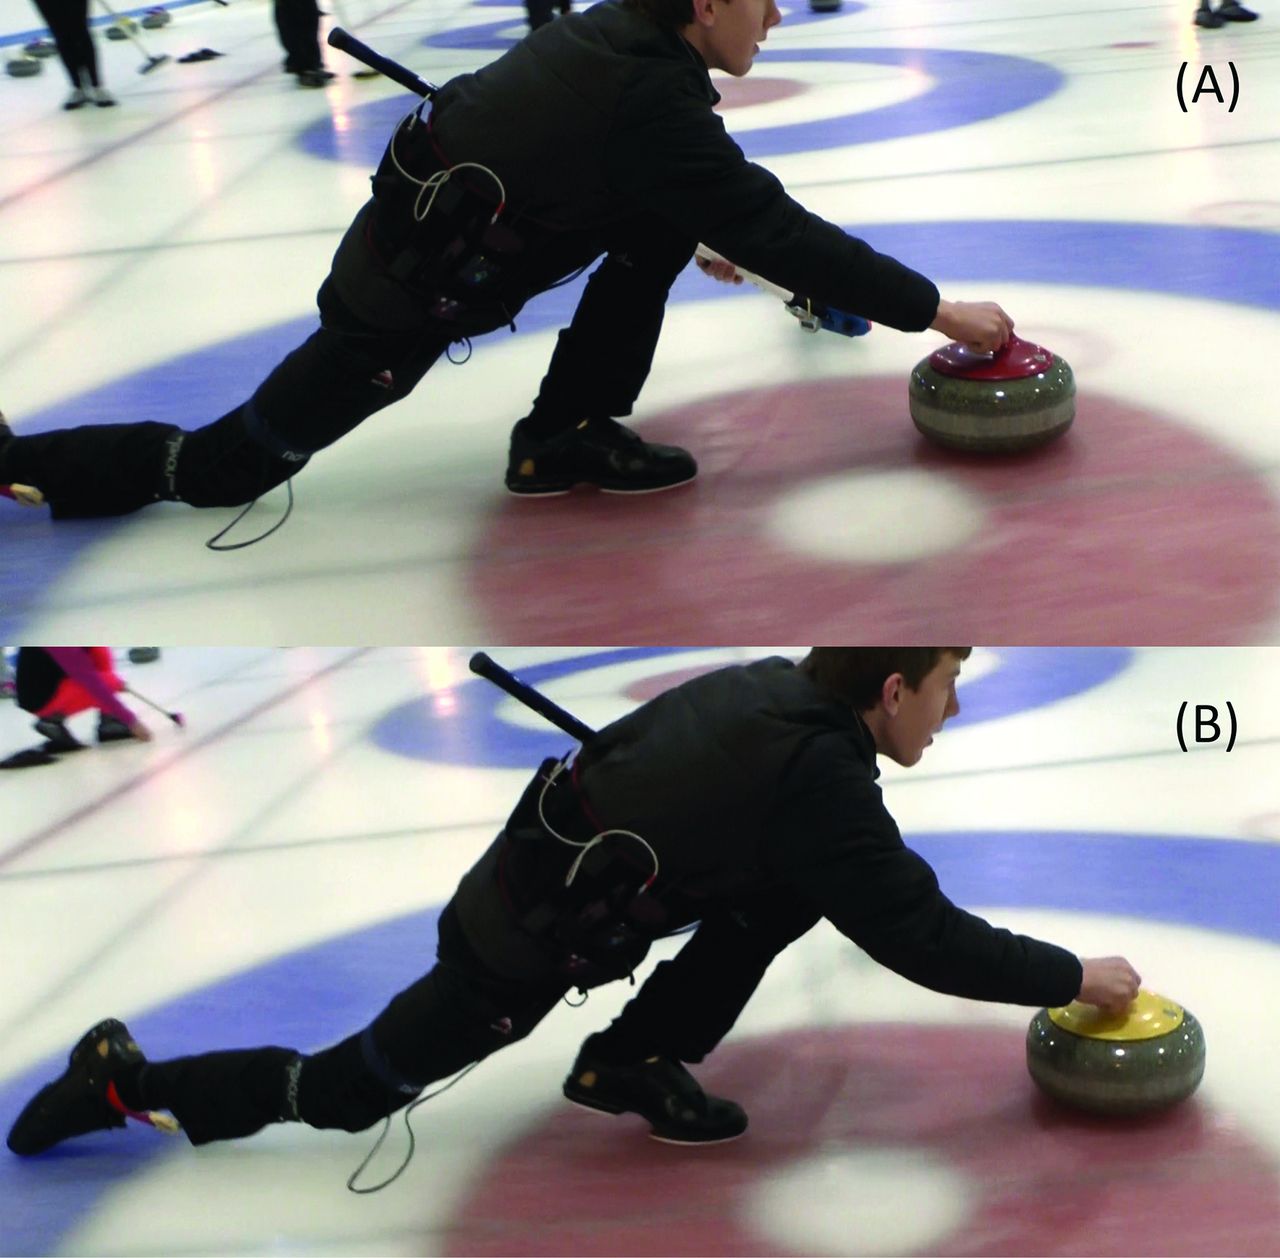
The aim of this study was to analyse the joint forces about the tuck knee during curling, in flatfoot and toe slide stone deliveries (figure 1A,B), and to assess whether one is more likely to subject the curler to injury than the other.

Position of the curler during (A) flatfoot delivery and (B) toe slide delivery.
Curling is a sport played on ice between two teams of four players. To deliver a stone, players gain momentum by pulling the stone back while lifting their hips, followed by a drive forward from the foot on the hack (a foothold on the ice). The delivery position, involving significant hip and knee flexion, is sustained for a short period after the curler releases their stone, creating potential for injury to the player.
Only three papers have been published regarding the epidemiology of curling-related injuries. A retrospective study carried out in the USA analysed injury patterns among competitive curlers, showing that over 54% of injuries were to the knee.1 Berry et al.2 surveyed participants at the 2008 World Men's Curling Championships and reported five musculoskeletal injuries, all of which were pain on curling-related movements, were sustained throughout the championships.
The third paper claimed to find results similar to those reported by Berry et al.2 Beere et al.3 reported 216 injuries over a 10-year period in high-performance curlers. They declared that most injuries occurred in the back; however, this turns out to be only 39 of 216 injures (18%), very closely followed by injuries to the knee at 33 of 216 (15%). Furthermore, their study failed to account for the nature of 63 injuries, the total value of injuries to the back increases from 39 to 56 without any explanation, and they misquote the findings from Reeser and Berg.1 Altogether, this questions the reliability of their study and its reported findings.
Yoo et al.4 used kinematics to investigate the differences in the delivery between elite and subelite curlers. Using body markers, Pedar in-shoe system and video cameras, they analysed the centre of mass, plantar pressure and joint angles of players among other variables. Their results showed that elite players have a greater ability to control their centre of mass and balance while delivering a stone. However, there was no evidence to demonstrate that this has any effect on injury rate.
The cause of knee injuries is still unknown, but is likely to be due to the physically demanding aspects of the sport: sweeping and/or stone delivery. Several papers have been published on the topic of sweeping,5 but only one on the biomechanics of curling stone delivery.4 Therefore, the present study undertook to study the biomechanics of two types of curling deliveries, flatfoot slide and toe slide.
Yoo et al.4 demonstrated a successful use of kinematics on the ice, especially in relation to the equipment used. Ramanathan et al.6 assessed the reliability and repeatability of Pedar-X, validating it as an accurate method of measuring in-shoe plantar pressure and contact area. These properties of Pedar system and its successful use in Yoo et al.4 guided its use in this present study.
Methods
This research was carried out between November 2015 and April 2016. Ethical approval was granted by the University of Dundee Ethics Committee. Data were collected at Dundee Ice Arena and The Peak, Stirling Sports Village, and analysis was conducted at the Institute of Motion Analysis and Research (IMAR), University of Dundee.
Participants
Twelve curlers volunteered to participate in the study. Nine were amateur curlers: five men and four women. The remaining three curlers were professional male curlers. Inclusion criteria were that curlers:
must have curled for more than five seasons
have been currently active in the sport
have been able to deliver stones in flatfooted and toe slide deliveries
had no current injuries.
These criteria were selected to ensure curlers with a balanced and stable curling delivery were recruited to participate in the study, to reflect as accurately as possible real match play. For this reason, curlers wore their own curling shoes and used their own brush. They were provided via email the relevant information and consent documents. Dundee Ice Arena and The Peak both have sheets of curling ice and stones, regulated by the World Curling Federation.7 The ice was prepared by staff at the ice arenas to meet the curling standards before any data collection began.
Experimental set-up
The Pedar-X in-shoe pressure system was used to measure the plantar pressure while the curlers delivered their stones. The relevant size of pressure insole was selected to fit inside volunteers’ curling shoes. The insoles were connected via a cable to the main operating pack, which was worn on a belt around the volunteer's waist.
Before data collection began, the distance from the participant's centre of rotation of their knee to the centre of rotation of their ankle (lower leg length) was measured according to Vicon marker placement guidelines. Height and mass of participants were also measured and recorded. This was carried out with the volunteer wearing exactly what they would wear on the ice (including the equipment belt), and holding their curling brush as its mass also contributes to the overall mass of the sliding curler.
Data collection
Before data collection began curlers formally agreed to participate, understood they could withdraw from the study at any time without giving reason and were given the opportunity to practise delivering stones while wearing the Pedar-X system. Once data collection began, participants delivered 12 stones: six flatfoot sliding and six when toe sliding. The stones were delivered in a randomised order to minimise bias in the results. A digital video of the volunteer was taken from the sagittal plane as each stone was delivered.
Data analysis
Data from six trials for each type of slide were taken from each participant, giving 12 sets of data per curler. Three trials per slide per participant were randomly selected to be further analysed. The joint force at the tuck (left) knee was then calculated from the data. Knee joint force is a combination of quadriceps muscle force, gastrocnemius muscle force and body weight. Each value was calculated separately before being combined to give the knee joint force.
The quadriceps muscle force (Qf) was calculated using the moments around the knee (Mk) (figure 2). As the knee is static, all clockwise and anticlockwise moments must balance. Therefore, Qf multiplied by the patellar tendon lever arm distance (Pl) is equal to the force recorded from the Pedar-X software at the left foot (R1) multiplied by m, the distance between R1 and the centre of rotation of the knee, thus giving the equation: Qf × Pl=R1 × m.
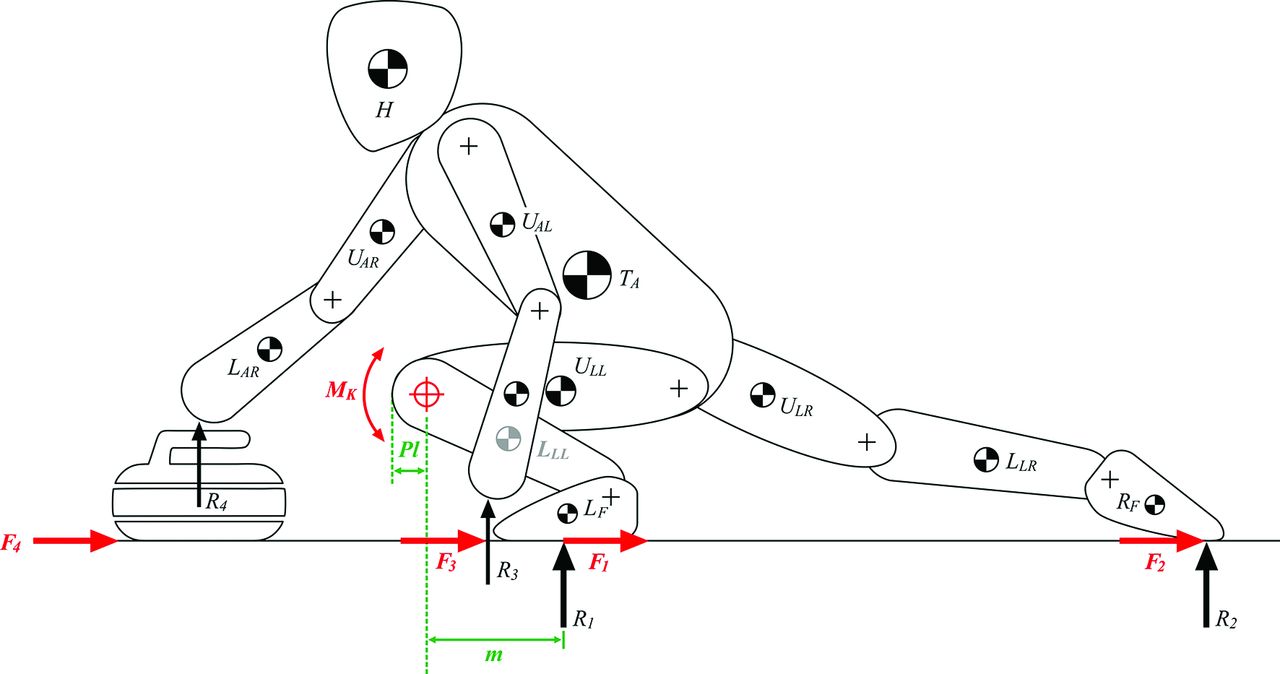
Link segment diagram depicting the moment around the knee.
It was assumed that the effect of friction was negligible as the surface being played on was ice and has a very low coefficient of friction.8 The appropriate value for Pl was assigned to the trial given the angle of flexion of the knee.9 m, the moment arm for R1, was calculated using a combination of Pedar-X data and measurements taken from the sagittal plane video. An overlay software, MB Ruler, was applied to the video to allow measurements to be made between any two points. These measurements were recorded in pixels, then converted into metres using the known distance between the centres of rotation of the knee and the ankle, respectively.
With a known value for Pl, R1 and m, the equation was rearranged to give a value for Qf:
Qf = (R1 × m)/Pl
Gastrocnemius muscle force was calculated using the same principles as quadriceps muscle force, using the moment around the ankle.
The final force taken into account was body weight. It was assumed that all body weight was being placed through the foot, and mass through the curler's brush, stone or trailing foot was negligible. Body weight being placed through the knee was therefore the mass of the volunteer minus the mass of their distal lower limb (from the knee down), multiplied by gravity (9.81 ms−2). The average mass of the distal lower limb is 6.18% of the total male body mass and 6.68% of the total female body mass.10
Combining these three forces gave a value for the joint force at the knee. The quadriceps force acts as a pulley as it inserts at the patella tendon. This created a vector diagram (figure 3A), with the appropriate angles being measured from the sagittal plane video recording. As the body was not accelerating, when rearranged the vector diagram created a closed polygon (figure 3B) when the resultant vector (the knee joint force) was added in. The size and angle of this vector can be calculated using trigonometry.
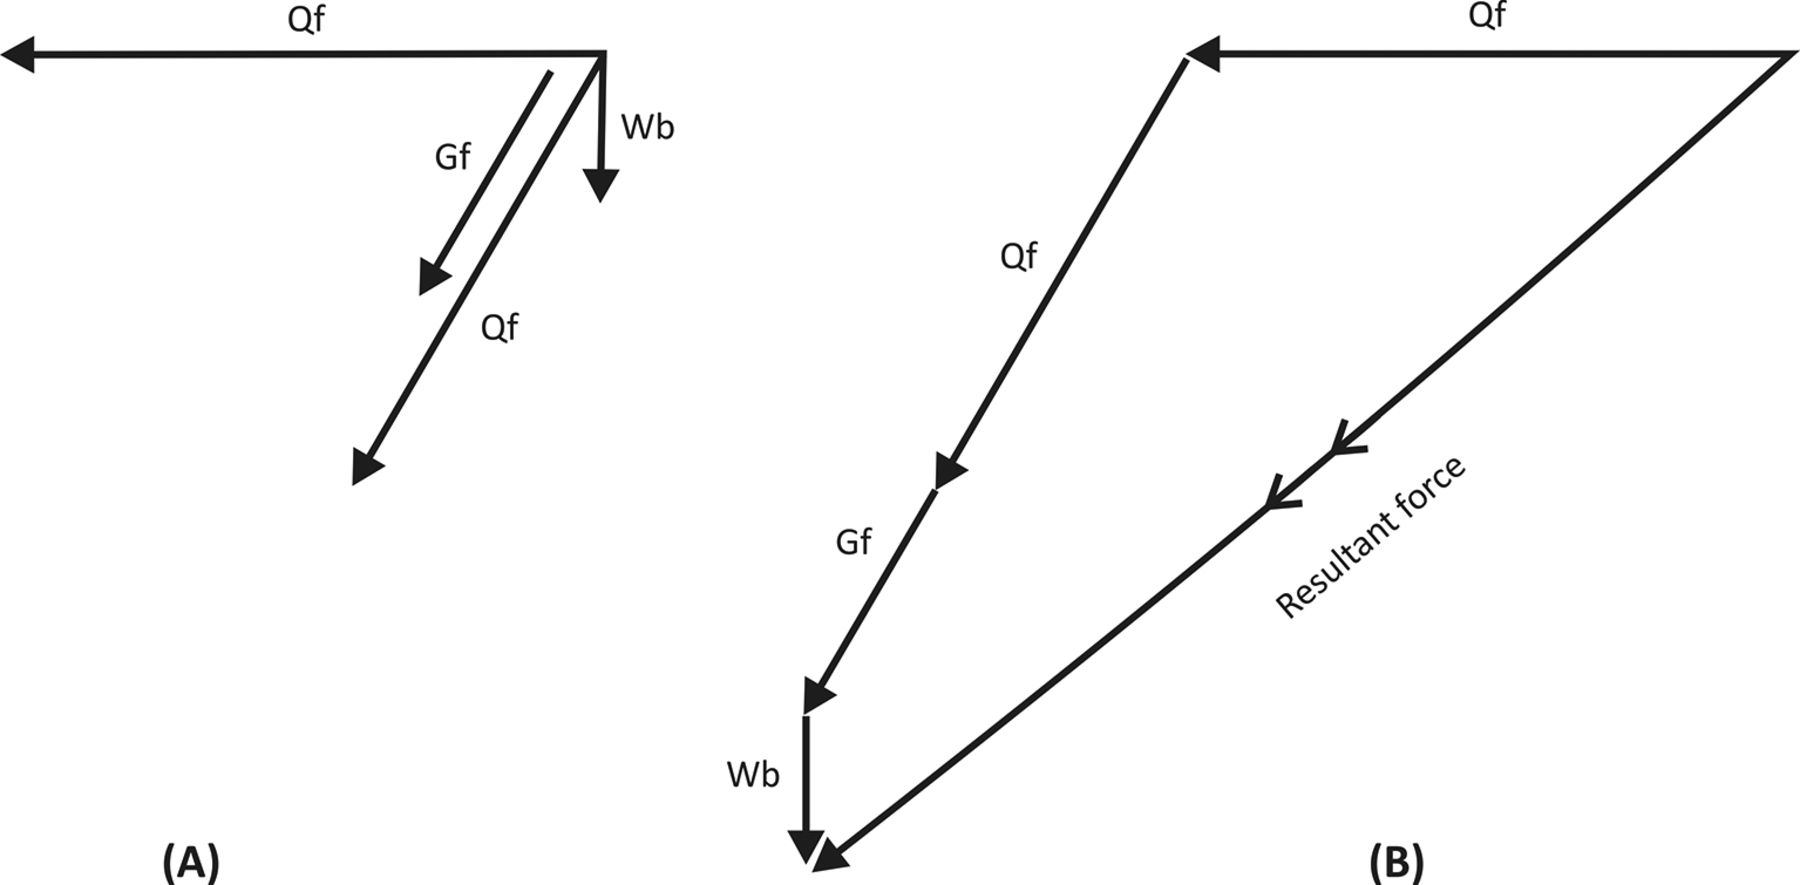
(A) Force vectors acting on the knee (B) vectors resolved to show resultant force.
Statistical analysis
The statistical analysis was carried out using SPSS V.22. The skewness coefficient was used to confirm that data were in normal distribution. The general linear model statistical analysis was used to analyse repeated measurements data and the Pearson correlation coefficient was used to analyse correlations between the data. The significance level, p, was set at less than 0.05.
Results
Twelve curlers volunteered to participate in the study; however, due to a different sliding technique of one participant, the participant data were removed from the study before analysis began. The remaining 11 participants were aged between 17 and 37 years old (mean: 23.36, SD 6.05), with a mean height of 1.76 metres (SD 0.08) and a mean mass of 76.37 kg (SD 11.67).
Calculated values for knee joint forces for the six trials from each participant, three flatfooted slides and three toe slides, were normalised by weight for each participant, and expressed as number of times body weight (BW) (i.e. 100 divided by participant's body mass; for example, for a result of 100 in a person that weighs 60 kg, it would be a joint force of 1.67 times body weight). Figure 4A shows the mean of value for each trial and the overall mean value between the three trials of the same slide. The highest individual joint force value calculated was 38.85 BW, while the lowest was 1.92 BW (mean: 12.25, SD 7.32).

Joint force versus (A) slide position and (B) moment arm length.
General linear model statistical analysis was carried out on the full set of normalised data, comparing the values from each of the number of trials with the other five (table 1).
Statistical significance between each flatfooted and toe slide trial
m was plotted against normalised joint force (figure 4B). Pearson coefficient was calculated to be 0.94, while the p value was statistically significant at <0.01.
The angle of knee flexion of the tuck knee during stone delivery was plotted against the normalised joint force. The Pearson coefficient was calculated to be 0.82, while the p value was significant at <0.01. Likewise, the angle of knee flexion of the tuck knee during stone delivery was plotted against the moment arm length. The Pearson coefficient was calculated to be 0.88, while the p value was statistically significant at <0.05.
Discussion
Speculation within the curling community suggests that toe sliding causes more knee injuries than flatfoot sliding (Jones, personal communication, 2015). Analysis of the results offers two reasons to suggest why toe sliding may cause more knee injuries than flatfoot sliding: an increased knee joint force and the increased moment arm of the ground reaction force (GRF).
Knee joint force
Increased joint forces increase the likelihood of musculoskeletal injury.11 The data in table 1 portray an increase in knee joint forces in toe slides (mean: 16.42, SD 7.59) compared with flatfoot slides (mean: 8.64, SD 3.60). This puts curlers who toe slide at an increased risk of knee injury compared with curlers who flatfoot slide. This result can be seen in table 1, where significant differences in knee joint forces exist in every compared grouping, that is, comparing flatfoot slides against toe slides (p<0.05 in all cases).
In addition to a difference in the values for knee joint force, the reported SD for the normalised knee joint force values for toe sliding was 7.59 N, more than double than that of flatfoot sliding (3.60 N). By reviewing the data, the reason for this larger figure became apparent; toe sliding is a spectrum of foot positioning. When the player lifts their heel off the ice, this can range from millimetres off the ice to the curler's foot being almost perpendicular to the ice surface. The greater the angle between the sole of the curler's shoe and the ice surface, the greater the ‘extent’ of the toe slide. Using the collected data and observing the videos taken from the volunteers delivering stones, it shows that the greater the angle of the toe slide, the greater the knee joint force.
Moment arm
While the increase in joint force is known to cause knee injuries, the results from this pilot study do not currently explain why there is an increase in joint force. Further investigation was required, and hence Vicon motion capture and force plates were used at IMAR on the two slide positions, to simulate and determine the difference in the moment arm (not the moment) around the tuck knee. This process was carried out a total of nine times on two different curlers, and the average moment arm length was calculated. A 14 camera system, 120 Hz Vicon Nexus 2.2.3, was used to collect the data, with markers being placed according to the lower body markers system.
Vicon motion capture and force plates were used on the two slide positions to confirm and illustrate the difference in the moment arm around the knee. Figure 5A depicts the line of action of the GRF in a flatfooted slide, while figure 5B depicts the line of action of the GRF in a toe slide.

Arrow showing the direction of the ground reaction force from Vicon in (A) flatfoot sliding and (B) toe sliding.
Moments around the knee were calculated from the data collected on the ice and from Vicon. Both show a statistically significant difference between flatfoot sliding and toe sliding, with p values <0.01.
When the biomechanics is considered, a correlation between the toe slide spectrum and knee joint force is to be expected. Moments around any joint are calculated using the following formula:
Moment = distance (moment arm) × force
As the curler increases the angle of their toe slide, the moment arm between their knee and the application of the GRF increases. The value for R1 remains very similar, but the distance between the point of application of R1 and the knee increases, hence the moment increases. In this situation the moment arm is the most influential variable in determining stability of the knee joint.
From the results obtained in the present pilot study, it can be clearly concluded that the moment arm is correlated to knee joint force (Pearson coefficient of 0.94, p<0.01). A greater angle of toe slide becomes significant because it creates a larger moment arm and therefore a larger joint force.
The images generated by Vicon system (figure 5) illustrate the direction and magnitude of the GRF in flatfoot sliding and toe sliding. While these two variables are very similar in both slide techniques, the images clearly demonstrate the increase in the moment arm from flatfoot to toe sliding.
This increase in the moment during the toe slide may put curlers at a higher risk of knee injuries while using this sliding technique compared with flatfoot sliding. Adopting this position necessitates the curler's centre of mass to be further forward over the knee, potentially causing the curler to be less stable. The less inherent stability that the knee possesses, the higher the risk of potential knee injuries. In flatfooted sliding, the GRF is almost directly behind the knee joint. This creates a small moment arm, and subsequently a small moment around the knee, locking the knee and the lower limb into a much more stable position.
Knee injuries
The current literature does not explore the exact pathology of curling-related injuries. All three published papers on the epidemiology of curling injuries refer to musculoskeletal injuries, but no further information is given. Further research, case discussions and clinical imaging are required to assess the types of injuries encountered before preventative measures could be suggested.
Implications for the sport
It is unlikely that every curler who toe slides would be willing, or be easily able, to change to a flatfoot sliding technique. The results from this study, that toe sliding is more likely to cause knee injuries than flatfoot sliding, should be a concern to the manufacturers of curling shoes and to curling coaches, as well as the players themselves. Curling shoe manufacturers should potentially consider the possible health risks of shoes that promote toe sliding and the financial possibilities of new designs, while coaches should consider the promotion of flatfoot sliding to prevent injuries to their players. Each curler needs to consider the risks and benefits of both techniques, and make an informed decision on which style of delivery they choose to adopt.
Footnotes
Acknowledgements The authors would like to acknowledge the following individuals and centres for their valuable contribution and advice: Michael Goodfellow, Team GB Curler; David Jones, Coach, Royal Caledonian Curling Club; Ian S Christie, Illustrator, IMAR; Dundee Ice Arena; The Peak Sports Village, Stirling; and Stirling Young Curlers.
Contributors IR: Substantial contribution to the conception and design of the project, collecting and analysing the data, and writing the manuscript. GPA: Substantial contribution to the design of the project, data collection and software analysis, and revising the manuscript critically. WW: Significant contribution to the design and statistical analysis, and helped in preparing the manuscript and revising it critically. TSD: Significant contribution to the design and the associated physics, and helped in preparing the manuscript and revising it critically. SN: Significant contribution to data collection and interpretation of data. CM: Significant contribution to data collection and analysis. RJA: Substantial contribution to the conception and design of the project, supervised the project, and helped in preparing the manuscript and revising it critically for final submission.
Competing interests None declared.
Patient consent Obtained.
Ethics approval University of Dundee Research Ethics Committee.
Provenance and peer review Not commissioned; externally peer reviewed.