Article Text

Abstract
Aims To explore: (1) whether during exercise metabolic equivalents (METs) appropriately indicate the intensity and/or metabolic cost for post-myocardial infarction (MI) males and (2) whether post-exercise VO2 parameters provide insight into the intensity and/or metabolic cost of the prior exercise.
Methods 15 male phase-IV post-MIs (64.4±6.5 years) and 16 apparently healthy males (63.0±6.4 years) participated. Participants performed a graded cycle ergometer test (CET) of 50, 75 and 100 W, followed by 10 min active recovery (at 50 W) and 22 min seated recovery. Participants’ heart rate (HR, bpm), expired air parameters and ratings of perceived exertion (exercise only) were measured.
Results General linear model analysis showed throughout significantly lower HR values in post-MI participants that were related to β-blocker medication (F (2,5)=18.47, p<0.01), with significantly higher VCO2/VO2 (F (2,5)=11.25, p<0.001) and gross kcals/LO2/min (F (2,5)=11.25, p<0.001). Analysis comparing lines of regression showed, during the CET: post-MI participants worked at higher percentage of their anaerobic threshold (%AT)/MET than controls (F (2,90)=18.98, p<0.001), as well as during active recovery (100–50 W) (F (2,56)=20.81, p<0.001); during seated recovery: GLM analysis showed significantly higher values of VCO2/VO2 for post-MI participants compared with controls (F (2,3)=21.48, p=0.001) as well as gross kcals/LO2/min (F (2,3)=21.48, p=0.001).
Conclusion Since METs take no consideration of any anaerobic component, they failed to reflect the significantly greater anaerobic contribution during exercise per MET for phase-IV post-MI patients. Given the anaerobic component will be greater for those with more severe forms of cardiac disease, current METs should be used with caution when determining exercise intensity in any patient with cardiac disease.
- exercise prescription
- post-exercise
- anaerobic threshold
- indices
This is an Open Access article distributed in accordance with the Creative Commons Attribution Non Commercial (CC BY-NC 4.0) license, which permits others to distribute, remix, adapt, build upon this work non-commercially, and license their derivative works on different terms, provided the original work is properly cited and the use is non-commercial. See: http://creativecommons.org/licenses/by-nc/4.0/
Statistics from Altmetric.com
What are the new findings?
The percentage anaerobic component per metabolic equivalent (%AT/MET) is significantly higher for those with cardiac disease compared with healthy individuals.
Current METs underestimate the exercise intensity and anaerobic demand of exercise for patients with cardiac disease.
Reducing METs to account for body composition does not reliably address the issue of increased %AT/MET for those with cardiac disease.
Any value, indices or equation used in determining exercise intensity or in prescription of exercise for patients with cardiac disease, which does not consider the anaerobic component, should be used with caution.
Introduction
Post-myocardial infarction (MI) patients make up the largest proportion of cardiac rehabilitation participants in England,1 and while considerable research has been conducted into the differences in physiological responses to exercise in those with more severe forms of heart disease, such as heart failure,2–5 there are still relatively few studies performed on those who have suffered MIs.6 In particular, among those who have completed cardiac rehabilitation and exercise regularly within the community (phase IV). Increasingly, researchers have questioned the use of equations and indices based on healthy individuals to estimate exercise intensity and assist in physical activity prescription in settings like cardiac rehabilitation.7 ,–10
The primary aim of this study was to explore whether current metabolic equivalents (METs, 1 MET ~ VO2 of 3.5 mL/kg/min) appropriately indicate exercise intensity and/or metabolic cost of exercise in phase-IV post-MI males. Additionally, research has shown postexercise measures of oxygen uptake parameters to provide insight into the intensity of the prior exercise in patients with cardiac disease.11 Therefore, a secondary aim was to observe whether postexercise measures provided further understanding into the intensity and/or metabolic cost of a bout of cycle ergometry when comparing phase-IV cardiac rehabilitation post-MI patients with male controls.
Methods
Ethical approval was provided by the local NHS Research Ethics Committee and the University Faculty of Social and Applied Science Research Ethics Committee, ref: 09/H1101/34.
Power and sample size calculations
Based on a previously observed statistically significant difference in VO2 of 2.3±1.8 mL/kg/min between people with cardiac disease and those with normal heart function during cycle ergometry,5 using Minitab statistical package (version 17), 15 participants were required in each group to achieve 90% power at an α of 0.05.
Participant recruitment
Fifteen men classified with an uncomplicated MI (4.7±3.2 years since MI) were recruited through community phase-IV cardiac rehabilitation exercise classes. Sixteen apparently healthy volunteers were recruited from the same area through word of mouth and posters. All volunteers were given a Participant Information Sheet and interested individuals were asked to complete a Health and Physical Activity Screening Questionnaire. The post-MI volunteers were required to be ‘uncomplicated’, stable, at phase-IV cardiac rehabilitation level, taking standard medications, such as, statin, β-blocker, aspirin and ACE inhibitor. Potential controls were to be free of cardiac disease and/or event and/or chronic medical condition and/or taking long-term medications. All participants were required to be non-smoking, understand the nature of the study, aged between 50 and 75 years, perform similar levels of regular physical activity and free of any orthopaedic limitations during exercise. Participants that cleared screening were required to provide written informed consent and written acknowledgement of their participation from their general practitioner. Participants were free to withdraw from the study at any time without providing a reason.
Procedures
All data were collected in the same Exercise Laboratory. On arrival, each participant was measured for height (Stadiometer Seca 220, Seca, Hamburg, Germany) and body mass (Seca 710, Seca), thus body mass index was derived. Each participant then sat quietly for 10 min while measures of resting blood pressure (mm Hg) (Yamasu Mercurial Spygmomanometer 605P; Kenzmedico, Japan) and heart rate (HR, bpm) (Polar Model S810, Kempele, Finland, worn on strap around chest) were recorded in accordance with Association Chartered Physiotherapists in Cardiac Rehabilitation (ACPICR)12 guidelines for pre-exercise checks. Following these measures, respiratory function forced vital capacity and forced expiratory volume in 1 s was recorded by forced exhalation into a portable Spirometer. A total of three spirometry tests were performed with short recovery, and the best was recorded.
Prior to each participant’s assessments, equipment was calibrated. To provide an indication of pre-exercise resting VO2, expired air was collected via a Hans Rudolph breathing valve (2700; Hans Rudolph, Kansas City, MO, USA) and plastic tubing into a Douglas bag (Model 6170, 170 L capacity non-diffusing gas collection bag, Hans Rudolph). A nose clip was worn and each participant sat quietly for 5 min. The final minute of collection was used in analysis. The expired gas was analysed using a gas analyser (Servomex, West Sussex, UK). The expired volume of air was measured using a dry gas meter (Harvard Apparatus, Kent, UK) by evacuating each Douglas bag using a vacuum pump.
Upright cycle ergometer test
During cycle ergometer test (CET), active recovery and seated recovery, VO2 and CO2 production were measured using the Douglas bag method, the ‘gold standard’ for measuring efficiency,13 coefficient of variation was <0.5% for both O2 and CO2,14 methods previously described. Expired gases were collected over the final minute of each 6 min wattage stage and during active and seated recovery, along with ratings of perceived exertion (RPE) Borg 6–20 scale15 (exercise only). The gross energetic equivalent/metabolic cost of VCO2/VO2 was calculated using data from non-protein respiratory quotient, regression equation: kcal/LO2/min=1.2411xVCO2/VO2 +3.8076, R2=0.9996.16
This study adopted a methodology in accordance with recommendations for exercise testing cardiac populations,12 including an extended postexercise period, as patients with cardiac disease require more time to return to pre-exercise levels.17 18 The protocol was designed to address criticisms of previous studies19–21; therefore, measures were taken comparing gross efficiency in patients and controls at the same ‘absolute’ workloads to gain a ‘truer’ indication of exercise cost.22 Following pre-exercise resting measures, each participant undertook the CET. This was performed on a SRM cycle erogmeter (Schoberer Rad Messtechnik, Julich, Germany) with seat height adjusted to ensure that participants' knees were slightly bent when the pedal was at the bottom of the crank stroke. Exercise started at a low intensity acting as a warm-up.12 Exercise intensity was increased every 6 min until three incremental levels were completed (50, 75 and 100 W, respectively). Cadence was set at 60 revolutions per minute (rpm), shown to be most economical across a range of power outputs.22–24 Therefore, in line with recommendations, termination point should have been just below maximum intensity.12 This was immediately followed by 10 min active recovery at 50 W with 60 rpm.
Postexercise VO2 parameters
After active recovery, participants were seated, expired air continued to be collected and measured during 10th to 11th and 21st to 22nd min.
Data analysis
Statistical analysis was performed using Minitab statistical package (version 17), with a 5% level of significance. Bonferroni correction factor was applied where appropriate, which shifted the point of statistical significance. Variability of data within a distribution was given as 1 SD (mean±SD). Baseline differences between groups were determined using an independent t-test. General linear model was used to compare differences in the measured variables between the groups during and post-CET. One-way analysis of variance was used post hoc to determine differences between groups at individual data collection points. VCO2/VO2=1.0 was used to describe point of anaerobic threshold (AT) as this has been shown to correlate highly with blood lactate values and deemed appropriate when testing patients with cardiac disease, where HR values are unreliable.25 Regression analysis comparing lines of trajectory determine the difference between percentages of AT (%AT) versus METs relationship (%AT/MET) between groups. All data were double checked for transcript errors.
Results
Participants
Table 1 shows participant characteristics at baseline.
Participant characteristics at baseline, mean±SD (range)
Medications
Since all post-MI participants were taking both β-blockers and a statin (all but one participant, table 2), the statistical effect of both were similar to the group effect. It is likely that the reduced HR values for the post-MI participants throughout were due to their β-blocker medication. There were few participants taking other medications (table 2) to determine any meaningful statistical effect on any of the measured variables.
Number of post-MIs taking various cardiovascular medications
Cycle ergometer test
Bonferroni shifted significance to p <0.017, analysis revealed HR (F (2,3)=17.64, p<0.001) to be significantly lower in post-MI participants with no significant difference in any of the other measured variables between groups (table 3). Post-MIs participants reached AT25 at VO2 18.7 mL/kg/min (AT=68.60x1.0–49.95, R2=0.998) compared with 22.8 mL/kg/min for controls (AT=87.91x1.0–65.10, R2=0.996), which were significantly different after Bonferroni shifted significance to p<0.001 (F (2,90)=43.99, p<0.001); %AT/MET relationship showed a significantly greater anaerobic component per MET for the post-MI participants compared with controls (F (2,90)=18.98, p<0.001).
Measured variables during and post-CET (mean±SD)
Active recovery (100–50 W)
Bonferroni shifted significance to p<0.025, HR (F ( 2,2 )=17.59, p<0.001) was significantly lower for post-MI participants, with no significant differences in any other measured variables. Analysis comparing %AT/METs relationship, where Bonferroni shifted significance to p<0.00, showed that %AT/MET was again significantly greater for post-MIs (F( 2,56 )=20.81, p <0.001).
Seated recovery
Bonferroni shifted significance to p<0.017, HR was significantly lower (F ( 2,3 )=17.59, p<0.001) for post-MI participants, with greater VCO2/VO2 (F ( 2,3 )=21.48, p=0.001) and gross kcal/LO2/min values (F ( 2,3 )=21.48, p=0.001). Analysis comparing %AT/METs relationship showed no significant difference between groups. However, post-MI participants showed higher VCO2/VO2 and subsequent gross kcal/LO2/min compared with controls during the 11th (F (2,10)=11.14, p=0.002) and 22nd min (F (2,10)=11.21, p=0.002) (table 3).
CET, active and seated recovery
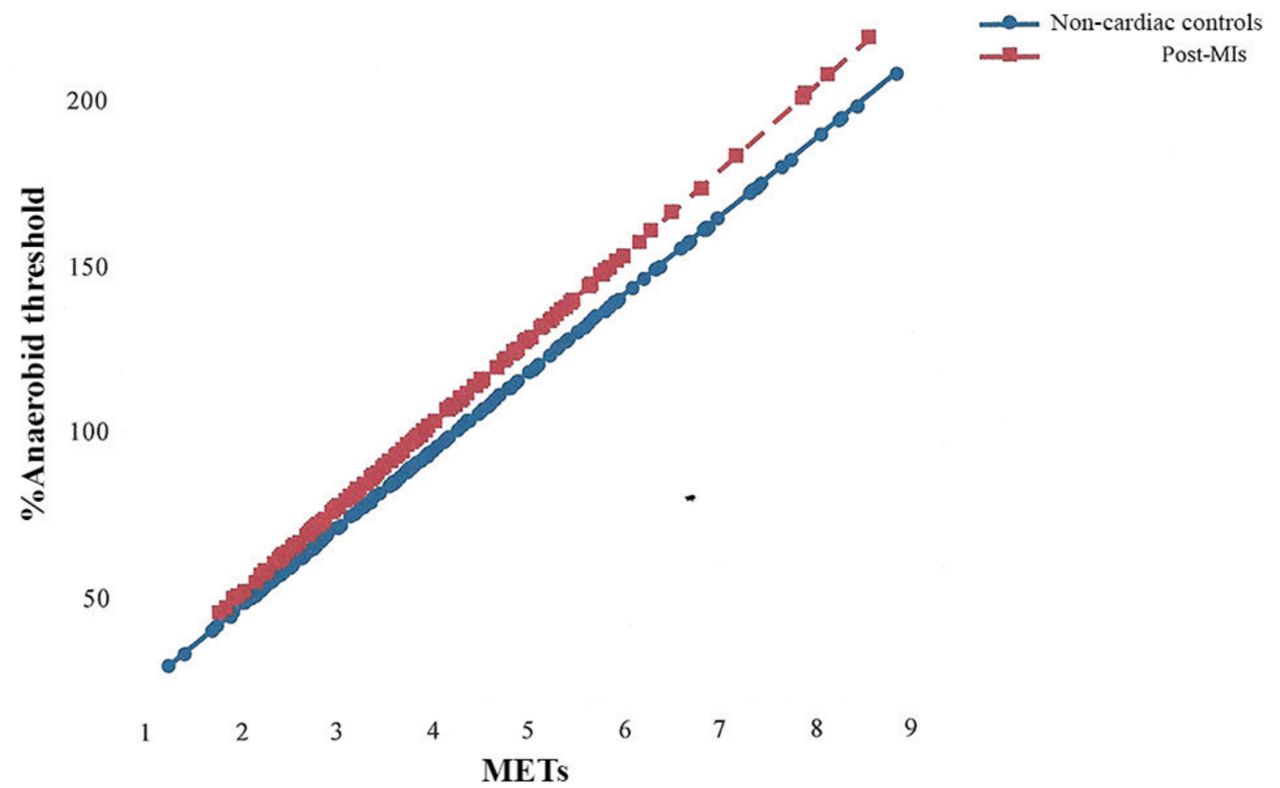
Bonferroni shifted significance to p<0.001, %AT/METs was significantly greater throughout for post-MI participants compared with controls (F ( 2,90 )=9048.0, p<0.000) (figure 1), with significantly greater gross kcal/LO2/min (F ( 2,179 )=16.22, p<0.001).

Percentage of anaerobic threshold–metabolic equivalent (MET) relationship throughout cycle ergometry, active and seated recovery, for post-myocardial infarction (MI) patients versus non-cardiac controls.
Discussion
Throughout the CET and active recovery there were no significant differences between groups in RPE, VO2 parameters or derived METs. Therefore on first inspection, current METs would appear to appropriately estimate exercise intensity for the phase-IV post-MIs. However, METs are based on multiples of relative measures of resting VO2, which of course takes no account of any anaerobic component. On this basis, the assumption is that the anaerobic component per MET would be similar across populations. Yet, our findings show this not to be so, as post-MI participants clearly worked at a significantly higher percentage of their AT25 per MET when compared with the controls across the exercise intensity range (figure 1).
Increased anaerobic metabolism
Using the same statistical methods, reanalysis was conducted on data taken from two published studies10 26 and from another paper27 that compared phase-IV post-MI males with non-cardiac controls during graded exercise. The findings revealed that irrespective of different physiological and RPE responses, for all studies, post-MIs worked more anaerobically per MET (%AT/MET), with varying degrees of heteroscedasticity between studies as exercise intensity increased. For example, Meadows and Woolf-May10 found that during a treadmill walking protocol of speeds 2.0–4.4 miles/hour (figure 2), 17 post-MI participants (aged 63.0±8.5 years) produced significantly higher VO2 mL/kg/min values than 17 non-cardiac males (aged 51.9±7.7 years) (F ( 2,8 )=5.25, p <0.05) with no significant differences in VCO2/VO2 or HR. However, the study employing the Modified Bruce treadmill walking test,27 involving 20 post-MI participants (aged 64.4±5.8 years) and 20 male controls (aged 59.8±7.6 years), showed no significant differences between groups in VO2 mL/kg/min, again with no differences in VCO2/VO2 or HR but the %AT/MET was significantly greater for the post-MI participants.28 Reanalysis of the findings from the study comparing two different 10-m shuttle walking test (SWT) protocols (one using cones around which to turn, figure 3, and the other without, figure 4),26 also using 20 post-MI participants (aged 64.8±6.6 years) and 20 male controls (aged 64.1±5.7 years), showed that during the 10-m SWT with cones, no significant differences in VO2 parameters were observed, but RPE was higher for post-MI participants (F ( 2,10 )=4.78, p<0.05). During the 10-m SWT with no cones however, post-MI participants displayed significantly greater VCO2/VO2 (F=23.51,p <0.01) and RPE (F=4.78, p <0.05) values than the controls. For both 10-m SWT protocols, HR values in post-MI participants were significantly lower (F ( 2,10 )=72.2, p <0.05), likely due to β-blocker medication.26

Percentage of anaerobic threshold–metabolic equivalent (MET) relationship during graded treadmill walking for post-myocardial infarction (MI) patients versus non-cardiac controls.10
Percentage of anaerobic threshold–metabolic equivalent (MET) relationship during the 10 m shuttle walking test with cones for post-myocardial infarction (MI) patients versus non-cardiac controls.26

Percentage of anaerobic threshold–metabolic equivalent (MET) relationship during the 10 m shuttle walking test without cones for post-myocardial infarction (MI) patients versus non-cardiac controls.26
Although it is clear that the single marker of VCO2/VO2 equal to 1.0 may not be considered a 'true' indicator of AT, as shown by the high y axis figures seen in figures 1-4, it does however represent an important shift in metabolism. The fact that all post-MI participants of these studies work at a higher %AT/MET is not to be unexpected, as it has been known since the 1960s that patients with cardiac disease reach the point where VCO2/VO2 equals 1.0 at a lower VO2 (mL/kg/min) than their non-cardiac counterparts,29 and the more severe the heart disease, the sooner this point is reached.2 However, METs, which take no account of any anaerobic component are currently advocated by the British Association of Cardiac Prevention and Rehabilitation30 and the American Association of Cardiovascular and Pulmonary Rehabilitation31 for use in the prescription of exercise and determination of exercise intensity to cardiac populations.
METs are often used synonymously to describe the exercise intensity and energy expenditure/metabolic cost of physical activity. While overall energy expenditure was statistically significantly higher for the post-MI participants in this study, pragmatically, this only equated to a mean of 0.06 kcal/min. Yet, the anaerobic component per MET was undoubtedly greater for the post-MIs. For example, 5 METs, considered to be of moderate intensity, for this study equated to 76.8%AT for controls but 93.6%AT for the post-MI participants. The difference of which increased with exercise intensity, as 7 METs, considered to be of vigorous intensity, equated to 101.5%AT for controls, but was 30% higher for post-MI participants at 131%AT, an intensity considered potentially hazardous for most of these patients.
During exercise, at and beyond the point where VCO2/VO2 equals 1.0, metabolic acidosis increases exponentially. Therefore, for most patients with cardiac disease, who reach this point sooner, similar amounts of physical work would be more physically demanding in comparison to non-cardiac individuals. A study performed by Takagi et al 6 observed that for post-MI patients, even as soon as 21±8 days post-event, the main factor limiting their exercise capacity was related to their inability to use oxygen rather than oxygen delivery per se, which was found due to skeletal muscle deoxygenation abnormalities. The outcome resulting in a slowing in oxygen kinetics,32 causing greater reliance on anaerobic metabolism to meet the demands of the physical work.33 Although similar findings are well reported in those classified with heart failure,29 32 34 there are relatively few reported studies showing this in more physically able patients with cardiac disease, such as phase-IV cardiac patients.
The increased reliance on anaerobic processes in patients with cardiac disease is well reported and largely multifactorial, potentially involving reductions in cardiac output, neurohormonal/cytokine activation and/or changes in skeletal muscle blood flow.6 35 36 Decreases in ‘efficient’ oxidative (type 1) skeletal muscle fibres, oxidative enzymes, mitochondrial density and muscle atrophy are mostly reported in those with chronic heart failure,35–38 along with reduced phosphocreatine stores and 50% higher ATP consumption,3 all contributing to metabolic skeletal muscle inefficiency.39 However, skeletal muscle morphology can also occur in those with mild heart failure,37 causing a higher reliance on anaerobic processes11 20 and greater energy expenditure.3 Animal studies indicate the extent of these changes are likely dependent on the size of MI and amount of left ventricular dysfunction.36
Whether the medications taken by the post-MIs were influential on our findings is difficult to determine. As discussed in previous publications,8 10 both statins and certain β-blocker medications can result in increased reliance on anaerobic metabolism. β-blockers are known to alter cardiorespiratory response by slowing HR, thus affecting oxygen kinetics40 41 and reduce skeletal muscle blood flow, consequently increasing general fatigue.42 β-blockers have also been found to have similar depressive effects on lipolysis as statins43 44 and therefore potentially contributed towards any shift towards anaerobic metabolism. The very same participants taking β-blockers in this study were also taking statins, thus producing statistically similar results. High-dose statins may also lead to muscle myopathy and interfere with fatty acid oxidation, producing greater oxidation of carbohydrates,43 all potentially contributing to a shift towards anaerobic processes as observed in the post-MI participants.
Body composition
Some researchers have suggested that for specific populations the 1 MET value should be adjusted, especially for overweight45 46 and cardiac populations.7 Savage et al 7 suggested that for normal and overweight cardiac patients, the resting 1 MET should be reduced to a VO2 of 2.84 mL/kg/min. To determine whether this would apply, secondary analysis of this and the other studies was performed.10 26 28 Analysis showed a perfect correction in %AT/MET between post-MIs and controls for this study, as for the Modified Bruce protocol,28 and the 10-m SWT without the cones26 (p>0.05). However, for the 10-m SWT with the cones26 and treadmill walking study,10 the correction of 1 MET of 2.8 4 mL/kg/min reversed the significant difference, as controls now showed a greater %AT/ MET (p <0.05). Thus indicating the adjustment to overcompensate for certain protocols, suggesting body composition not to be the only influential factor in MET differences between cardiac and non-cardiac populations.
During the Modified Bruce study, body composition of the participants was measured.28 Analysis showed only lean body mass to be influential, having a significant effect on breathing frequency (F ( 2,5 )=6.71, p<0.01). However, this was not sufficient to influence the significantly higher breathing frequency observed in the post-MI participants (F ( 2,5 )=19.74, p<0.01), which was not accompanied with significant differences in minute ventilation (L/min) between groups. The major factor to influence breathing frequency is usually blood CO2 levels, leading to lowering in pH as CO2 increases.37 Therefore, the increased breathing frequency of the post-MI would indicate the use of enhanced anaerobic metabolism.28
Postexercise
Despite there being no observed differences in parameters of VO2 during the CET or active recovery, during seated recovery, compared with controls, the post-MI participants produced significantly elevated VCO2/VO2 values, taken during the 11th and 22nd min of expired gas collection (table 3). This would indicate a slowing in their O2 kinetics, producing higher proportions of CO2, which continued for some time after exercise had ceased.
In summary, it is clear that during exercise, current METs, or METs adjusted for body weight, do not consistently reflect the significantly higher anaerobic component per MET observed in phase-IV post-MIs when compared with the controls. Since the anaerobic component is likely greater for patients with more severe heart disease, any value, indices or equation used in determining exercise intensity or in prescription of exercise to cardiac patients, which does not consider the anaerobic component, should be used with caution.
REFERENCES
Footnotes
Acknowledgements The authors thank cycle efficiency experts Dr James Hopker and Dr Simon Jobson for assistance in protocol design and the statistician Dr Sabina Hulbert for her advice and verification of the statistical analysis of data.
Contributors SM with assistance from experts in cycle efficiency, Dr Hopker and Dr Jobson, and KW-M developed the research protocol. SM conducted data collection and assisted in editing. KW-M conducted data analysis and report writing. Both authors contributed in gaining ethical approval and administrative procedures.
Competing interests None declared.
Provenance and peer review Not commissioned; internally peer reviewed.