Article Text

Abstract
Background/aim To determine if Boys Bantam and Peewee and Girls U14 sustain fewer concussions, head hits, ‘other injuries’ and penalties in hockey tournaments governed by intensified fair play (IFP) than non-intensified fair play (NIFP).
Methods A prospective comparison of IFP, a behaviour modification programme that promotes sportsmanship, versus control (non-intensified, NIFP) effects on numbers of diagnosed concussions, head hits without diagnosed concussion (HHWDC), ‘other injuries’, number of penalties and fair play points (FPPs). 1514 players, ages 11–14 years, in 6 IFP (N=950) and 5 NIFP (N=564) tournaments were studied.
Results Two diagnosed concussions, four HHWDC, and six ‘other injuries’ occurred in IFP tournaments compared to one concussion, eight HHWDC and five ‘other injuries’ in NIFP. There were significantly fewer HHWDC in IFP than NIFP (p=0.018). However, diagnosed concussions, ‘other injuries’, penalties and FPPs did not differ significantly between conditions. In IFP, a minority of teams forfeited the majority of FPPs. Most diagnosed concussions, HHWDC, and other injuries occurred to Bantam B players and usually in penalised teams that forfeited their FPPs.
Conclusions In response to significant differences in HHWDC between IFP and NIFP tournaments, the following considerations are encouraged: mandatory implementation of fair play in regular season and tournaments, empowering tournament directors to not accept heavily penalised teams, and introducing ‘no body checking’ in Bantam.
- Behaviour
- Concussion
- Injury
- Ice hockey
This is an Open Access article distributed in accordance with the Creative Commons Attribution Non Commercial (CC BY-NC 4.0) license, which permits others to distribute, remix, adapt, build upon this work non-commercially, and license their derivative works on different terms, provided the original work is properly cited and the use is non-commercial. See: http://creativecommons.org/licenses/by-nc/4.0/
Statistics from Altmetric.com
Summary box
The number of diagnosed concussions did not differ between intensified fair play (IFP) and non-intensified fair play (NIFP) tournaments.
NIFP tournaments had many more diagnosed ‘head hit’ injuries than IFP despite IFP having 1.5 times more players.
A small subset of teams lost a majority of the fair play points in the IFP tournament.
Fair play increases sportsmanship and decreases injuries, including head trauma.
Introduction
Ice hockey is a fast, competitive, potentially violent game played on ice surrounded by hard boards.1–9 In 2002, Minnesota (MN) Hockey established a committee to reduce increasing violence in youth hockey.10 In 2004, MN Hockey and Mayo Clinic Sports Medicine launched a Hockey Education Program (HEP), the core of which is fair play (FP), a behavioural modification programme.11–13 FP was developed by Edmund Vaz after youth hockey registrations in Quebec dropped by 100 000 players between 1980 and 1990.14 Injuries, violence, aggressive infractions and cost explained the attrition.15 Vaz14 studied players (7–18 years of age), concluding that aggressive behaviour learned in hockey could be reduced by emphasising sportsmanship.
Determined by level of participation (LOP), fair play points (FPPs) are forfeited when teams exceed their predetermined penalty minutes (PIMS) per game. When a team is granted a FPP for sportsmanlike behaviour, it is added to the two points earned for a win or the single point earned for a tie. FPPs are counted in season standings. Although league games are governed by FP, only 10% of MN invitational tournaments are voluntarily run by FP. Marcotte and Simard15 showed that implementing FP in youth hockey resulted in fewer penalties and game suspensions than games not governed by FP. On average, 7.1 penalties per game (ppg) were called under FP compared to 13 ppg under regular rules. A later study conducted on Junior Gold players (high school age), showed penalties and injuries, including concussions, decreased fourfold in teams playing by FP.11 Investigators recommended FP be implemented at all levels of youth hockey to reduce injuries and penalty rates.11
Since the 2004–2005 season, our research team has analysed MN youth hockey game score sheets to track the effects of FP.12 ,13 Results show a decrease in major penalties and an increase in FPPs granted over time.12 ,13 In addition to 2 min minors and 5 min and 10 min major penalties, MN Hockey introduced a ‘10 and 2’ (a 10 min major penalty and a 2 min minor) that counts as two penalties, allocated to dangerous infractions.13 These rule changes resulted in fewer head hits and checks from behind, infractions that cause injuries such as concussion.12 ,13
Although score sheets indicate whether teams earned FPPs, their success has neither been celebrated nor resulted in significant consequence. Since MN Hockey adopted FP in 2004, all teams have been exposed to FP. However, most tournaments do not use FPPs as the second tie breaker to determine which teams advance. Teams tied after three periods of regulation play an overtime period. If still tied after overtime, FPPs may be used identify the team that moves on to the tournament finals. Thus, if tournaments do not use FP, an important opportunity for behavioural modification is lost.
This study compared concussions, head hits without diagnosed concussion (HHWDC), ‘other injuries’, penalties and FPPs in tournaments where FP was emphasised and influenced team standings (IFP) to tournaments where FP was not emphasised (NIFP). It was hypothesised that IFP players would sustain fewer concussions, HHWDC, ‘other injuries’ and total penalties while earning more FPPs than age and skill-matched players governed by NIFP. Investigators believed rigorous enforcement and advertising FP would incent players, coaches and parents to behave in a more sportsmanlike manner. Officials were to call the game ‘as they saw it’, consistent with regular season officiating. Youth LOP at risk of concussion were studied: Bantams (A&B), Peewees (A&B) and Girls U14.16 ,17
Methods
Experimental approach to the problem
The two youth cohorts studied included players exposed to IFP rules and players governed by NIFP rules.
Subjects
After obtaining approval from the Mayo Clinic Institutional Review Board, Rochester, MN, USA study materials were sent to the tournament directors for distribution to coaches and managers. On receipt, players and parents were asked to review a letter from principal investigators (PIs) explaining study details and the FP concept prior to enrolment. A demographic form, the Mayo Clinic Concussion Survey (MCCS) and a consent form were to be signed and returned. Our research team attended all 11 tournaments to collect signed consent forms. Despite these efforts, few signed consent forms were received, thus a decision was made to collect only the observational data available to any fan.
Procedure
Our research team invited our local youth hockey association (YHA) to run its tournaments by IFP rules. A Minneapolis-area YHA was invited to run its tournaments by NIFP (usual rules). IFP and NIFP conditions each had a tournament director. The research team communicated with both directors throughout data collection. Eleven tournaments were studied, six under IFP and five under NIFP between December 2013 and February 2014.Thus, 210 games were monitored, yielding 420 team games, one per team per game played. Of 420 team games played, 262 (62.3%) were IFP and 158 (37.6%) were NIFP. To emphasise FP philosophy and rules governing IFP tournaments, investigators promoted player coach, and parent sportsmanship by: (A) hanging four banners (10×8 ft) in the IFP venue, (B) positioning a FP table with signage, rules and FP rule booklets beside the registration table, (C) posting team FPPs and standings after each game, and finally (D) reading announcements before games reminding stakeholders that the tournaments were governed by FP. Handouts listed LOP and PIMS thresholds not to be exceeded if teams were to be granted their FPPs.
Certified athletic trainers (ATC) at IFP games and emergency medical technicians (EMT) at NIFP games evaluated all observed and self-reported concussions, HHWDC and ‘other injuries’. Rink-side concussion evaluation included the Sport Concussion Assessment Tool 3 (SCAT3), the Post-Concussion Symptom Scale (PCSS), Delayed Recall, and the Maddox Scale.18 ,19 SCAT3 components were selected by two sports medicine physicians and our athletic training supervisor. Discussions a priori ensured that onsite medical providers would use identical elements to make their concussion diagnosis.
Tests and measures
Variables measured included diagnosed concussions, HHWDC, ‘other injuries’, penalties and FPPs.
Concussion: A concussion was defined as a brain injury or transient neurological dysfunction resulting from a biomechanical force. ATCs or EMTs made the diagnoses at each tournament. Players returned to play if concussion evaluations were negative, but were withheld if evaluations were positive.
HHWDC: HHWDC was a category we created to include players who sustained head hits but did not meet all concussion criteria when evaluated.
Other injuries: This category included all non-concussion injuries such as lacerations, sprains and fractures.
Penalties: Penalties called for rule infractions resulted in teams playing one man short for the penalties’ duration. The time a team played a man short depended on whether penalties were minors, that is, called for tripping, hooking, etc, or majors, that is, called for head hits, checks from behind, fighting, etc.
FP points: Each team starts a game with a FPP which is theirs to lose. FPPs are granted if a team's PIMS per game do not exceed their LOP threshold. Bantam threshold is 14 PIMS and Peewee and Girls U14 have a threshold of 12 PIMS.
Score Sheet Data: Official score sheets completed by tournament scorekeepers were signed by officials. Copies were obtained by investigators after games. PIMS per game determined if FPPs were granted or not. Score sheets provided the number of players, goals scored, FPPs earned and penalties called (type and PIMS) for analysis.
Statistical analyses
Outcomes included rates of concussions, HHWDC, other injuries, and penalties, expressed as rate of occurrence per 1000 player game hours (pgh). FPPs earned were expressed as a percentage of games played. Exposure, defined as pgh, was calculated as five players on ice at any given time (goalies excluded) multiplied by the game duration, including overtime periods. Thus all players in a given game were assumed to be at equal risk. Game durations were 45 min (three 15 min periods), except for Peewee A and B in the NIFP tournaments, which were 36 min (three 12 min periods). Overtime periods were 5 min each. For example, a team playing in a 45 min game with a 5 min overtime period accrued ((5 players×45 min)+(5 players×5 min))=250 min of exposure time, or 250 ÷ 60=4.2 pgh of exposure. Data available on 187 games, yielded 374 sets of data, one per team per game. CIs were calculated assuming a Poisson distribution. Outcome comparisons between IFP and NIFP conditions were performed using Poisson regression, with number of events as the dependent variable, and number of pgh included as an offset. When a comparison involved a count of 0 events, the risk ratio was calculated using a penalised likelihood approach in logistic regression. All tests were two-sided and p values less than 0.05 were considered statistically significant.
Results
There was a large unanticipated difference between the number of IFP players (N=948) and teams (N=62) in comparison to the NIFP players (N=564) and teams (N=37). Both conditions averaged 15 players per team, for a total of 1514 players (1186 males and 328 females) on 99 teams. In IFP, there were 186 Bantam A players, 250 Bantam B, 165 Peewee A, 178 Peewee B, 114 Girls U 14A and 57 Girls U 14B. In NIFP, there were 127 Bantam A, 125 Bantam B, 78 Peewee A, 78 Peewee B and 157 Girls U14. To compare between NIFP Girls U14 (N=157) and IFP Girls U14, the A and B divisions were collapsed into one division (N=171).
Concussion: Two concussions were diagnosed in IFP and one in NIFP. Owing to low occurrence (table 1), there was insufficient statistical power to detect concussion differences between the two conditions (p=0.961) (table 2).
Outcome injury variables
Concussions
HHWDC: Four HHWDC occurred in 248 IFP team games and 8 in 126 NIFP team games. The risk of HHWDC was significantly higher among NIFP compared to IFP players (RR=4.3, p=0.018) (table 3).
Head hits without diagnosed concussion (HHWDC)
Other injuries: Six other injuries occurred in IFP and five in NIFP. Although the risk of these injuries was higher among the NIFP players relative to the IFP players (RR=1.8), this did not reach statistical significance (p=0.345) (table 4).
Other injuries
Penalties: The penalty rate among NIFP Peewee B and Girls U14 teams was significantly higher than IFP teams (Peewee B: 1151.5/1000 pgh vs 777.8/1000 pgh, RR=1.5, p=0.006 and Girls U14: 1003.5/1000 pgh vs 794.4/1000 pgh, RR=1.3, p=0.048). There was no significant difference overall in penalty rates between NIFP and IFP (1019.0 vs 926.3, RR=1.1, p=0.102) (table 5).
Penalties
FP points: When examined by LOP, NIFP Peewee A teams earned significantly more FPPs than IFP Peewee A teams (100% vs 80.4%, p=0.02). The opposite was true for Peewee B, where IFP teams earned significantly more FPPs than the NIFP Peewee B teams (95.8% vs 72.7%, p=0.009). Overall, there was no significant difference in FPPs earned between NIFP and IFP teams (82.3% vs 79.8% p=0.578) (table 6).
Fair play points (FPPs)
Teams repeatedly forfeiting FPPs: correlation with injuries
Examination of IFP tournaments revealed repeated forfeitures of FPPs, two or more of a possible 4–5, by a minority of teams. In Bantam A, 32 FPPs were earned and 14 FPPs were lost, 50% by 2 of 11 teams. In Bantam B, 44 FPPs were earned and 16 were lost, 43.8% by 3 of 16 teams. In Girls U14, 39 FPPs were earned and 9 were lost, 44.4% by 2 of 8 teams. In Peewee A, 37 FPPs were earned and 9 were lost, 50% by 1 of 11 teams. No Peewee B teams repeatedly lost their FPPs. Injuries occurred to Bantam A, Bantam B, and Girls U14 (A/B). Teams repeatedly losing their FPPs, total FPPs lost and total number of injuries were graphed together across each LOP (figure 1).
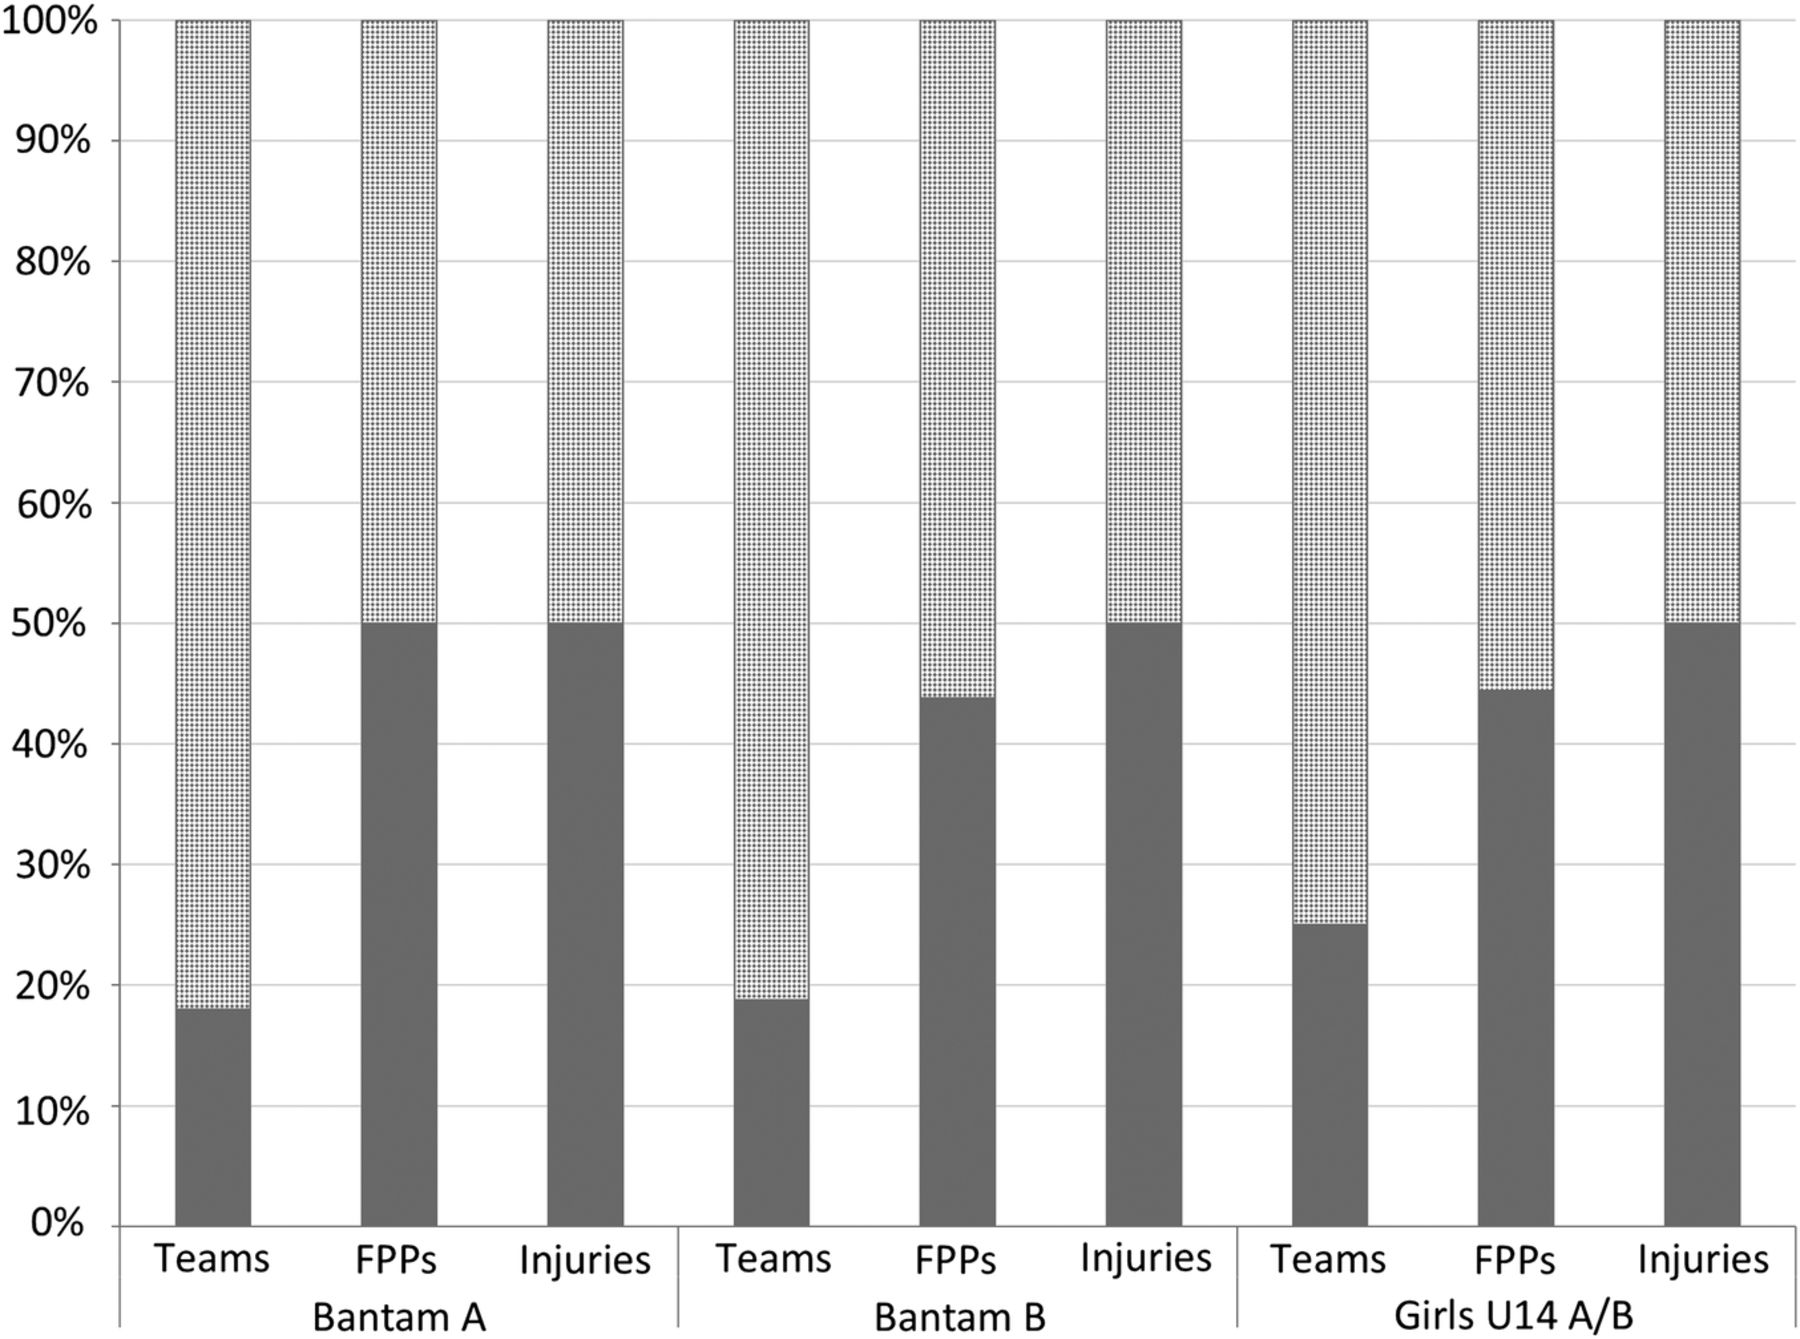
Dark grey in the ‘Teams’ bar represents the subgroup of IFP teams per LOP who repeatedly lost their FPPs. Dark grey in the ‘FPPs’ bar represents the percentage of FPPs lost by the subgroup. Dark grey in the ‘Injuries’ bar represents the percentage of injuries that occurred in games in which those teams were playing. One injury was not attributed to a specific team and was omitted from analysis. FPPs, fair play points; IFP, intensified fair play; LOP, level of participation.
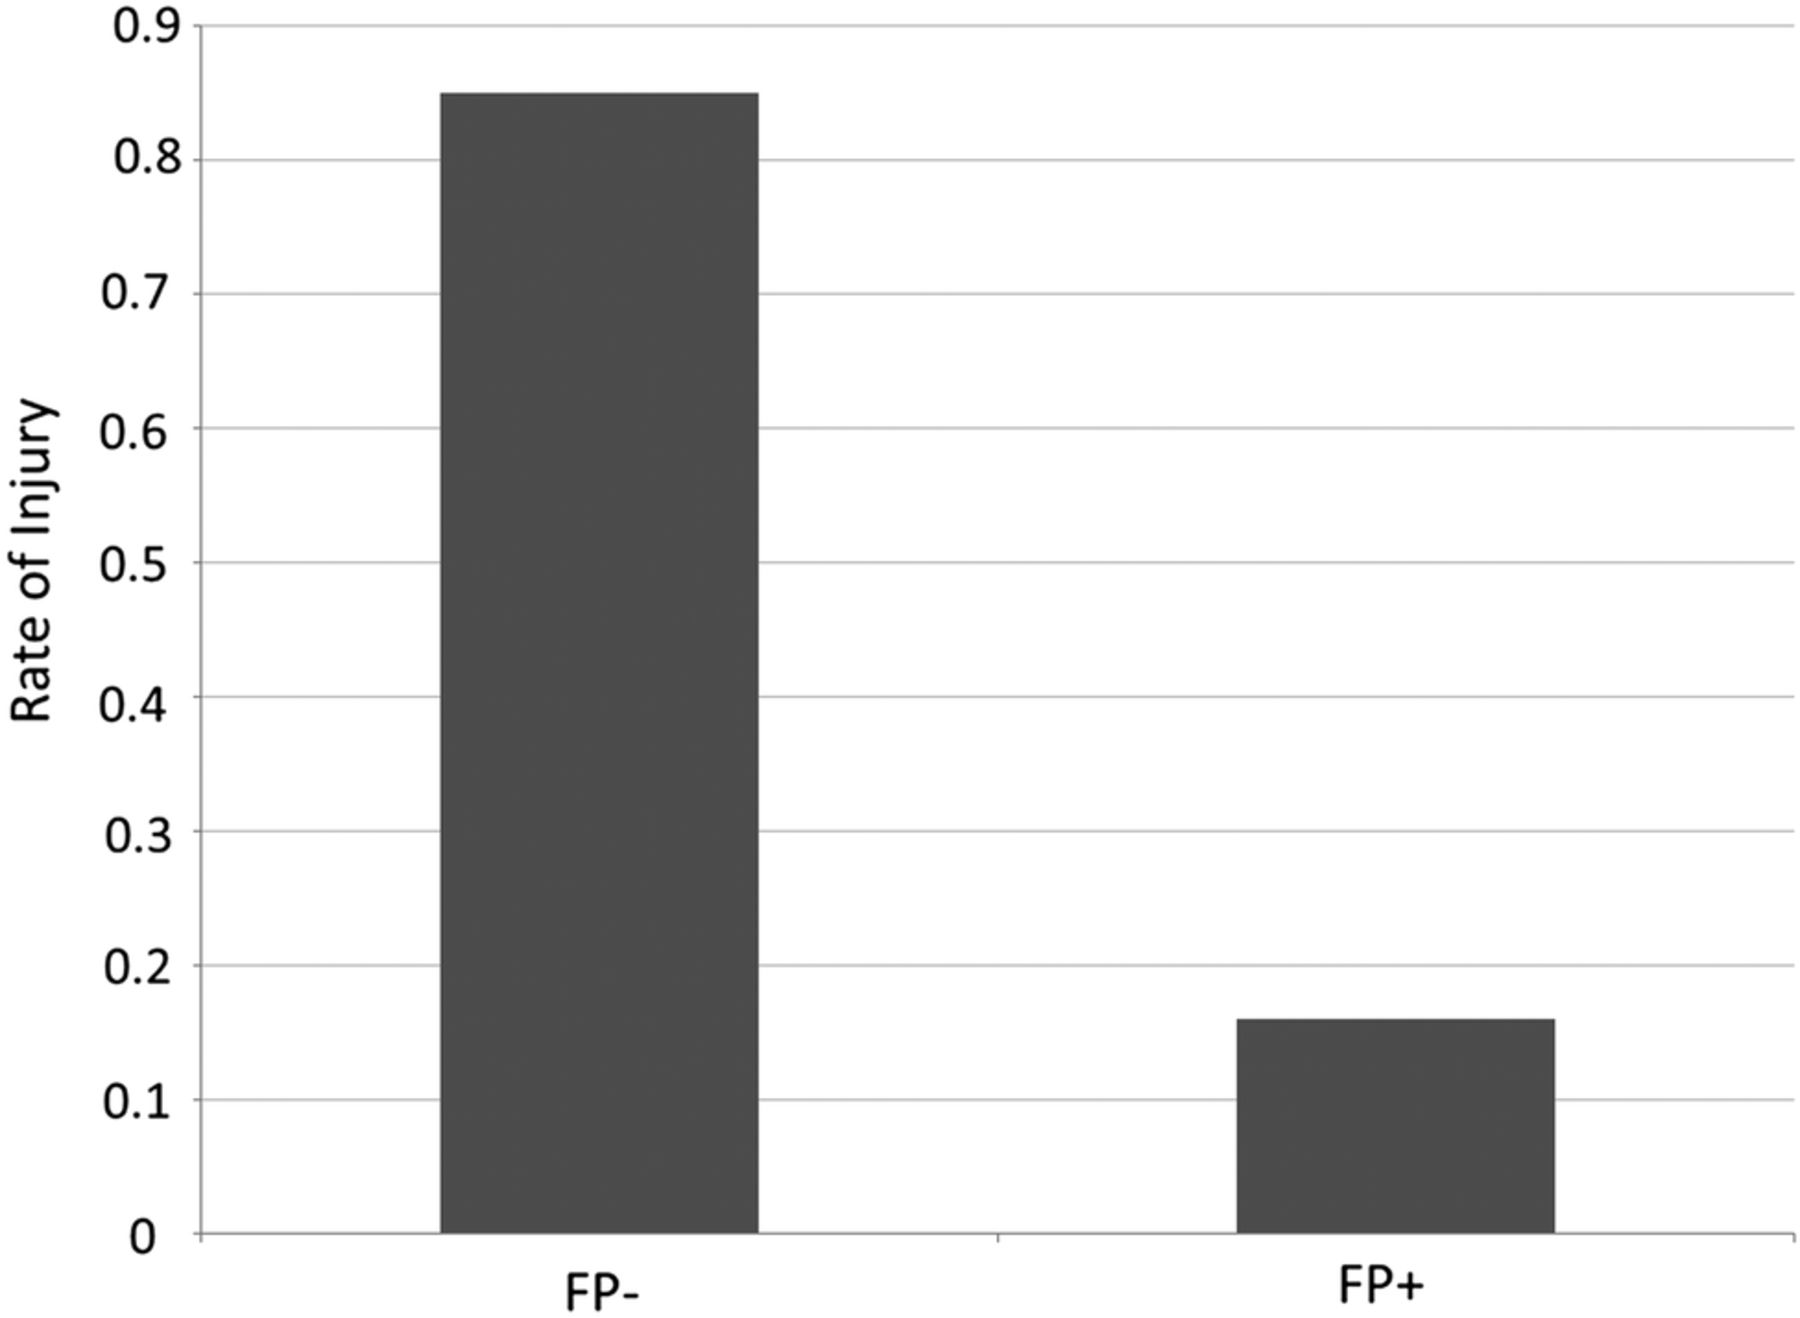
Most penalised teams sustained a rate of 0.85 injuries per team, over five times the injury rate (0.16) of teams earning most of their FPPs (figure 2).

IFP Bantam A, Bantam B, and Girls U14 A/B (N=37); FP− are teams who lost 2+ FPPs (n=7), FP+ are teams who lost <2 FPPs (n=30). Number of injuries was divided by number of teams (FP− 6/7; FP+ 5/30). One injury was not attributed to a specific team and was omitted from analysis. FPPs, fair play points; IFP, intensified fair play; LOP, level of participation.
Discussion
FP's ability to reduce youth hockey injuries relies on the effectiveness of its behaviour modification to enforce ‘good’ behaviour with rewards and exempt ‘bad’ behaviour from rewards. Inconsistent enforcement of FP limits opportunity for behaviour change. In this study, sportsmanlike teams were at a five times lower risk of injury, demonstrating MN's implementation of FP is potentially effective (figure 2). Despite regular seasons playing by FP rules, most teams had not experienced FP consequences in tournaments prior to this study. Although injuries reported in IFP and NIFP tournaments suggest youth hockey in MN is reasonably safe in most LOPs, opportunities to make youth hockey safer need to be continually explored.
We posited fewer concussions would occur in IFP. This hypothesis was not supported as diagnosed concussions in both conditions were too few for statistical comparison. Nevertheless, the majority of injuries (73%) in both conditions were head-related, with HHWDC occurring four times as often in NIFP.
Ten of 12 HHWDC and 6 of 11 ‘other injuries’ reported occurred to Bantam B players, a LOP that permits body checking. Possible causes of injury are: (A) inadequate coaching on technique and skill training in checking in both Peewee and Bantam; (B) B-level players may be less knowledgeable about rules and lack hockey awareness compared to A-level players; and (C) players may have less developed motor skills and lack flexibility, balance, strength and experience to maintain optimal body positioning during a check. Although Girls U14 is non-checking, there were five injuries, three of which were head hits. These may have resulted from forceful physical contact.
In 1989, Regnier et al20 reported fewer hostile penalties and 12 times fewer fractures in Peewee leagues without body checking. In our study, zero injuries were recorded during 140 Peewee A and B games, likely attributable to a combination of the no body checking rule implemented in Peewee by USA Hockey in 2011 and FP. Penalty comparisons between IFP and NIFP, overall, within most LOPs, were not significant, although Peewee B and Girls U14 were significantly less penalised in IFP than NIFP (p=0.006; p=0.048). The minority of IFP teams who repeatedly lost FPPs was responsible for the rejection of our hypothesis.
Limitations
Research directed at understanding injury causation in youth sports is necessary to determine effective efforts to eliminate these factors. Such research is difficult to conduct in real life situations, thus this study has limitations. The voluntary nature of youth sport organisations, the time and effort-intensive nature of contacting all parents in many locations, uncertainties of parent participation and player availability, and the travelling involved in tournaments contributed to our failure to obtain informed consent. These impediments forced an executive decision at the outset of the first tournament to reduce this prospective research to a ‘fan in the stands’ study. Only variables available to spectators in the stands were studied. Primary investigators were blinded to player identifiers and were only informed of injury classifications. No medical follow-up was obtained pertaining to severity or symptom resolution. Consequently, some HHWDC may have been diagnosed as a concussion during medical follow-up as concussion symptoms often have a delayed onset post-head hit. The Mayo Clinic Concussion Survey and demographic data, such as concussion history, were also not obtained. Some score sheets (11.7%) collected after the tournaments were incomplete and were not included in the analysis. Finally, one Bantam A injury lacked a team identifier and therefore was not included in analysis.
Conclusions
In over 1370 player game hours, 3 concussions, 12 HHWDC, and 11 ‘other injuries’ were evaluated on site by medical professionals (table 1). These incidences, under IFP and NIFP rules, with the absence of body checking in Peewee, and in MN where FP was launched in 2004, are, as expected, lower than previously reported injury rates in older Junior Gold players.11
When IFP LOPs were examined, the seven teams who forfeited their FPPs sustained six injuries for an injury rate of 0.85 per team. Conversely, 30 teams who earned their FPPs sustained a total of five injuries for an injury rate of 0.16 per team. Thus, the ratio of injuries sustained by frequently penalised teams was five times higher than teams playing in a FP rule compliant manner. This ratio, occurring in a small subgroup and accounting for injuries in Bantam and Girls U14, was higher than the 3:1 ratio shown by Emery in Peewee teams in non-checking and checking leagues.21 The subgroup of offending teams—those who took the majority of penalties, forfeited the majority of FPPs and were associated with the most injuries—impeded the acceptance of our hypothesis that that IFP would result in a safer game.
Recommendations
Although our data show that IFP had modest benefit, the small subgroup of teams responsible for both the high number of FPPs forfeited and the consequential rate of injury prompt that the following actions be taken:
Robust FP programmes must be implemented to ensure a decrease in penalties, and thus injuries. This is important given the significant clinical, economic,22 academic and psychosocial consequences of youth hockey injuries. Research on Peewee, Bantam and Junior Gold hockey players showed FP effectiveness in reducing penalties and injury rates, thereby supporting the results of this study.11 ,15 Recent acknowledgement of the negative consequences of repetitive head hits23 ,24 and potential litigation should prompt national hockey organisations to adopt programmes, such as FP, that focus on safety, skill development and sportsmanship.
Tournament directors must exercise the authority to refuse acceptance of offending teams into forthcoming tournaments unless contingencies are met that stop injurious behaviour (ie, such teams must earn 75% of FPPs).
Finally, the removal of body checking in the Bantam LOP must be considered. Previous studies show injuries occur due to variations in player size, rule infractions and impact forces via checking.20 ,21 ,25 ,26 Without body checking, Peewee games are fast and skilled with players competing skillfully in seeking puck possession. Based on our study, the absence of injuries in both Peewee tournament conditions validates the benefits of the USA Hockey and Hockey Canada rule change to remove body checking in Peewee. Furthermore, this provides support for removal of body checking in Bantam.
Acknowledgments
The authors express their appreciation to USA Hockey Foundation for funding and to USA Hockey's Safety and Protection Committee co-director Dr Alan Ashare. Tournament Directors Dan Christenson and Nick Nyhus, Minnesota Hockey's President Dave Margenau, and Steve Morse were very helpful. Heidi Herness assisted on protocol development and Hilary Young, DPT, Ashley Rundle, DPT, Jessica Lane, DPT, and Michael Boyd, DPT helped with data collection of Individual Exposure Time. Rachel Christenson and Emily Larson ‘ran’ the fair play table and retrieved score sheets for scanning from all IFP games. Kristen Greek ATC, ATR and Eric Crowley ATC, ATR assisted with injury assessment and data categorisation, respectively. All ATCs and EMTs are to be thanked for their role in assessment of injuries at the tournaments.
References
Footnotes
Contributors AMS designed the study, data collection and interpretation. DVG initiated the IRB process, communicated with tournament directors, arranged study teams and supervised data collection and entry. DL assisted with study design and statistical analysis. JKJ coordinated post-data collection research and prepared paper for publication. CE supervised to ensure injuries were diagnosed consistently between IFP and NIFP tournaments. DAK assisted in manuscript editing, data formatting and interpretations. BMF assisted with manuscript, table and figure formatting. KA assisted in organising research database. AAH assisted with manuscript and figure preparation. SMN assisted with manuscript and figure preparation. MJS helped to obtain funding and edited manuscript.
Funding This research was funded by the USA Hockey Foundation.
Competing interests None declared.
Ethics approval Mayo Clinic Institutional Review Board.
Provenance and peer review Not commissioned; externally peer reviewed.