Article Text

Abstract
Aim To assess the error in predicting physical activity energy expenditure (PAEE), using a multisensor device in wheelchair users, and to examine the efficacy of using an individual heart rate calibration (IC) method.
Methods 15 manual wheelchair users (36±10 years, 72±11 kg) completed 10 activities: resting, folding clothes, wheelchair propulsion on a 1% gradient (3456 and 7 km/h) and propulsion at 4 km/h (with an additional 8% of body mass, 2% and 3% gradient) on a motorised wheelchair treadmill. Criterion PAEE was measured using a computerised indirect calorimetry system. Participants wore a combined accelerometer and heart rate monitor (Actiheart). They also performed an incremental arm crank ergometry test to exhaustion which permitted retrospective individual calibration of the Actiheart for the activity protocol. Linear regression analysis was conducted between criterion (indirect calorimetry) and estimated PAEE from the Actiheart using the manufacturer's proprietary algorithms (group calibration, GC) or IC. Bland-Altman plots were used and mean absolute error was calculated to assess the agreement between criterion values and estimated PAEE.
Results Predicted PAEE was significantly (p<0.01) correlated with criterion PAEE (GC, r=0.76 and IC, r=0.95). The absolute bias ±95% limits of agreement were 0.51±3.75 and −0.22±0.96 kcal/min for GC and IC, respectively. Mean absolute errors across the activity protocol were 51.4±38.9% using GC and 16.8±15.8% using IC.
Summary PAEE can be accurately and precisely estimated using a combined accelerometer and heart rate monitor device, with integration of an IC. Interindividual variance in cardiovascular function and response to exercise is high in this population. Therefore, in manual wheelchair users, we advocate the use of an IC when using the Actiheart to predict PAEE.
- Spinal Cord Injury
- Disability
- Physical Activity
- Multi-sensor
This is an Open Access article distributed in accordance with the Creative Commons Attribution Non Commercial (CC BY-NC 4.0) license, which permits others to distribute, remix, adapt, build upon this work non-commercially, and license their derivative works on different terms, provided the original work is properly cited and the use is non-commercial. See: http://creativecommons.org/licenses/by-nc/4.0/
Statistics from Altmetric.com
Background
There is a paucity of research focusing on the impact of physical activity (PA) on the health of disabled groups, particularly wheelchair users. There are an estimated 750 000 wheelchair users in the UK. Locomotion and movement patterns in wheelchair users are very different to those in ambulatory individuals and, as such, further studies are required to develop tools to quantify PA levels.
Recently, through technological advancements, there has been an increase in the application of accelerometer-based monitors to measure free-living physical activity energy expenditure (PAEE).1 However, the assessment of PA in wheelchair users is still reliant on subjective self-report methods.2 ,3 The Physical Activity Recall Assessment for People with Spinal Cord Injury (PARA-SCI) has relatively modest associations (R2=0.62) with criterion measures of PAEE4 and limited utility due to exclusion of subjective appraisals and the technical complexity of administration.5 Criterion or ‘gold standard’ measures (ie, indirect calorimetry, observation and doubly labelled water) are highly accurate and often compared with outputs from activity monitors during laboratory validation trials. Yet these measures require expensive/sophisticated equipment or are impractical for use outside of the laboratory. Pedisic and Bauman6 suggested that accelerometer-assessed PAEE using algorithms intrinsic to certain devices may not be generalisable to a target population, certainly an issue for groups with differing movement patterns such as wheelchair users. Therefore, the logical first step prior to using objective devices in surveillance research is to ensure that these have been validated for use in specific populations.
Previous research has assessed the validity of a number of objective methods to predict PA levels of wheelchair users. These include attaching a custom data logger onto the wheel7 or a triaxial accelerometer8 to the frame of the wheelchair to capture certain mobility characteristics such as average speed and distance travelled. While unobtrusive, these devices offer limited information on the intensity of activities performed and somewhat modest associations with energy expenditure (EE). Recently, hand rim propulsion power9 was evaluated to address this limitation. However, any device on the wheelchair cannot distinguish between self-propulsion or assisted propulsion and cannot quantify non-wheelchair activity. An alternative approach has been the use of body-borne movement sensors. Previous research has identified that the wrist is the most appropriate anatomical location to accurately predict PA in wheelchair users across a range of propulsion speeds10 and in a laboratory environment.11 While this is encouraging, accelerometry alone does not capture the physiological strain associated with movement behaviours that produce similar acceleration profiles but have a different energy cost, such as changing gradient or load carriage.12
Multisensor devices, which integrate accelerometry and physiological signals to predict PAEE, are commonly used in studies of able-bodied participants. Previous validation work in wheelchair users has focused on the integration of dual-axis accelerometry and physiological measures (eg, heat flux) to predict EE.13 ,14 Previous studies in able-bodied participants have supported the utility of combined heart rate (HR) and accelerometer devices to estimate EE.15 ,16 The Actiheart (AHR) is a commercially available multisensor device which incorporates HR monitoring and accelerometry into a single unit. It is widely used to measure free-living PA in able-bodied individuals17 ,18 and further research in diverse populations has been recommended.19 The aim of this study was to assess the error of the AHR device in predicting PAEE in wheelchair users and to assess the efficacy of individual HR calibration (IC).
Methods
Participants
Fifteen male manual wheelchair users (n=15) volunteered to participate in this study, which was approved by the University of Bath's Research Ethics Approval Committee for Health (REACH). Each participant was informed of any potential risks and benefits and signed an informed consent form prior to taking part in the study. Time since injury was self-reported on the basis of when the medical condition was first diagnosed by a clinician. All participants provided written informed consent. Demographic characteristics of the participants are presented in table 1. A 20 mL fasted blood sample was obtained from the antecubital vein to be analysed for cardiovascular (CV) disease risk biomarkers. These data are outside the scope of this manuscript and have not been presented here.
Participant characteristics
Study protocol
Prior to testing, participants were asked to refrain from caffeinated drinks and vigorous exercise for at least 10 and 24 h, respectively. The mass of the wheelchair and participant was recorded in light clothing to the nearest 10 g using platform wheelchair scales (Detecto BRW1000). The wheelchair, along with the participant's shoes, was weighed separately and subtracted from the total mass.20 Supine length was also measured using a metallic tape (Lufkin).
Participants completed a wheelchair propulsion protocol on an adapted treadmill (HP Cosmos Saturn 250/100r, HaB International Ltd), across a range of treadmill velocities (3–7 km/h) and gradients (1–3%), including load carriage (+8% body mass) and a folding clothes task. The full activity protocol is described in detail elsewhere.21 Each activity (table 2) was assigned in order of intensity and lasted for 6 min interspersed with 4 min recovery periods.
Measured PAEE, predicted GC and IC PAEE, heart rate, accelerometer counts, RPE and number of participants per trial for each activity (mean±SD)
Assessment of EE
Expired gases were analysed continuously during each activity (TrueOne 2400, ParvoMedics) using a previously validated system.22 Oxygen uptake (V̇O2) and carbon dioxide production (V̇CO2) were used to estimate EE (kcal/min) in each activity. A Polar Team HR monitor (Polar Electro Inc,) was also worn to simultaneously monitor HR.
Participants wore an AHR (Actiheart, Cambridge Neurotechnology Ltd, Papworth Everard, UK), which integrates accelerometer and HR signals. The AHR unit has been described previously.15 The unit was fitted using two adhesive ECG chest electrodes, according to the manufacturer's instructions. AHRs were initialised to long-term recording with 30 s epochs. PAEE was calculated using the Branched Model technique.23
Resting measures
Following a 10 min rest in a semirecumbent position, HR and resting metabolic rate (RMR) were measured.24 Breath-by-breath data were averaged into four 5 min samples, with additional samples collected if values varied by >100 kcal/day. The mean of these samples was accepted as RMR.
Incremental arm crank ergometry test
Participants underwent a 9–12 min peak oxygen uptake (V̇O2 peak) test using an electrically braked arm crank ergometer (Lode Angio, Groningen, The Netherlands). This was conducted at the end of the activity protocol, using a continuous, incremental test until volitional exhaustion. A cadence of 75 rpm was required throughout and a starting intensity of 35 W was typically chosen, although this was based on the participant's training history. The resistance was increased by 14 W every 3 min. EE and HR were averaged over the final minute of each stage.
Twenty-four-hour record
Participants were asked to carry out their normal daily activities for 24 h while being monitored using AHR to determine sleeping HR.15 This provided a 24 h ‘snapshot’ of habitual PA. Furthermore, permanent wheelchair users (n=13) were asked to log their PA as accurately as possible to estimate PAEE using the adapted PA compendium.25 Twenty-four-hour PAEE was estimated from self-reported PA and AHR. These data are only available for eight participants.
Data handling
Assuming that dietary-induced thermogenesis was negligible (ie, participants were fasted), RMR (kcal/min) was subtracted from total EE to generate PAEE for each activity. Comparisons between the ‘criterion’ measurement of PAEE (indirect calorimetry) and AHR were made between the final 2 min of each activity.
Common equations to predict RMR in the general population are inappropriate to use for individuals with an SCI.26 Measured RMR was entered, as the Schofield equation overpredicted by 12% (range −6% to 27%). Sleeping HR, measured during the 24 h record, and maximum HR, measured during the V̇O2 peak test, were also entered into the AHR software. Measured EE values from the rest test and during V̇O2 peak assessment were entered into the ‘other HR calibration’ tab in the AHR software as per the manufacturer's instructions to derive an IC model.
Pearson product moment correlation coefficients (r) and coefficients of determination (R2) statistics were conducted to assess the association between the criterion PAEE and predicted PAEE (generic group calibration, GC and IC). SE of the estimate (SEE) was calculated for each correlation. Error statistics, including the mean absolute error (MAE) and mean signed error (MSE), were calculated. As the absolute error is likely to increase with exercise intensity,27 the percentage error of estimate was also calculated. R2, r and SEE statistics were determined to assess the relationship between 24 h self-reported PAEE and predicted PAEE (GC and IC). Independent t tests were performed to assess differences between predicted PAEE (GC and IC) and the PA log during the 24 h follow-up. Statistical significance was set at a priori of α<0.05.
Results
Accelerometer counts, HR and Rating of Perceived Exertion (RPE) all increased linearly with increasing exercise intensity (table 2). Absolute HR on its own explained 57% of the overall variance in PAEE (r=0.76, SEE=1.07 kcal/min). Acceleration along the longitudinal axis of the trunk explained 65% of the variance in the prediction of PAEE (r=0.81, SEE=0.96 kcal/min). Three and two participants were unable to complete the 7 km/h propulsion speed and 4 km/h (3% gradient) tasks, respectively. Unusable HR traces were recorded for one participant in the folding clothes and 4 km/h (3% gradient) trials, and for separate participants in the 3 and 5km/h propulsion trials. These data points were therefore excluded from the analyses.
Criterion PAEE was very strongly and near perfectly associated with GC (r=0.76, p<0.01) and IC (r=0.95, p<0.01), respectively. The GC explained 57% of variance in the prediction of PAEE with an SEE of 1.07 kcal/min, compared to the IC which explained 91% of variance in PAEE with an SEE of 0.49 kcal/min (figure 1).

Scatterplots showing the relationship between the criterion PAEE and predicted PAEE, using GC (A) and IC (B). The straight line represents the best fit, and the dashed line indicates the line of identity. AHR, Actiheart; GC, group calibration; IC, individual heart rate calibration; PAEE, physical activity energy expenditure; SEE, SE of the estimate.
The degree of agreement between estimated and criterion PAEE is displayed in figure 2 (A,B). The mean bias ±95% Limits of Agreement (LoA) was 0.51±3.75 and −0.22±0.96 kcal/min for the GC and IC, respectively. Error statistics between the criterion and estimated PAEE for each activity are shown in table 3. Removal of these data for the able-bodied basketball player did not impact the nature of the regression relationships or error statistics in any meaningful way.
MSE and MAE expressed as kcal/min and a percentage of predicted PAEE for the GC and IC
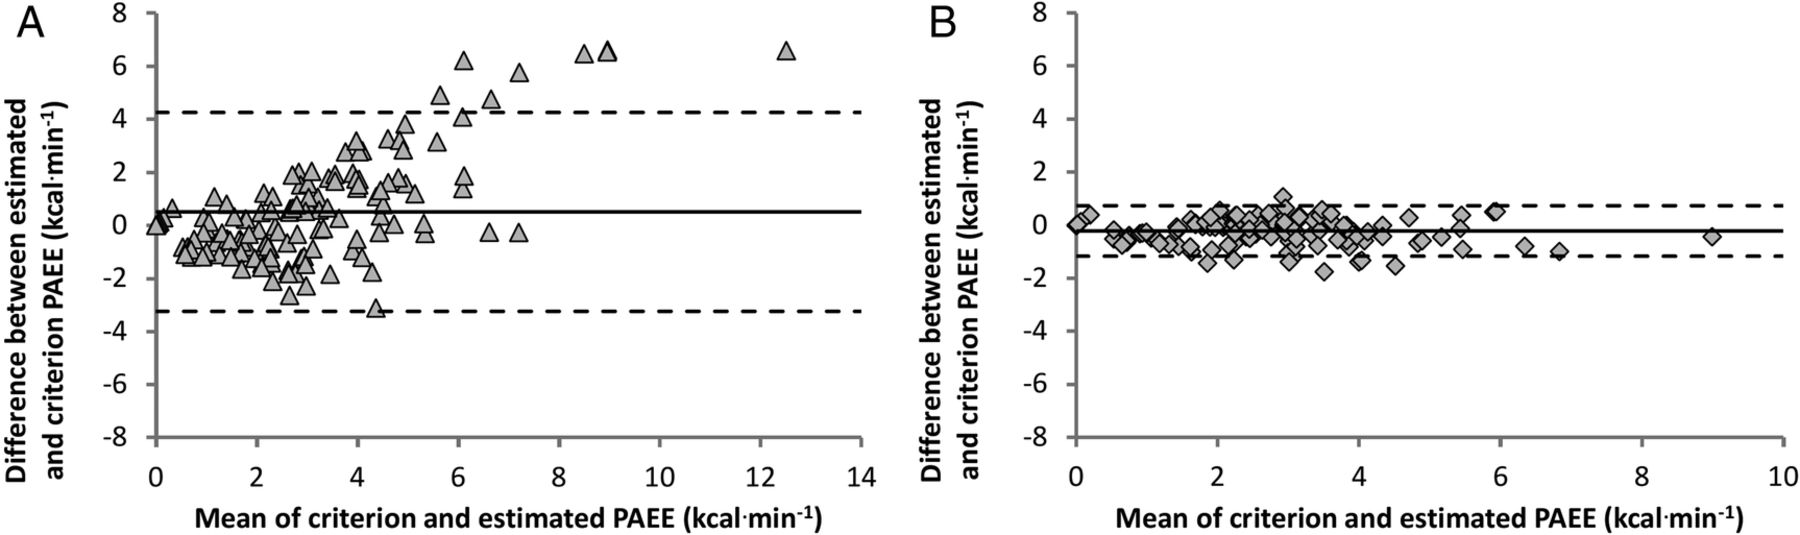
Bland and Altman plots for the criterion PAEE and estimated PAEE, using GC (A) and IC (B). The bold line represents the mean difference and dashed lines represent the upper and lower 95% LoA. GC, group calibration; IC, individual heart rate calibration; PAEE, physical activity energy expenditure.
Twenty-four-hour record
The mean±SD reference method-derived PAEE (self-reported PA log) was 662±353 kcal/day, but predicted to be 631±428 kcal/day by GC, and 588±500 kcal/day by IC. There were no significant differences in predicted PAEE between the reference standard and both AHR methods. PAEE, quantified by the reference method, was very strongly associated with IC (R2=0.50, p=0.03) but only moderately associated with GC (R2=0.16, p=0.24) (figure 3). The SEE were 269 and 365 kcal/day for the IC and GC, respectively.

The relationship between the predicted PAEE GC (○ dash/ dot line) and IC (▴
 solid line) against the reference physical activity log method. AHR, Actiheart; GC, group calibration; IC, individual heart rate calibration; PAEE, physical activity energy expenditure.
Discussion
This study aimed to assess the validity of using a multisensor (AHR) device to predict PAEE in a heterogeneous sample of wheelchair users. These results show that accounting for the interindividual variance by conducting IC can improve the accuracy of predicting PAEE. IC better estimated PAEE than GC and explained an additional 34% of the variance in PAEE (91% vs 57%), when measured across a range of activities conducted in a controlled laboratory environment. Furthermore, habitual 24 h free living PAEE was significantly correlated (R2=0.50, p=0.03) with the reference standard PA log in a subsample of permanent wheelchair users. These findings highlight the importance of using individual HR calibration when practitioners and researchers use multisensor devices, incorporating HR, to predict PAEE in wheelchair users.
Laboratory protocol: sources of error
Triaxial accelerometers worn on the wrist have been found to predict 86% and 74% of the variance in predicting PAEE and V̇O2, respectively, in wheelchair users across a range of propulsion speeds10 and in a laboratory environment.11 However, these previous studies did not include gradients or additional mass on the chair. Previous work using an identical activity protocol to ours found that raw acceleration outputs from a GENEActiv device worn on the wrist explained 77% of the variance in predicting PAEE.21 However, the GENEActiv underpredicted PAEE by 10.6% and 20.3% during the 2% and 3% gradients, respectively. The MAE was also 22.6% for the 8% of body mass task.21 In the present study, IC underpredicted by 4.1% and overpredicted by 11.9% during the 2% and 3% gradients, respectively. Furthermore, MAE was not noticeably elevated for the gradient and load carriage tasks compared with the 4 km/h trial. This emphasises how integrating individually calibrated HR and acceleration data better captures the differing energy cost of activities despite similar acceleration profiles.
HR has benefits as a physiological variable as it increases linearly and proportionately with exercise intensity and thus oxygen uptake.28 HR alone in this study explains 57% of the variance in the prediction of PAEE. Hayes et al29 found that HR alone only explained 8.5% of the variance in measured EE in individuals with an SCI, but this improved to 55% when an IC was performed. Simply using raw HR data may not be useful to predict PAEE due to a large degree of interindividual variance in the HR–PAEE relationship.30 Some of the interindividual variance can be accounted for by using HR above resting level and adjusting for sex.15 ,23 These variables are factored into the AHR proprietary algorithms (GC), which might help capture generic differences in CV function.
As HR at lower exercise intensities is affected by other factors, such as psychological or thermal stress, integration of acceleration values may offer a more reliable prediction of PAEE. This is an issue when monitoring a population which predominantly performs sedentary and light-intensity activities in a free-living environment.31 To counteract this issue with HR, during low-intensity activities the Branched Model equation,23 intrinsic to the AHR software, gives a relatively low weighting to HR in the prediction of PAEE. For higher intensity activities, where HR has been shown to be more accurate in predicting PAEE for individuals with an SCI,29 the AHR utilises the branch which favours HR over acceleration in the prediction of PAEE. Even with these processing features, our results suggest that combining HR and acceleration along the longitudinal axis of the trunk explains no more of the variance in the prediction of PAEE than HR alone (57%), when using GC.
Laboratory protocol: comparison of GC and IC
The movement patterns of wheelchair users are primarily restricted to the upper limbs, as such exercise appears to elicit a somewhat different V̇O2–HR relationship. Raymond et al32 showed that V̇O2 was 25% higher (1.58 vs 1.26 L/min), but HR was 13% lower (132 vs 149 bpm) during combined arm and electrical stimulation-induced leg cycling exercise compared with arm cranking exercise alone at the same power output in individuals with an SCI. The lack of lower limb muscle innervation and absence of the skeletal muscle pump leads to a reduction in venous return and a compensatory increase in HR to maintain cardiac output. As such, the gradient of the V̇O2–HR relationship for upper body exercise may be shallower than for lower body exercise. The GC model, derived from Brage et al,30 and utilised here was designed to predict EE during ambulation. The 14.6% mean PAEE overprediction across all activities for the GC could be a result of HR being misinterpreted as corresponding to a higher V̇O2.
Visual inspection of figure 2A indicates a considerable degree of heteroscedasticity, and the sizeable 95% LoA (±3.75 kcal/min) shows a large degree of interindividual variance for the GC, potentially linked to disability aetiology. For individuals with a higher level SCI (≥T6: n=8), normal CV homoeostasis can be disrupted.33 Autonomic nervous system disruption can result in a blunted CV response to exercise and, in some instances, an absence of sympathetic drive to increase HR above 130 bpm.34 Our results reflect the variability in HR responses to exercise in this population, with peak HR responses ranging from 130 to 200 bpm. Another factor known to have an impact on the HR–PAEE relationship is the variance in fitness.35 Our sample had a wide spread of aerobic capacities, with peak oxygen uptake ranging from 16.7 to 41.1 mL/kg/min. The range in aerobic capacity in wheelchair users is large and reflects the degree of functional impairment and autonomic nervous system disruption in certain conditions.36 Considering the type of exercise performed, the attenuated CV responses to exercise and large variation in fitness, an IC is therefore of upmost importance when assessing PAEE in wheelchair users.
Initial research into the validity of using another multisensor activity monitor (SWA) in wheelchair users revealed sizeable EE estimation errors ranging from 24.4% to 125.8% during activities from resting and deskwork to wheelchair propulsion and arm crank ergometry.13 This error was most likely a result of the manufacturer's prediction model not being able to classify the types of upper body physical movements commonly performed by wheelchair users. Recent work,14 using new prediction models to track these upper body movements, has reported reduced mean absolute estimation errors of 16.8%. This is identical to that reported for IC in this study.
Twenty-four-hour comparison
The majority of PA validation research in this population has mostly been performed in a controlled-laboratory environment. In this study, free-living 24 h PAEE was compared with a self-reported PA log to confer concurrent validity. This reference method has been used previously in wheelchair users.37 Our analysis was conducted using a relatively small subsample of participants, as PA logs from five of the full-time wheelchair users lacked detailed information to derive an accurate estimation of PAEE. Considering the difficulties with criterion PAEE monitoring during free living for individuals who use a wheelchair, other researchers have encouraged simply evaluating the agreement and disagreement between measures.38 In this study, IC 24 h free-living predicted PAEE was significantly associated with the reference method (r=0.72), whereas GC was not (r=0.41).
Strengths and limitations
A significant strength of this study was that we used a comprehensive wheelchair propulsion protocol consisting of various velocities and gradients, as well as an activity of daily living. Also, individual differences in RMR were accounted for, which previous studies have not. A potential limitation of this study was that it only included one activity of daily living. However, this allowed us to identify the relatively large error estimate, even with the IC (error 43.1%). This reflects the somewhat atypical movement patterns associated with such tasks. More activities of daily living and those of moderately vigorous intensity should be included in future studies. There was a diverse range of disabilities within our participant sample; yet this is in keeping with previous research9 and in accordance with best practice recommendations for PA validation studies.39 Many previous studies have focused solely on individuals with an SCI4 ,14 but, compared with this study, these previous results are limited in their generalisability to other individuals who use wheelchairs.
In conclusion, we demonstrated that PAEE can be accurately predicted using a multisensor device, which incorporates acceleration and HR, in wheelchair users. The error associated with predicting PAEE in manual wheelchair users is improved approximately threefold by using individual HR calibration. Considering that the interindividual variance in CV response to exercise is high among individuals who use wheelchairs, we advocate the importance of using an IC.
What are the new findings?
Physical activity energy expenditure during wheelchair propulsion can be accurately predicted using a multisensor device (Actiheart), which incorporates measures of acceleration and individually calibrated heart rate (HR).
Encouragingly, the inclusion of a physiological signal (eg, HR) can capture the physiological strain associated with behaviours that produce similar acceleration profiles but have a different energy cost, such as changing gradient or load carriage.
This method may be used as an alternative for assessing physical activity energy expenditure (PAEE) in a habitual free-living environment for individuals who use wheelchairs.
How might the study impact clinical practice?
Clinicians may use this physical activity energy expenditure (PAEE) assessment method to assess the efficacy of health behaviour change interventions in this at-risk population. The accurate feedback might encourage an increase in physical activity levels for individuals who use a wheelchair.
Eventually, this methodology may give clinicians and researchers a better indication of the volume and intensity of physical activity necessary to achieve optimal health in individuals who use wheelchairs.
Acknowledgments
The authors would like to thank Dr Tom Evans, Research & Development Director at CamNtech Ltd, for his technical support. They are also extremely grateful to the research participants for their time, effort and commitment.
References
Footnotes
Contributors TEN, JPW, DT and JLJB conceptualised this paper and developed the study protocol. TEN and JPW collected and analysed the data. All authors were involved in the interpretation and review of the results. TEN drafted the manuscript and revised it according to feedback from the other authors. All authors have reviewed and approved the final version of the manuscript.
Competing interests None declared.
Patient consent Obtained.
Ethics approval University of Bath Research Ethics Approval Committee for Health (REACH).
Provenance and peer review Not commissioned; externally peer reviewed.
Data sharing statement All raw data are available from the University of Bath data repository.