Article Text

Abstract
Background Insufficient postmatch recovery in elite players may cause an increased risk of injuries, illnesses and non-functional over-reaching.
Objective To evaluate postmatch recovery time courses of physical performance and biochemical markers in team ball sport players.
Study design Systematic review.
Data sources PubMed and Web of Science.
Eligibility criteria for selecting studies This systematic review was conducted according to Preferred Reporting Items for Systematic Reviews and Meta-Analyses guidelines. The Critical Review Form for Quantitative Studies was used to evaluate quality. Studies were included if they met the following criteria: (1) original research evaluated players’ physical recovery postmatch; (2) team/intermittent sports; and (3) at least two postmeasurements were compared with baseline values.
Results Twenty-eight studies were eligible. Mean methodological quality was 11.2±1.11. Most used performance tests and biochemical markers were the countermovement jump test, sprint tests and creatine kinase (CK), cortisol (C) and testosterone (T), respectively.
Summary/conclusions The current evidence demonstrates that underlying mechanisms of muscle recovery are still in progress while performance recovery is already reached. CK recovery time courses are up to ≥72 hours. Soccer and rugby players need more time to recover for sprint performance, CK and C in comparison to other team ball sports. There are more high-quality studies needed regarding recovery in various team sports and recovery strategies on an individual level should be evaluated.
Clinical relevance Ongoing insufficient recovery can be prevented by the use of the presented recovery time courses as specific practical recovery guidelines.
- creatine
- elite performance
- fatigue
- recovery
This is an Open Access article distributed in accordance with the Creative Commons Attribution Non Commercial (CC BY-NC 4.0) license, which permits others to distribute, remix, adapt, build upon this work non-commercially, and license their derivative works on different terms, provided the original work is properly cited and the use is non-commercial. See: http://creativecommons.org/licenses/by-nc/4.0/
Statistics from Altmetric.com
What is already known on this subject?
The recovery process is challenging to manage in team ball sports and depends on several contextual factors.
Multiple performance tests and biochemical markers are used to monitor the time course of recovery after training and matches.
Physical performance recovery takes up to ≥48 hours after regular training.
What are the new findings?
After matches, underlying mechanisms of muscle recovery last up to ≥72 hours, despite recovery of physical performance after ≥48 hours.
For soccer and rugby the time course of recovery is longer in comparison to other team ball sports for performance tests (sprint) and biochemical markers (creatine kinase and cortisol).
Clinical vigilance on ‘hidden’ recovery may prevent ongoing insufficient recovery in elite team sport players.
Introduction
Elite team sports players are exposed to busy schedules of training and matches. During the competitive season, players have a match every week and sometimes even twice a week due to international competitions and domestic Cup league matches. In elite soccer, players participate in approximately 60 matches during a season, which equates 5.5 matches per month.1 These highly congested match schedules put a lot of strain on these players. In addition, studies reveal the high intensity and variable character of intermittent team ball sports of which the time course of match recovery is unknown.2–4 To be able to prevent health problems and to perform at the highest possible level, sufficient recovery is crucial in this matter.5
In order to plan subsequent training sessions or prepare for upcoming matches, knowledge is needed about time courses of recovery.6–8 Although match performance is highly variable and depends on several contextual factors, it is assumed that the intensity during matches is maximal and most strain is placed on players. Profiles of physical performance and biochemical markers after a match in team ball sports (eg, soccer, rugby, handball, basketball, Australian rules football) are needed in order to get a realistic view of recovery and underlying mechanisms.6 9 10 These different types of sport have likely unique recovery profiles caused by the diversity of game demands such as number of jumps, sprints and collisions.4 11 12 By comparing profiles within and between different team ball sports, all of which are characterised by high-intensity and intermittent activities, the recovery process will be better understood.
Different tests and measurements can be used for monitoring recovery and performance.9 There are multiple physical performance tests (eg, jump, sprint, strength, agility, flexibility, technical and aerobic tests) which could be used. Furthermore, biochemical markers (eg, creatine kinase (CK), cortisol (C) and testosterone (T)) in blood and saliva samples could identify the underlying physiology of the recovery process9 after playing a match and contribute in the determination of the time course of match recovery. Finally, self-reported measures (eg, Profile of Mood States or Recovery Stress Questionnaire for Athletes) are demonstrated to be highly relevant to monitor the training response.13
In order to get a better understanding of postmatch recovery kinetics this systematic review focuses on performance tests and biochemical markers in team ball sports. Indeed self-reported measures showed to be sensitive and evaluate multiple constructs in one single measure for monitoring. Although this can be seen as an advantage in daily practice it also limits understanding of which factors play an important role in recovery kinetics after matches. Therefore, we systematically reviewed recovery profiles postmatch of objectively measured indicators in team ball sports.
Knowledge of physical performance tests and biochemical markers that reflect the magnitude of change in volume and or intensity of the preceding match14 is needed for creating balanced training schedules. Appropriate time between the match and the next training impulse should be applied to prevent injuries, illnesses and non-functional over-reaching and achieve optimal performance.
Johnston et al15 recently investigated performance and biochemical responses after training. Although immediately post-training a decrease in performance together with an increase in CK was reported, performance was at pretraining level after 2 hours while CK continues to increase. This suggests that performance again may be normal, but that underlying systems are still recovering. To date, there is no review available that compares objective recovery measures after matches. Therefore, the aim of this review is to synthesise recovery time courses for matches. Based on the variation in match load in different team ball sports typical recovery patterns are expected and therefore require planning. Furthermore, the course of recovery of performance might deviate from biochemical markers. So, in sum, the main aim of this systematic review is to evaluate postmatch recovery time courses of physical performance tests and biochemical markers in team ball sports.
Methods
This systematic review was reported according to the Preferred Reporting Items for Systematic Reviews and Meta-Analyses statement.16
Literature search
A systematic literature search was performed in the databases of PubMed and Web of Science for relevant articles. The search included all available articles which were written in English or Dutch from the period between January 1985 and October 2016. Both databases were searched with the following terms (1 AND 2 AND 3):
Match (OR Game OR Competition OR Post-Match)
Recovery (OR Countermovement Jump OR Counter Movement Jump OR Repeated Sprint Ability OR Creatine Kinase OR Cortisol OR Testosterone)
Team (OR Intermittent OR Player OR Sport OR Baseball OR Basketball OR Football OR Hockey OR Soccer OR Volleyball OR Rugby OR Handball)
Term 1 was restricted to the title to prevent the inclusion of clinical papers. Also, the cursive terms were used as MeSH terms in PubMed (eg, Medical Subject Headings). In PubMed, a preselection was set on text availability (full text), species (human) and language (English and Dutch). All studies found in both databases were taken together after which duplicates were removed.
Literature selection
The first selection of the articles for potential relevance was determined based on title and afterwards on abstract. Of the residuals full texts were obtained and read. Two authors (SHD and SJK) analysed the articles independently. The included articles’ reference lists were searched for relevant articles which were not found by using the initial search strategy. Original research articles were included if they investigated physical recovery of players (mean age ≥18 years) after a match in intermittent sports. An important condition was that at least two postmeasurements were compared with a baseline measurement. Intermittent sport was defined as a sport in which players stop and start often and for short periods. As a result, all team sports were included. Studies were excluded if: (1) full text was not available; (2) the article was not published in English or Dutch; (3) data were not reported in numbers in tables and/or text; (4) recovery strategies were used; (5) the study was an intervention; (6) participants were injured, ill, disabled, overtrained or recovering from injury, illness, disability or overtraining; (7) only one postmeasurement was reported; and (8) there was no baseline measurement. If the two authors disagreed on inclusion, a third author (MSB) decided whether the article was included or not.
Data extraction
Data were extracted from all included articles when statistical significance or a meaningful effect size (ES) across repeated measurements was presented in a result table and/or text. ES (Hedges’ g) were calculated when not reported by the authors and mean, SD and number of participants were reported in absolute numbers. ES ranges were presented for performance tests and biochemical markers using the following criteria: <0.2=trivial, 0.2–0.6=small, 0.6–1.2=moderate, 1.2–2.0=large and >2.0=very large.17 The characteristics of the subjects were extracted from the articles, as well as the sport and type, intensity and duration of the exertion. Furthermore, times of measurements and tests which were used to measure recovery were extracted. All values were converted to percentages, so the reported values of different studies could be compared. Also, protocols were checked and compared with to see whether there were large differences between the protocols of the different studies.
Methodological quality
Two authors (SHD and SJK) assessed the methodological quality of the included articles based on The Critical Review Form for Quantitative Studies.18 These guidelines consisted of 14 criteria: (1) Was the study purpose stated clearly? (2) Was relevant background literature reviewed? (3) Was the design appropriate for the research question? (4) Was the sample described in detail? (5) Was the sample size justified? (6) Was informed consent obtained? (7) Were the outcome measures reliable? (8) Were the outcome measures valid? (9) Were results reported in terms of statistical significance? (10) Were the analysis methods appropriate? (11) Was clinical importance reported? (12) Were conclusions appropriate given the study methods? (13) Are there any implications for clinical practice given the results of the study? (14) Were limitations of the study acknowledged and described by the authors? In line with the scope of this systematic review criteria, 13 was also positively assessed when a ‘practical applications’ section was included in the article.
The different criteria were scored with ‘1’ if it was met and it was scored with ‘0’ if it was not met. This resulted in quality scores ranging from 0 to 14. Articles with a score below 7 were considered to have a poor methodological quality. Articles with scores between 7 and 10 were considered to have a good methodological quality. If an article scored over 10 it was considered to have a high methodological quality.18
Results
Figure 1 shows the eligibility flow diagram. The initial search yielded a result of 321 studies in PubMed and 621 studies in Web of Science. After removing duplicates and application of the inclusion and exclusion criteria, 28 articles were included in this study. The online supplementary table shows the characteristics and main findings of the included studies. In total, 59 physical performance tests and biochemical markers were used to measure recovery. The mean score for the methodological quality of the studies included was 11.2±1.11, which indicates good to high methodological quality. Twenty-six out of 28 studies scored at least 10 points or higher. None of the studies scored below 7.
Supplementary file 1
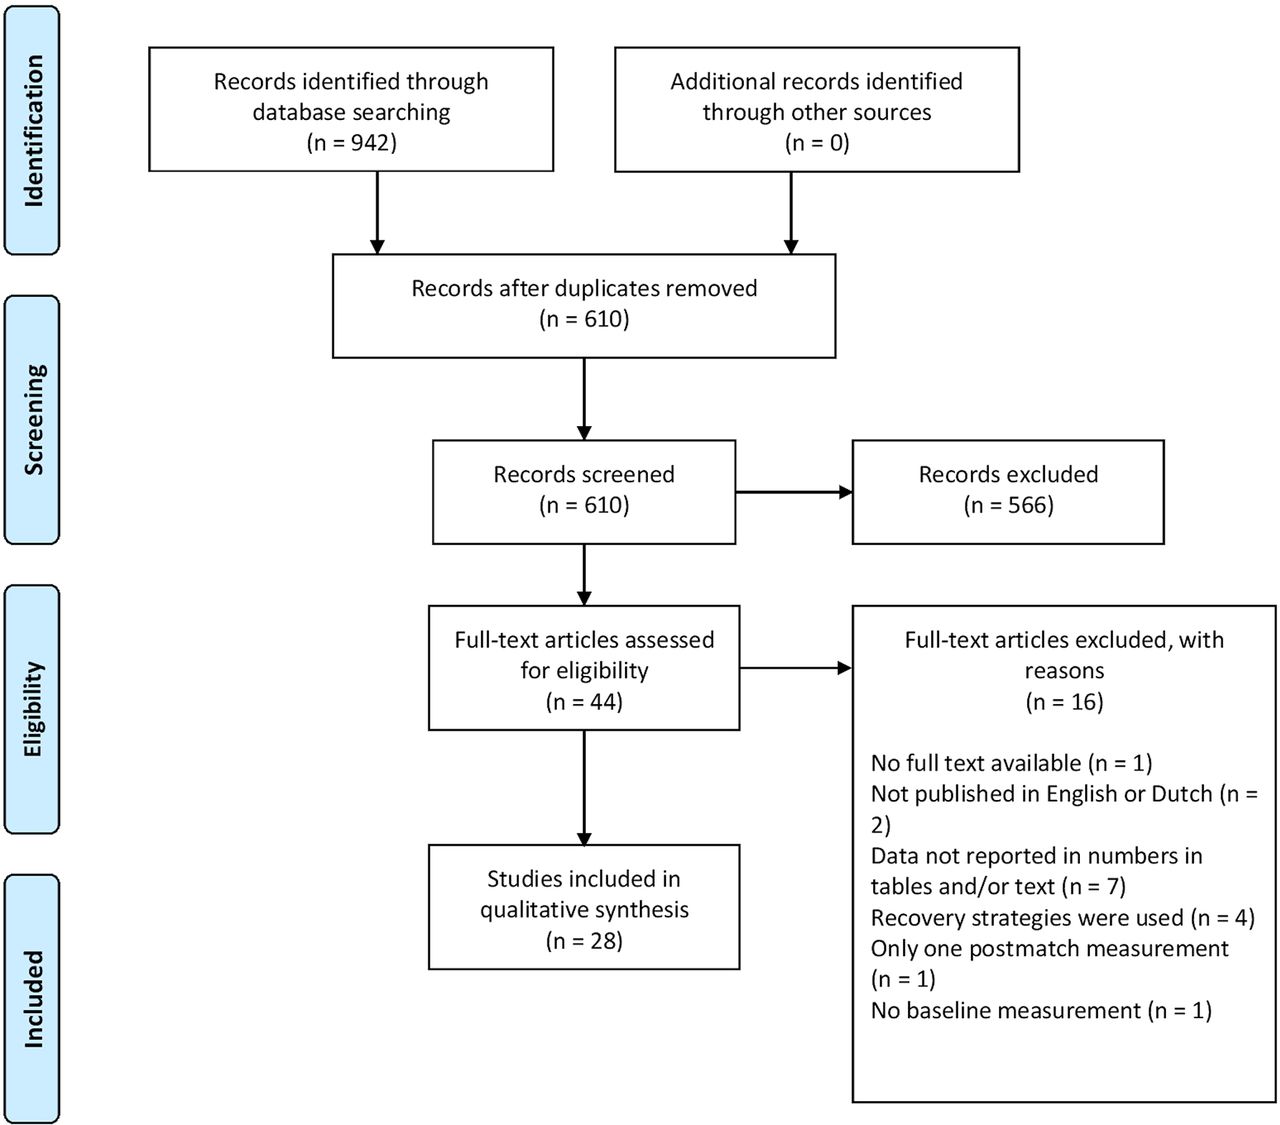
Eligibility flow diagram.
Physical performance tests
Twelve studies used the countermovement jump (CMJ) as performance test to assess changes in jump height.10 19–29 Reduced jump height indicated that the player was not yet fully recovered. However, there were also studies which used CMJ for different outcomes, such as peak power,6 30 31 peak force,30 31 mean power, mean force, flight time, contraction time or flight time:contraction time.20 The reported results for CMJ height can be found in figure 2 (ES range 0.24–1.22). The decrease in CMJ height ranged from 1.6 to 6 cm. Two studies show that CMJ height was decreased most immediately21 27 or 30 min postmatch.26 Other studies did not measure immediately postmatch except for one study.25 These studies showed strongest decrease for CMJ height at 1229 or 2410 19 22–25 hours postmatch. In one study, CMJ height was returned to baseline after 2 hours.21 In the other studies CMJ height returned to baseline after 4810 22 23 27 and 6029 hours. There were three studies in which CMJ height did not increase to baseline values within the last measurement at 4825 26 or 7224 hours postmatch of that study.
Six studies used sprint time to asses recovery, measured over the following distances: 5,10 10,19 25 20,22 23 3010 and 4032 m. Figure 2 shows the reported results for sprint time over different distances, the results of 5 m sprints are not displayed (ES range 0.30–1.10). All studies, except for one,23 showed the strongest increase in sprint time at the first measurement after the match. This was immediately postmatch25 32 or at 2410 19 22 hours postmatch. Sprint time was returned to baseline values after, respectively, 4810 19 32 or 9623 hours. There were two studies in which sprint time did not decrease to baseline values within the last measurement at 4825 or 7222 hours postmatch of that study. In one study, none of the values were significantly different from premeasurement.10
Other performance tests which were used are, for example, the maximum voluntary contraction test,21 24 32 muscle function tests,19 27 squat jump30 and line drill test19 (online supplementary table).

Recovery time course changes (%) in countermovement jump height and sprint time from prematch to 144 hours postmatch. All studies were set on 100% prematch. NS, non-significant from baseline values.
Biochemical markers
CK was the most frequently used biochemical marker and assessed in 19 studies.6 10 19 22–28 33–41 The extent of increase in CK concentration differed among the studies (ES range 0.54–7.80) (figure 3). In seven studies, peak values ranging from 100 to 500 U/L were reported.19 25–28 35 36 Twelve studies reported peak values which were strongly increased in comparison to their premeasurement; values that were six or seven times higher were presented. These values ranged from 671 to 1411 U/L.6 10 22–24 33 34 37–41 Fourteen studies found peak values 24 hours postmatch.6 10 19 24–28 34 37–41 In the other studies peak values were reported after 14,33 1835 36 or 4822 23 hours. In 12 studies, CK concentration did not decrease to baseline within the times of measurement.6 22 24–26 28 33 35 37–40 In the other studies, CK concentration returned to baseline after 42,36 48,19 27 34 41 7210 or 120 hours.23
Other biochemical markers which were often used were C and T (online supplementary table). Eleven studies used C10 19 20 23 26 29 33 36–38 42 and T.10 19 20 23 26 29 33 35 36 38 42 T:C ratio as anabolic/catabolic balance was calculated in eight studies.10 20 26 29 33 36 38 42

Recovery time course changes (%) in creatine kinase from prematch to 144 hours postmatch. All studies were set on 100% prematch. NS, non-significant from baseline values.
There were six studies which measured the concentration of C from blood samples10 19 23 26 33 36 and five studies measured it from saliva samples.20 29 37 38 42 Peak values measured from blood samples ranged from 219 to 662 nmol/L, whereas peak values measured from saliva samples ranged from 16.3 to 80 nmol/L. All studies reported peak values immediately after the match, except for one study20 and the ones that did not measure immediately after.10 29 36 These studies reported peak values at 14,2918–20,36 2420 and 4810 hours postmatch. In two studies, C was decreased to baseline values after 24 hours.19 23 In the other studies this was at 14,33 48,37 38 6029 or 7210 hours. In three studies values became significantly different again at 3833 and 9637 38 hours postmatch. In one study C was decreased for 48 hours postmatch.26 However, there were also two studies in which none of the values were reported as significantly different from baseline.20 36 One study did not compare values with baseline measurements.42
Seven studies measured the concentration of T from blood samples,10 19 23 26 33 35 36 the other four studies used saliva samples.20 29 38 42 In four studies T concentration did not clearly increase or decrease prematch or postmatch.10 19 23 36 One study reported a strong decrease prematch38 followed by an increase postmatch with two other studies.35 38 42 In four studies T concentration decreased postmatch.20 26 29 33 T concentration increased again to baseline values within 2429 33 or 4820 hours or stayed significantly different after 4826 hours.
Finally, the online supplementary table shows that six and five studies measured leucocytes7 19 22 23 33 35 and uric acid,10 19 22 23 35 respectively. C-reactive protein10 19 23 26 33 35 40 and interleukin-67 19 23 26 33 40 were respectively used in seven and six studies. Other biochemical markers that were used are, for example, myoglobin,10 36 41 lactate dehydrogenase,23 35 36 protein carbonyls19 22 23 and salivary immunoglobulin A.43
Discussion
The main purpose of this systematic review was to synthesise postmatch recovery time courses of physical performance tests and relevant biochemical markers in team ball sports. The main finding is that physical test performance (eg, CMJ height and sprint time) returned to baseline after 48 hours in most studies.10 19 22 23 27 32 For the biochemical tests, higher variability within and between studies and tests is shown. In 14 out of 19 studies, CK returned to baseline after ≥72 hours10 22–24 37 38 or did not decrease to baseline within the times of measurement.6 22 24–26 28 33 35 37–40
Performance tests: role of type of sport, exertion and playing level
CMJ height was the most used performance test among the included studies. Players needed at least 48 hours to return to prematch values on this test, with the exception of one study.21 Sprint time was also used often as an indicator of recovery. Recovery time of sprint ranged from 24 to 96 hours. CMJ height and sprint time were measured only in male players in the included studies and ES were small to moderate. In the literature, the validity, reliability and sensitivity of performance test were subject to debate.44 For example, the value of jump height for measuring recovery is limited. Rowell et al14 recently showed that flight time:contraction time is a more sensitive measure of recovery. Although small within-player variation (coefficient of variation (CV) <5%) and high intraclass correlation coefficient (ICC) are reported for the CMJ and sprint tests,45–52 the included studies showed CVs up to 12.8% and 8.2%, respectively. Changes exceed normal variation and thus are relevant.
For CMJ height, one explanation for the length of recovery time courses can be type of sport. Our results indicate relatively longer recovery time courses for basketball in comparison to other team ball sports. One basketball study needed more than 48 hours to reach non-significant values.25 This can be confirmed by another basketball study that reported 96 hours.53 The longer recovery time courses can be explained by the high number of jumps performed during basketball matches.12 25 54 55
For sprint time, duration of recovery time courses can be explained by type of sport, duration of exercise and type of exertion. Two out of four soccer studies reported that more than 72 hours was needed to recover to baseline values.22 23 The other types of sports, basketball25 and handball,19 showed shorter recovery time courses (eg, between 48 and 72 hours). Variability in the duration of total playing time between soccer (2×45 min), basketball (4×12 min) and handball (2×30 min) is evident. It might be expected that longer duration of exercise causes longer sprint recovery time courses. Furthermore, in contrast with soccer, basketball and handball are influenced by interruptions (eg, timeouts, time between quarters, match stops) and the use of substitutions. More short-term recovery in sprint time can be expected when performing these intermittent sports compared with soccer.
Finally, for both CMJ height and sprint time, physical fitness indicated by differences in competition level might explain variability between study results.56 One study with non-elite players showed a strong decrease in CMJ height directly postmatch.27 This is in accordance with Magalhães et al’s 57 study that showed a strong decrease followed by a long recovery period (>72 hours) in second and third division soccer players. The sharp drop in jump height and subsequent longer recovery time may indicate that lack of physical fitness in these amateur players affects recovery. A similar pattern is seen in sprint time. This was relatively high at the lower level in comparison to the elite level.57 58 Players played second and third divisions57 and secondary division,58 respectively. In these studies, sprint time also needed to recover longer.
Biochemical markers and variability of recovery kinetics
The most used biochemical markers to monitor recovery were CK, C and T. Except for one study,35 strict protocols were set up for measuring these biochemical markers. Players followed a controlled diet, were measured at exactly the same times of the day and were excluded from heavy exercise other than the match during the measurements. Although CK (ES were large to very large) shows high variability (CV >25%) between individual players and poor sensitivity,52 59–62 the included studies showed CVs up to >700%. This exceeds normal variation which makes it relevant to discuss. For C and T high ICCs are reported in standardised conditions.63
CK helps with the synthesis of ATP in muscles and increases after a match as a result of muscle damage.64–66 All studies that investigated CK took blood samples after a match. Interestingly, 11 studies reported much higher peak values for CK concentration6 10 22–24 33 34 37–39 41 than other included studies.19 25 27 28 35 36 A possible explanation for this might be type of sport. High-peak values of CK were all found in soccer or rugby studies. The other studies represent more variation in type of sport. This suggests that soccer and rugby may be physically more demanding and muscle damage caused by, for example, distance covered, accelerations and high impacts is higher.38 67–69 According to the literature this cannot be concluded unambiguously.70 However, taking competition level, position on the field21 71 72 and type of methodology (eg, global positioning system, time-motion analyses)73 74 into account, it complements studies investigating player load or recovery in these sports.4 11 70 75–79
Three studies in soccer and rugby reported lower peak values.27 28 35 Deviation in one of these studies27 might be explained by the fact that samples were taken after a simulated match, while in all studies that reported high-peak values, samples were taken after an official match. Possibly, next to lower physical exertion during simulated matches,80 lower peak values of CK can be expected.
C is an important catabolic stress response hormone and is considered to be increased as a result of playing a match.64 81 The results of the included studies showed a high variance in time needed for C concentrations to decrease to baseline values. However, most soccer or rugby studies needed at least 48 hours to recover.10 29 37 38 So, it seems that in line with CK, also C is responsive to higher loads in soccer and rugby and this causes longer recovery times. This is in accordance with previous studies reporting a greater C response in higher intensity and longer duration.82 83
T is an anabolic hormone that stimulates glycogen synthesis and protein signalling which is needed for tissue repair.64 84 85 In general, an unclear pattern of T responses is demonstrated by the included studies. This is in line with previous reported differences between rugby and other sports by Cormack et al20 that support the high demands of this sport. In our systematic review one soccer and one rugby study reported higher T levels directly postmatch and returned to baseline within 18–24 hours.35 38 Another two studies showed a decrease immediately postmatch followed by an increase to baseline within 14 hours33 or delayed higher T levels in the following days42 in rugby players. Three studies showed a prolonged decrease that was interpreted as unclear and trivial by the authors,20 an increase to baseline after 60 hours29 or deviation still 48 hours postmatch.26 Finally, in four studies no significant change in T concentration was found.10 19 23 36 Individual variability in T responses might explain the differences found in the studies.
Practical perspective
Overall, results of this systematic review suggest that team ball sports players need, in most cases, at least 48 hours to perform at the same level as prematch. Some biochemical markers needed to return to baseline values even longer. Especially, CK is increased for ≥72 hours postmatch. This is the case for all team ball sports. However, CK reached higher values in soccer and rugby. In addition, for soccer and rugby it took longer to return to baseline for sprint performance, CK and C in comparison to other team ball sports.
The slow decrease in CK suggests that, although performance is already at prematch values, the muscles need more time to recover. This is an important finding that should be kept in mind working as a practitioner or support staff in daily practice with team ball sport players. In the decisions-making process of determining adequate recovery, coaches should distinguish short term and long term under recovery and consider context such as stage of season. If, for example, performance is unaffected during a tournament, but biochemical indicators are, one can still decide to play in optimal formation. This is especially true when full recovery is possible after the tournament and cumulative fatigue is avoided. However, if biochemical markers indicate poor recovery without upcoming phases of rest, then coaches could implement recovery strategies or prescribe rest within the training schedule. This seems important to avoid the ongoing process of insufficient recovery that is not directly demonstrated by performance tests. Based on practical perspective and cost-benefit arguments, one could decide to only perform biochemical analyses with clear indication of ongoing insufficient recovery during, for example, fixture congestion. Commonly used performance tests with their recovery time courses will then, in all likelihood, deviate from biochemical markers that could indicate more precise muscle damage.
Finally, there is a need to understand individual players and their recovery profiles. Recovery is highly dependent on both variation in load that players are exposed to during matches (eg, position dependent and variation of time during matches) and individual capacities (eg, aerobic and anaerobic).24 32 These capacities determine how players respond to the match load and play an important role in their ability to recover from that load. Therefore, it is crucial to monitor individual match load and recovery.
Strengths and limitations
This systematic review provides extensive insight in postmatch physical recovery in team ball sports with at least two postmatch measurements compared with prematch values. This satisfies the lack of a valuable overview of postmatch recovery time courses. Despite studies that not reported data in numbers in tables and/or text were excluded, results of these studies are affirmative with the results found.53 57 58 79 86–88
A limitation of this review is that it does not provide information on the available tests and processes of psychological recovery. It has been stated that a disturbed balance between both, physiological and psychological, stress and recovery can lead to maladaptation, and performance can be directly influenced by a poor mental state.89 90 However, the aim of this systematic review was to understand and compare objective, single-construct, recovery measures after matches.
Future research
Twenty-three out of 28 included studies investigated recovery in soccer or rugby. Unfortunately, studies in other sports were not as extensive as the soccer or rugby studies. Therefore, it is more difficult to get an indication of recovery of players from these sports. High-level original research is needed to get more insights in postmatch recovery in these sports. Furthermore, studies using recovery strategies or interventions were excluded from this review. Future studies should also evaluate the effects of these recovery strategies (eg, active recovery, sleep, mental recovery) on an individual level in the practical setting of team ball sports.
Conclusions
This systematic review has demonstrated high variability in postmatch recovery time courses for various team ball sports within and between physical performance tests and biochemical markers. In addition, it is determined that CMJ height and sprint time recover faster than CK. For the short term, this suggests that on the basis of performance recovery players might be physically ready from 48 hours postmatch for a subsequent training or match. However, in the long run, demonstrated by the longer time course of recovery of CK (≥72 hours), there might be the risk of ongoing insufficient recovery. For practitioners and support staff, it is important to have clear and complete insight in these recovery processes for different types of sports. Imposing load without sufficient recovery might lead to injuries, illnesses and non-functional over-reaching.91–93 Therefore, especially during fixture congestion with less than 48 hours of rest between consecutive matches, it is crucial to monitor match load and subsequent recovery closely based on recovery profiles.94
References
- 1.↵
- 2.↵
- 3.↵
- 4.↵
- 5.↵
- 6.↵
- 7.↵
- 8.↵
- 9.↵
- 10.↵
- 11.↵
- 12.↵
- 13.↵
- 14.↵
- 15.↵
- 16.↵
- 17.↵
- 18.↵
- 19.↵
- 20.↵
- 21.↵
- 22.↵
- 23.↵
- 24.↵
- 25.↵
- 26.↵
- 27.↵
- 28.↵
- 29.↵
- 30.↵
- 31.↵
- 32.↵
- 33.↵
- 34.↵
- 35.↵
- 36.↵
- 37.↵
- 38.↵
- 39.↵
- 40.↵
- 41.↵
- 42.↵
- 43.↵
- 44.↵
- 45.↵
- 46.↵
- 47.↵
- 48.↵
- 49.↵
- 50.↵
- 51.↵
- 52.↵
- 53.↵
- 54.↵
- 55.↵
- 56.↵
- 57.↵
- 58.↵
- 59.↵
- 60.↵
- 61.↵
- 62.↵
- 63.↵
- 64.↵
- 65.↵
- 66.↵
- 67.↵
- 68.↵
- 69.↵
- 70.↵
- 71.↵
- 72.↵
- 73.↵
- 74.↵
- 75.↵
- 76.↵
- 77.↵
- 78.↵
- 79.↵
- 80.↵
- 81.↵
- 82.↵
- 83.↵
- 84.↵
- 85.↵
- 86.↵
- 87.↵
- 88.↵
- 89.↵
- 90.↵
- 91.↵
- 92.↵
- 93.↵
- 94.↵
Footnotes
Contributors All authors contributed to the manuscript according to the four criteria of The International Committee of Medical Journal Editors Recommendations for the Conduct, Reporting, Editing, and Publication of Scholarly Work in Medical Journals (ICMJE Recommendations 2013): substantial contributions to the conception or design of the work; or the acquisition, analysis, or interpretation of data for the work; drafting the work or revising it critically for important intellectual content; final approval of the version to be published; and agreement to be accountable for all aspects of the work in ensuring that questions related to the accuracy or integrity of any part of the work are appropriately investigated and resolved.
Competing interests None declared.
Provenance and peer review Not commissioned; externally peer reviewed.