Article Text

Abstract
Clinical medicine defines dehydration using blood markers that confirm hypertonicity (serum sodium concentration ([Na+])>145 mmol/L) and intracellular dehydration. Sports medicine equates dehydration with a concentrated urine as defined by any urine osmolality (UOsm) ≥700 mOsmol/kgH2O or urine specific gravity (USG) ≥1.020.
Objective To compare blood versus urine indices of dehydration in a cohort of athletes undergoing routine screenings.
Methods 318 collegiate athletes (193 female) provided blood and urine samples and asked to rate how thirsty they were on a 10-point visual analogue scale. Serum was analysed for [Na+], while serum and UOsm were measured using an osmometer. USG was measured using a Chemstrip. Data were categorised into dehydrated versus hydrated groupings based on these UOsm and USG thresholds.
Results Using UOsm ≥700 mOsmol/kgH2O to define dehydration, 55% of athletes were classified as dehydrated. Using any USG ≥1.020 to define dehydration, 27% of these same athletes were classified as dehydrated. No athlete met the clinical definition for dehydration (hypertonicity; serum [Na+]>145 mmol/L). Normonatremia (serum [Na+] between 135 mmol/L and 145 mmol/L) was maintained in 99.7% of athletes despite wide variation in UOsm (110–1298 mOsmol/kgH2O). A significant correlation was confirmed between serum [Na+] versus UOsm (r=0.18; P<0.01), although urine concentration extremes did not reflect derangement in serum markers or thirst rating.
Conclusion Urine concentration thresholds classified 27%–55% of collegiate athletes as dehydrated, while no athlete was dehydrated according to blood [Na+] measurement. Practitioners should caution against using urine indices to diagnose or monitor dehydration, because urinary output is a response rather than a reflection of (tightly regulated) blood tonicity.
- fluid balance
- hypohydration
- athlete
This is an Open Access article distributed in accordance with the Creative Commons Attribution Non Commercial (CC BY-NC 4.0) license, which permits others to distribute, remix, adapt, build upon this work non-commercially, and license their derivative works on different terms, provided the original work is properly cited and the use is non-commercial. See: http://creativecommons.org/licenses/by-nc/4.0/
Statistics from Altmetric.com
What are the new findings?
A urine osmolality above 700 mOsmol/kgH2O would classify >50% of athletes as dehydrated, in a spot sample hydration check, despite normal blood sodium concentration, potassium concentration and osmolality values that would confirm the athletes were euhydrated (normonatremic) at rest.
Urine concentration, either as urine osmolality or specific gravity, should not be used as a surrogate measure for blood hydration markers in a spot sample hydration check conducted at rest.
A urine osmolality value above 700 mOsmol/kgH2O, and/or urine specific gravity above 1.020, reflects urinary free water conservation and not clinically significant (intracellular) dehydration in a large cohort of collegiate athletes.
Introduction
Dehydration is a term that generally reflects any loss of body water and linked to poor athlete performance, heat illness, skeletal muscle cramps and acute renal failure in athletes.1
Given the potential for unfavourable health and performance consequences, a number of definitions have been used to define dehydration with an end goal of prevention. The American College of Sports Medicine uses non-invasive measures to define dehydration as a urine specific gravity (USG) ≥1.020 and/or urine osmolality (UOsm) ≥700 mOsmol/kgH2O.1 The advantage of using non-invasive measures is that they are quick, simple and easy to use in both laboratory and field settings. Studies using body weight and urine indices as outcome measures support the conclusion that athletes must drink beyond the physiological dictates of thirst to maintain adequate hydration levels.1
In contrast to non-invasive measures of hydration status, clinical medicine is reliant on blood (serum or plasma) chemistry measurements to define and subdivide dehydration into two (often related) categories: intracellular and extracellular dehydration.2 3 Intracellular dehydration is defined by any loss of intracellular water that induces cellular desiccation and hypertonicity (ie, increases in blood sodium concentration ([Na+]) or osmolality).2 3 Extracellular dehydration, which is also referred to as hypovolaemia or volume depletion, alternatively reflects any loss of sodium from the extracellular space that compromises plasma volume.2 3 The distinction between intracellular and extracellular dehydration is diagnostically important when choosing the best therapeutic strategies for water lack (intracellular dehydration) and/or sodium lack (extracellular dehydration). This clinical definition also reflects the physiological tenets of fluid homeostasis, which strive to protect tonicity and tissue perfusion.2 4–6 Accordingly, the US Institute of Medicine states that the primary indicator of hydration status is plasma or serum osmolality7 8 with the maintenance of normonatremia (blood [Na+] between 135 mmol/L and 145 mmol/L) central to this evolutionary tenet.6 9 Accordingly, studies using plasma osmolality10–13 or plasma volume14 as indicators of hydration status support the conclusion that thirst is an adequate stimulus to prevent intracellular and extracellular dehydration.
Investigations assessing relationships between urine concentrations versus plasma osmolality (tonicity) in athletes fail to demonstrate statistical significance that would support the utility of using urine indices as a (more practical) surrogate measure of cellular hydration.15–22 The lack of diagnostic utility in using urine indices to predict intracellular dehydration has also been verified in a large sampling of 313 older people in a clinical setting.8 While plasma osmolality remains the hallmark measure of both tonicity and water balance,4–6 derangements in serum [Na+] represent extreme clinical manifestations of fluid imbalance that require emergent treatment.4 6 Accordingly, athlete deaths from underhydration have been associated with hypernatremia (serum [Na+] >145 mmol/L),23 while deaths from overhydration have been associated with hyponatremia (serum [Na+] <135 mmol/L).24
The primary aim of this study is to compare blood and urine indices using two common urine-based definitions of dehydration.1 21 25–27 Additionally, we chose serum [Na+] (instead of plasma osmolality) as our main outcome measure of blood tonicity to more critically reflect the clinical consequences documented in exercise-associated fatalities at the extremes of fluid imbalance.23 24 The practical importance of clarifying the sport (urine) versus clinical (blood) definition of dehydration distills down to one simple—yet hotly debated—question: how much should we drink? Our hypothesis is that dehydration—and utility of using thirst as a guide to prevent dehydration—is highly dependent on the criterion used as the main outcome measure.
Methods
This project was approved by Oakland University’s Institutional Review Board (IRBNET), and written informed consent was obtained from each participant prior to data collection. Data were obtained from collegiate athletes participating in two separate projects.
Project 1
In this project (IRBNET#888153), 40 male and female National Collegiate Athletic Association (NCAA) Division 1 (D1) swimmers presented to the laboratory six times over the first 7 weeks of preseason (Fall) training. Testing occurred on Friday afternoons, between 14:00 and 16:00 as part of a larger project on rhabdomyolysis. Each swimmer provided a spot urine sample, and 5 mL of blood was withdrawn via venipuncture while in a supine position. All urine samples were analysed for USG using a URS-10 CHEMSTRIP inserted into an Uritek TC-101 urine reader (Tecodiagnostics, Anaheim, California, USA) and UOsm using a VAPRO Vapor Pressure Osmometer (Wescor, Logan, Utah, USA). Whole blood samples were analysed for serum [Na+] and potassium concentration ([K+]) using ion selective electrodes at a nearby hospital laboratory (Crittenton Hospital). Serum osmolality was assessed using a VAPRO Pressure Osmometer.
Project 2
In this screening project (IRBNET#778936), 79 NCAA D1 athletes participating in Fall sports (women’s soccer, men and women’s cross country and basketball) presented to the laboratory once, preseason, for a single blood draw at a time (between 09:00 and 15:00) suitable for each team. As part of a larger project, each student-athlete provided a spot urine sample, and 5 mL of blood was withdrawn via venipuncture while in a supine position. All urine samples were analysed for USG using a URS-10 CHEMSTRIP inserted into an Uritek TC-101 urine reader and UOsm using a VAPRO Vapor Pressure Osmometer. Whole blood samples were analysed for [Na+] and [K+] using a Roche 9180AVL electrolyte analyser (Roche Diagnostics, Indianapolis, Indiana, USA). Serum osmolality was assessed using a VAPRO Pressure Osmometer.
Fluid intake was neither monitored nor measured in either project. In general, our student-athletes were not given standardised guidance on the topic of hydration and free to drink any beverage at any time. Our training room provided water bottles plus free access to a sports beverage (Gatorade), milk (plain, chocolate, strawberry and soy) and water to all student-athletes.
In both projects, all urine and serum biochemical hydration indices were measured within 2 hours of collection. Duplicate measurements were conducted in serum samples only when they appeared out of the normal reference range, with the value closest to the normal physiological range used. Blood and urine sampling occurred without restrictions on diet, hydration or activity as ‘spot checks’ obtained in a field setting.18 Thirst was assessed using a 10-point rating scale, with ‘0’ representing ‘not thirsty at all’ and ‘10’ representing ‘extremely thirsty’, either when entering the lab (project 1) or at the time of venipuncture (project 2). This rating scale was adapted from Engell12 and validated as a 9-point28 29 and 11-point rating scale30 as well as a 10 cm (unmarked) visual analogue scale.10 13
Definitions of dehydration
Combined data were artificially categorised into two groups, dehydrated versus hydrated athletes, based on the following two commonly used urine-based definitions of dehydration: (1) UOsm ≥700 mOsmol/kgH2O1 and (2) USG ≥1.020.1 31 The following variables were then compared between dehydrated versus hydrated athletes: serum [Na+], [K+] and osmolality; UOsm and USG; and thirst rating. Normonatremia was defined as any serum [Na+] between 135 mmol/L and 145 mmol/L, with clinical (cellular) dehydration defined as any serum [Na+] >145 mmol/L (hypernatremia).4 6 Relative overhydration was defined as any serum [Na+] <135 mmol/L (hyponatremia).4 6 24
Statistics
All data analysed using Statistica V.13 (Dell, Round Rock, Texas, USA). T-tests with unequal variance were used to analyse differences between urine markers, serum markers and thirst rating using the two urine-based thresholds that categorised athletes into dehydrated versus hydrated athlete groups. Relationships between variables were assessed using Pearson’s product-moment correlations. Data reported as means±SD with statistical significance set a priori at P<0.05.
Results
For project 1, of the 40 swimmers (23 female) that were tested six times, only one individual had missing data at one testing time point (thus n=239, not 240). For project 2, there were 23 males and 56 females who were tested once. Demographic data from both projects detailed in table 1. Data from both projects were analysed collectively, as each data point represented 318 individual athlete ‘spot checks’, tested at random in an ecologically valid setting.
Demographics of male and female participants from project 1 and project 2
Table 2 depicts the hydration variables of interest for the entire cohort of spot checks (n=318), divided into male (n=125) and female (n=193) spot checks, along with the normal range of values. On average, all biochemical variables of interest were within the normal reference range. The only statistically significant difference between male versus female spot check values was noted in USG, with females demonstrating a (mathematically) higher USG compared with males.
Markers of hydration status for entire cohort (n=318) and subdivided into females and males
Table 3 depicts the analyses of hydration variables when dehydration was defined as any UOsm value ≥700 mOsoml/kgH2O.1 Using this definition, 174 (55%) of the athlete spot checks would classify these athletes as dehydrated on arrival into the laboratory. When compared with athletes classified as ‘hydrated’ using this definition, the ‘dehydrated’ athletes had statistically significant elevations in UOsm (by design), USG, serum [Na+] and thirst ratings.
Dehydration defined by urine osmolality (UOsm) whereas dehydration is any UOsm ≥700 mOsmol/kg/H2O, while adequately hydrated is any UOsm <700 mOsmol/kg/H2O
Table 4 depicts the analyses of hydration variables when dehydration was defined as any USG value ≥1.020.1 Using this definition, 85 (27%) of the athlete spot checks would classify these athletes as dehydrated on arrival into the laboratory. When compared with athletes classified as ‘hydrated’ using this definition, the ‘dehydrated’ athletes had statistically significant elevations in USG (by design) and UOsm. There were no differences in any serum variable or thirst rating.
Dehydration defined by urine specific gravity (USG) whereas dehydration is any USG ≥1.020, while adequately hydrated is any USG <1.020
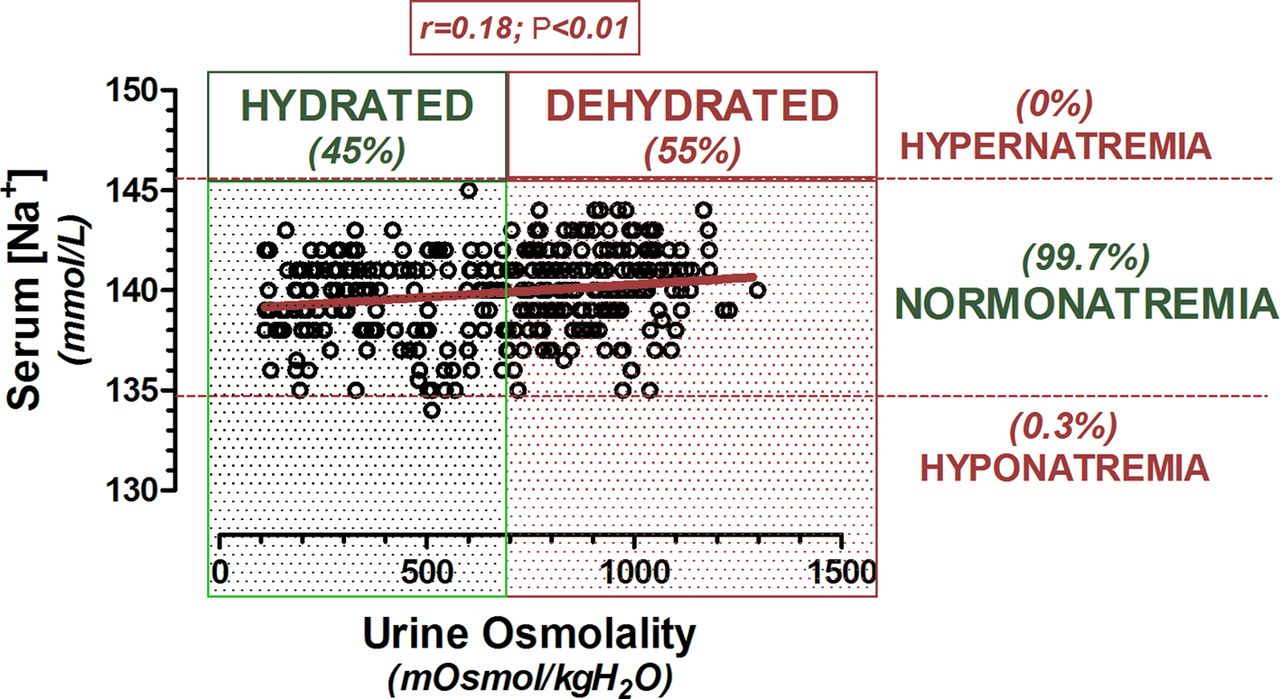
Figure 1 demonstrates the statistically significant positive relationship (r=0.18; P<0.01) between serum [Na+] versus UOsm. Of note, despite the wide range of UOsm values (110–1298 mOsoml/kgH2O), only one serum [Na+] value (134 mmol/L) was outside of the normal reference range of 135–145 mmol/L.24 Significant correlations were also noted between serum [Na+] versus thirst rating (r=0.12; P<0.05), serum [Na+] versus serum osmolality (r=0.24; P<0.001), UOsm versus thirst rating (r=0.20; P<0.001) and UOsm versus USG (r=0.64; P<0.001).

Graph of serum [Na+] versus urine osmolality, when all data points (n=318) were combined. Across the y-axis, no athlete demonstrated intracellular dehydration (hypernatremia; serum [Na+] >145 mmol/L), 99.7% demonstrated normonatremia (serum [Na+] between 135 mmol/L and 145 mmol/L), while one athlete was hyponatremic (serum [Na+]=134 mmol/L). Across the x-axis, 55% of athlete spot checks fell into the dehydrated range (UOsm ≥700 mOsmol/kgH2O), while 45% fell into the hydrated range (UOsm <700 mOsmol/kgH2O). The correlation coefficient (r) was statistically significant (P<0.01), despite serum [Na+] explaining only 3% of the variance in urine osmolality. serum [Na+], sodium concentration; UOsm, urine osmolality.
Discussion
Urine-based definitions identified 27%–55% of our collegiate athletes as ‘dehydrated’ at the time of testing. Those athletes classified as dehydrated using urine criteria (UOsm ≥700 mOsoml/kgH2O or USG >1.020) would have subsequently been instructed to drink more fluids (above the dictates of thirst) to achieve ‘adequate’ hydration levels.1 21 25–27 Conversely, none of our athletes were identified as dehydrated according to serum [Na+] measurement (figure 1). The maintenance of normonatremia—despite wide fluctuations in urine concentration—suggests that these athletes were drinking adequate amounts of fluid in response to osmotic thirst stimulation.4 10 11 The lack of clinical sensitivity for urine indices to detect intracellular dehydration supports previous results obtained from smaller studies involving athletes/exercise15–22 and larger studies conducted in older patients8 and young children.32 The popularity of using urine indices to define ‘inadequate hydration’,33 34 despite a growing body of contradictory evidence, thereby raises critical concern over the apparent medicalisation of a normal physiological response (kidney water conservation).35 36
The maintenance of normonatremia has been documented previously in 80% of 2135 endurance athletes, completing a variety of races ranging from standard (42.2 km) marathons through Ironman Triathlons across four countries.37 With dehydration and water turnover expected to be exceedingly high immediately following prolonged endurance races, only 13% of this large cohort were hypernatremic, while 7% were hyponatremic on race finish.37 This low incidence of dysnatremia thereby underscores the strength of the osmoregulatory system, even under conditions of heightened physiological and psychological stress.
In contrast to blood indices, UOsm definitions categorised 55% (UOsm ≥700 mOsmol/kgH2O)1 of our student-athletes as ‘dehydrated’ at the time of measurement (table 3). By design, both urine values (UOsm and USG) were significantly higher in the dehydrated versus hydrated groups. Serum [Na+] and thirst ratings also demonstrated statistically significant increases in the dehydrated versus hydrated groups. However, the mathematical difference between groups for these regulated variables (140.3 mmol/L vs 139.3 mmol/L for serum [Na+] and 4.6 vs 4.2 for thirst) were not clinically meaningful. The high incidence of dehydration (55%) based on UOsm criteria in the present study concurs with a study performed on 46 (26 male, 20 female) adolescent swimmers, using UOsm ≥700 mOsmol/kgH2O to define dehydration.25 Those authors found that 67% of their swimming cohort were dehydrated on rising (first morning urine sample), 78% were dehydrated immediately prior to training and thirst rating was not significantly different before (4.4/10) versus after (5.5/10) training.25 Thus, despite UOsm concentrations being twice as high in the dehydrated versus hydrated categories in the present study, serum biomarkers ([Na+], [K+] and osmolality) and thirst perception remained remarkably stable.
Another commonly used definition to assess ‘dehydration’ is USG, which takes into account both urine solute mass as well as concentration.38 Using the threshold of any USG value ≥1.020 to define dehydration,1 27% of our athletes were classified as ‘dehydrated’ at the time of measurement (table 4). This incidence is much lower than previous rates demonstrated in other athletic cohorts such as 90% of 107 male adolescent soccer players measured before practice39 and 66% of 263 (138 male, 125 female) NCAA D1 athletes who provided random urine samples.40 Similar to the UOsm findings, there were no mathematical or clinically relevant differences in either serum markers ([Na+], [K+] and osmolality) or thirst rating, since blood tonicity is a physiologically regulated variable.
The previous literature has been consistent with our blood versus urine findings, demonstrating significant relationships between urine markers (such as USG vs UOsm)22 38 but not between urine versus blood markers of hydration status ([Na+] and osmolality).8 21 22 The confounding effects of diet, the timing of fluid intake and the renal response to exercise likely contribute to the poor prognostic utility of using urine indices as surrogate markers for water and sodium homeostasis (plasma tonicity or volume status).41 In contrast to osmoregulatory thirst and arginine vasopressin (AVP) stimulation, urine concentration is not a regulated physiological variable associated with fluid homeostasis.4–6 10 42 43 Urine volume and solute concentration are renal effector responses that are largely subservient to circulating plasma AVP levels.4 5 43 Copious urinary free water excretion is reflective of either: (1) AVP suppression, which largely occurs when fluid intake is in excess of osmoregulatory need,4 or (2) AVP antagonism at the V2 receptor, triggering dilute urine with cellular dehydration.44 Clinically speaking, AVP suppression and antagonism characterise central and nephrogenic diabetes insipidus, both of which are successfully compensated by osmotically driven thirst stimulation to maintain tonicity balance.4
Drinking according to the dictates of thirst will thereby prevent cellular dehydration. Drinking to keep urine clear or maintain body weight may lead to overhydration.24 Accordingly, drinking above thirst has been associated with a 33%–57% incidence of hyponatremia in professional rugby players tested after match play, field and gym training.45 Thus, although urine concentration may be a useful measurement tool, caution is advised against the potential for overzealous adherence to fluid intake guidelines based on urine or any other hypotonic fluid secretion, which may overshoot osmoregulatory need or renal excretion capabilities.
Limitations of our study include an inability to control fluid intake or standardise exercise prior to testing. Our inability to control fluid intake or timing may have contributed to delays in the adjustment of urine indices to plasma changes from fluid absorption, as proposed elsewhere.15 18 Previous research has also shown that exercised-induced fluid losses—without clinically significant dehydration—may have significant effects on other important physiological variables such as heart rate, core temperature, sweat loss, rating of perceived exertion and skeletal muscle metabolism, which may hinder physical and mental performance.1 46 47 However, despite these clear limitations and need for further study, we believe that these data provide a robust ‘snapshot’ of the typical collegiate athlete who is able to preserve cellular size (normonatremia) despite a wide range of urine concentrations, exercise and hydration habits.
In summary, normonatremia was maintained in 99.7% of this random sample of hydration spot checks performed at rest. UOsm ≥700 mOsmol/kgH2O classified 55%, while USG ≥1.020 classified 27% of athletes as dehydrated at the time of testing. This discrepancy between serum versus urine indices likely reflect the differences between using a physiologically regulated versus non-physiologically regulated variables to define dehydration. Since thirst is a physiologically regulated variable of fluid homeostasis, drinking to thirst would be an appropriate fluid intake strategy using serum or plasma criterion to prevent hypernatremia or hyponatremia, at least during resting conditions (pre-exercise). However, according to urine output based definitions of dehydration, drinking above the dictates of thirst is required to suppress AVP and promote a clear and copious free water excretion (aquaresis). Thus, the definition of dehydration varies greatly within various study populations, with subsequent hydration advice subservient to the definition that is used. Figure 2 summarises how the different definitions may yield differential hydration advice from a physiological perspective, at least during a rested state. It is important to emphasise that these data do not question the potential deleterious effects of dehydration—nor drinking to thirst—on performance but rather questions the utility of using urine concentration as a surrogate marker for clinical dehydration in routine student-athlete urine spot checks.

Infographic representing an athlete and summarising how the definition of dehydration that is used (blood vs urine indices) affects whether thirst is (or is not) an appropriate hydration strategy to prevent dehydration in a rested state (pre-exercise), according to the threshold used. UOsm, urine osmolality; USG, urine specific gravity.
Acknowledgments
The authors would like to thank Barb Ledin MT (ASCP) and Crittenton Hospital for assisting with the lab work, Brigid Byrd for coordinating test schedules, Gregory Byrd, Raychel Rusnak, Kristin Landis-Piwowar and Lisa DeCeuninck for assistance with venipuncture. Lastly, we offer heartfelt thanks to all of the student-athletes who enthusiastically participated in these trials. We honour your energy, benevolence and sacrifice through this work.
References
Footnotes
Contributors TDH-B participated in study design, data acquisition and analyses and drafting of the manuscript. CE participated in data acquisition, analyses and drafting of the manuscript. JB, MR and MVM participated in data acquisition. All authors participated in revising the manuscript, and all authors gave final approval on the paper.
Funding This study was supported by Oakland University’s Provost’s undergraduate (MVM) and graduate (MR) awards and Prevention Research Center award (TDH-B).
Competing interests None declared.
Ethics approval Michigan, USA.
Provenance and peer review Not commissioned; externally peer reviewed.